Basics of Navigation Through Entity Panels
This is the default window that will appear when AHF Scope is started:
Figure 6-1: AHF Scope default window
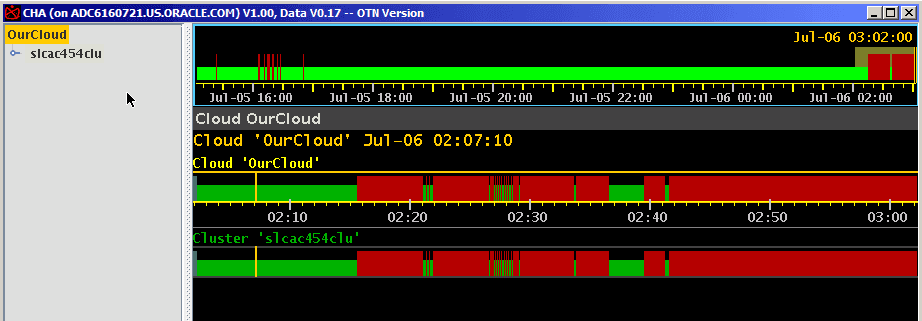
The window contains a navigation tree on the left and an analysis panel on the right. The navigation tree always starts in a symbolic top-level system "OurCloud" and displays all components within its connected Cloud. AHF Scope currently connects to only one GIMR, and thus contains data for all monitored nodes and Oracle RAC databases within a single cluster.
The analysis panel contains three components:
- A system timeline at the top showing a condensed long term system history.
- A status line.
- An entity panel associated with the entity selected in the navigation tree.
The currently selected navigation tree entity is marked with a yellow background.
The analysis panel initially appears with a dark background called "Night Theme". A "Day Theme" displaying dark text on a light background is also available. You can toggle the themes by moving the cursor onto the entity panel and pressing lowercase "w", or by using the right mouse click to access the floating menu and selecting "Night/Day Mode
Figure 6-2: Night/Day mode
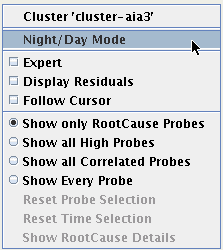
This is the first example of how to use either a Hot Key or a floating menu to perform the same function. For more information about Hot Keys, see List of Hot Keys.
The main panel in Day Theme looks like as follows:
Figure 6-3: Main Panel in Day Theme
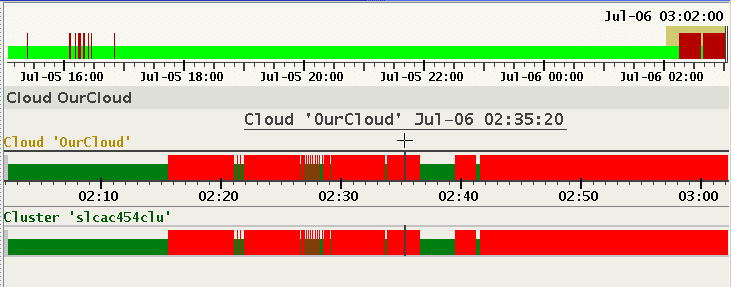
This change is persistent. With every consecutive start, the most recent selected theme is used. For more information about the settings that AHF Scope persists, see Set of Persistent Settings.
Note:
The persistent storage for these settings is associated with a specific user on a specific host. These settings need to be repeated when using AHF Scope on multiple hosts.
The status timelines in the entity panel display for each timestamp the state of its entity marked either green, red, or gray.
- Green means that at that point in time, none of its sub-entities indicate any problem flagged as "abnormal".
- Red means that at least one of its sub-entities is in abnormal state. Mathematically, this means that AHF Scope calculates a union of sets of all sub-entities and propagates its value upward to the top most entity, which is here OurCloud.
- Gray marks periods in time in which no data was received for any of the sub-entities.
- Gray over green marks periods in time in which some sub-entities received no data.
Click the cluster entity under OurCloud. AHF Scope now marks the cluster name with a yellow background, and the entity panel changes to display the cluster details.
Note:
When a cluster entity is selected, the status line under the timeline displays the number of hosts and databases in this cluster.
Figure 6-4: Number of hosts and databases in this cluster
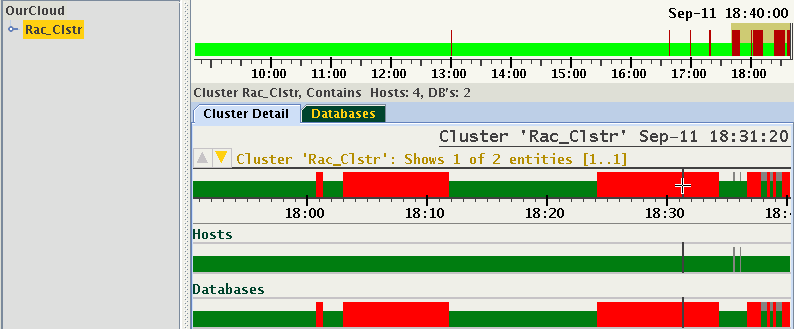
In this hierarchy, the cluster entity contains two sub-entities "Hosts" and "Databases". The above display indicates that all red-marked abnormal states come from one of the databases only.
Any entity in the navigation tree may be expanded to show its sub-entities. Note that expanding the navigation tree does not change the entity panel on the right. This panel changes only when a different entity is selected in the tree.
Note the position of the cursor on the status timeline of the cluster. The entity name will change color to indicate that it has focus. Moving the cursor over the "Databases" status timeline switches the highlighting and focus accordingly. Focusing on a specific entity allows you to enter its panel without moving the mouse pointer to the navigation tree. To step down to the panel of any sub-entity, for example, "Databases" in the image above, you can choose between these methods:
- Select the entity in the navigation tree on the left. This requires a movement of the mouse pointer to the tree.
- Place the cursor on the entity name and double-click it.
- Use a Hot Key without moving the mouse pointer. Press Enter on your keyboard. AHF Scope will select the focused entity and enter its panel. The selected entity will be automatically expanded and highlighted in the navigation tree.
This is the second example of how to use Hot Keys. Instead of moving the pointer across distances to expand an entity in the navigation tree, focus the entity using one hand, and then hit the Enter key on your keyboard. This is by far the fastest way to traverse through the entities.
In this example Entity "Databases" contain two databases of which one indicates abnormal state. When you select this database and step down to its panel, you will see timelines of all its instances.
Figure 6-5: Entity 'Databases' containing two databases
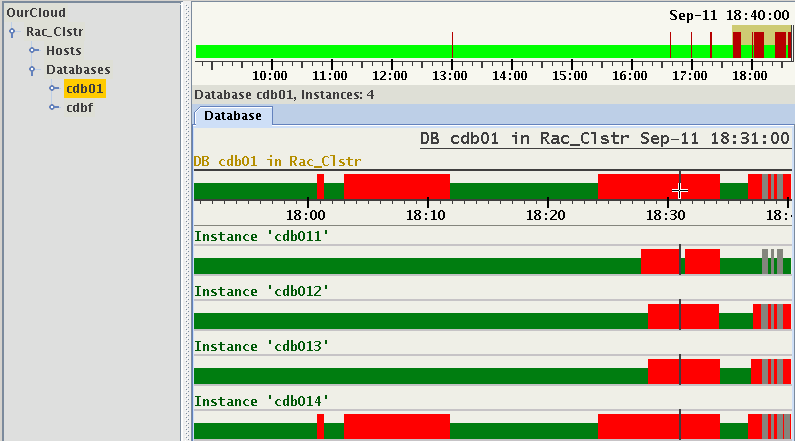
From this example, you can clearly see that the state of the database is a union of states of its instances. This example also shows gray areas in the status bars of instances. They indicate absence of monitored values for some periods in time. The entity might have been stopped, terminated, evicted, or non-responsive. The only known fact is that not a single value was recorded for this entity at this point in time.
With the Instances, we reached one of the final Sub-Entities. These are the Target Entities of CHA. Every type of Target entity has its own specialized panel in AHF Scope.