Target Entities
CHA currently supports two types of target entities: "Host" and "Instance". Using the same example above, lets enter the panel of the second from the top instance cdb012:
Figure 6-6: Target Entities
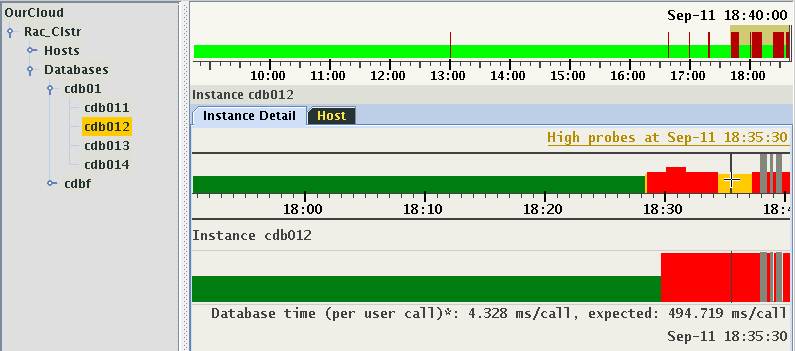
On the panel of an instance (or a host), the top timeline represents the state of the target entity. Any status timeline below represents a time series of individual metrics collected for the target entity, which are referred to as signals or probes. The state of a target entity is represented by four colors:
- Green: The state is normal. None of the probes are in abnormal condition.
- Yellow: Entity state is still normal, but some of the probes are in abnormal condition.
- Red: Entity is in abnormal state. At least one problem (also called "decision") indicates the reason for the abnormal state. The height of the red bar changes with the number of problems at that point in time.
- Gray: Data was not received.
Every single point in the timeline of a target entity holds a set of values:
- State of the entity, which may be green, yellow, red, or gray (missing).
- Set of problems (if indicating red state).
- Set of probes in abnormal state (if indicating yellow state).
The set of indicated probes may change with every time-point. By default, only probes which are in an abnormal state are shown. When there is no problem indicated, the target entity will be yellow on the timeline. There are a collection of options controlling selection of displayed probes that will be described later.
In the above illustration at the time 18:35:30, the state of the instance is indicated by a yellow bar, and below we see that the probe "Database time" is in an abnormal state. Its value at this point in time is 4.328 ms/call, albeit the predicted (or expected) value in the active calibrated model was 494.719 ms/call. The set of probes in abnormal state and their values may change in every individual point in time. When a probe value is reported in a sample, the data set contains:
- State of the probe (normal/high/low).
- Observed value, which may be missing at some points in time.
- Predicted value, which may also be missing at some points in time, or when no prediction for this probe is available, this value is missing at all points in time.
Not every probe is reported in every sample. Some probes might be reported only at certain points in time. A typical example of such probes are DB wait events. When a probe value is not reported, an empty space is displayed in the timeline denoted as gray. Below is another example for the same Target showing a sample at a different point in time. At this point in time, two probes are indicated as abnormal.
Figure 6-7: DB wait events
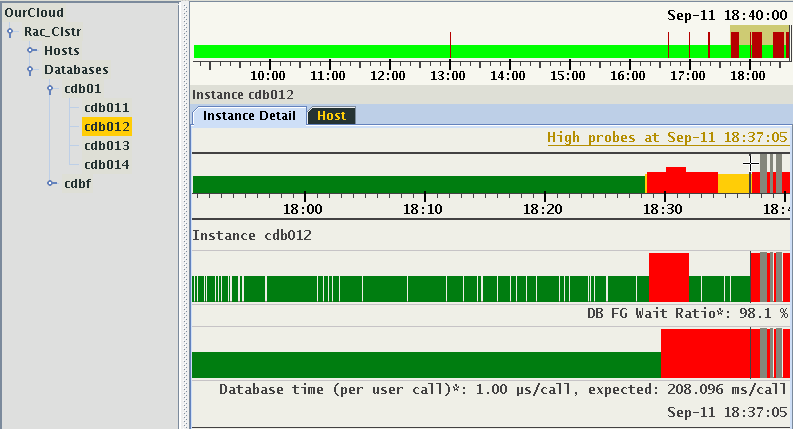
Notice the numerous gaps in the indication of "DB FG Wait Ratio". This is an example of a probe without expected values and whose observed value is not being reported with every sample. This differs from the indication in timestamps in which no values were reported for an entity. These periods of time are marked by the gray bars.
Every type of target entity has a unique panel with specialized tabs. For example, the panel of an instance has a tab "Host", which shows the host where the instance is running. Similarly, a panel of a host has a tab called "Instances", which shows a set of running database instances.
Generally, this panel is used to visualize dynamic dependencies between target entities. The navigation tree depicts only the hierarchy of the logical structure of the installation. The logical structure contains a mix of hardware and software target components in their hierarchical dependency. For example, an entity "Cluster" points to "Hosts", which contains a list of individual hosts. These relationships do not change with time. The dynamic dependencies describe how the target entities relate to each other. These relations may change with time. They are defined by pairs of target entities and ranges of time in which they are valid. Some of these relations may be exclusive. For example, at a specific point in time, an instance is said to run on one host. However, a host can have a number of instances running on it at the same point in time.