16 Monitoring the Recovery Appliance
This chapter explains how to perform basic monitoring of a Recovery Appliance, including configuring the metric and configuration settings.
About Monitoring the Recovery Appliance
This section contains the following topics:
See Also:
"Protection Policies" for an architectural overview
Purpose of Monitoring the Recovery Appliance
A crucial part of ongoing Recovery Appliance administration is regularly monitoring the overall health of the Recovery Appliance, and checking the status of protected databases, backup and replication jobs, and storage usage.
Overview of Recovery Appliance Monitoring Capabilities
This section describes the monitoring tools supplied by Oracle.
Cloud Control
The primary monitoring tool for Recovery Appliance administrators is the Oracle Enterprise Manager Cloud Control (Cloud Control) incident and event notification framework. The primary interface is the Recovery Appliance home page, which prominently displays warnings, alerts, and errors. The monitoring framework integrated with Cloud Control is an effective way of managing issues and tracking them until resolution.
Space management is a crucial part of administering the Recovery Appliance. To have sufficient time to accommodate storage demands, you must know when estimated storage needs are approaching the amount of total storage available. Cloud Control provides warnings and error messages regarding aggregate storage usage, providing ample time to make necessary changes.
Cloud Control enables you to customize settings to meet your management goals. For example, you can receive warnings if the space needed to meet the recovery window goal of a specific database is a user-specified percentage of its reserved space. You can also configure email alerts so that you receive immediate notification of issues without having to log in to the system.
Oracle Configuration Manager
Oracle Configuration Manager collects configuration information (by default, every day) and uploads it to the Oracle Management Repository. If you log a service request, then the configuration data is associated with the service request. Oracle Support Services can analyze the data and provide better service.
Benefits of Oracle Configuration Manager include the following:
-
Reduces time for resolution of support issues
-
Provides pro-active problem avoidance
-
Improves access to best practices and the Oracle knowledge base
-
Improves understanding of customer's business needs and provides consistent responses and services
Oracle Configuration Manager software is installed in each Oracle home. Typically, each Oracle home has a collector configured that gathers and uploads information under its My Oracle Support (MOS) credentials. You can also configure a central collector, which gathers information for the Oracle home in which it resides and Oracle homes in which the collector is disconnected or not configured.
Auto Service Request (ASR)
Auto Service Request (ASR) is a feature that automatically opens service requests when specific Recovery Appliance hardware faults occur. ASR detects faults in the most common server components, such as disks, fans, and power supplies. ASR monitors only server components and does not detect all possible faults.
ASR is not a replacement for other monitoring mechanisms, such as SMTP and SNMP alerts, within the customer data center. It is a complementary mechanism that expedites and simplifies the delivery of replacement hardware.
See Also:
Zero Data Loss Recovery Appliance Owner's Guide to learn how to set up ASR
Cloud Control Interface for Monitoring the Recovery Appliance
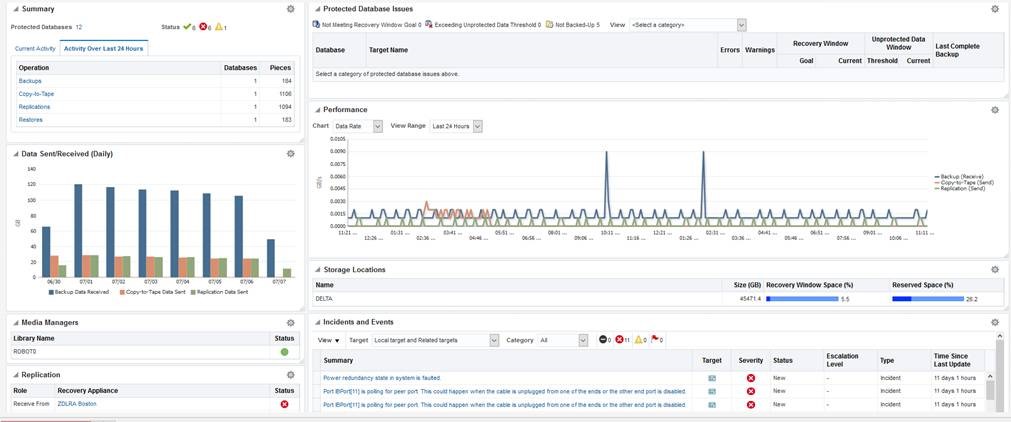
The primary interface for monitoring the Recovery Appliance is the Recovery Appliance Home page. The Home page lists any existing warnings and alerts, as shown in the following graphic:
The following sections of the Home page show monitoring information:
-
Summary
This section shows the number of databases with no issues, with alerts, and with warnings. In Cloud Control, an alert is an indicator that a particular metric condition has been encountered. For example, an alert might indicate that a metric threshold has been reached.
-
Media Managers and Replication
These sections show the status of copy-to-tape and Recovery Appliance replication services.
-
Protected Database Issues
This section summarizes the backup status for protected databases, and provides a category filter so you can view which databases are affected.
-
Incidents and Events
This section displays incidents and events reported for the Recovery Appliance and all associated targets. You can filter by target and category. You can click the Summary link to drill down to the Incident Manager to view detailed information about the incident.
Note:
Warnings automatically clear when the underlying issue is resolved.
See Also:
-
Cloud Control online help to learn more about the components of the Recovery Appliance Home page
Basic Tasks for Monitoring the Recovery Appliance
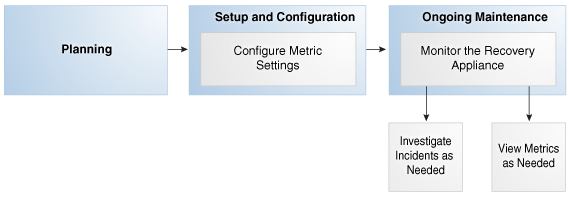
This section explains the basic tasks involved in monitoring the Recovery Appliance. The following diagram shows the overall workflow described in Recovery Appliance Workflow, with the monitoring tasks highlighted.
Figure 16-1 Monitoring Tasks in the Recovery Appliance Workflow

Description of "Figure 16-1 Monitoring Tasks in the Recovery Appliance Workflow"
Typically, you perform monitoring tasks in the following sequence:
-
During the configuration phase (see "Setup and Configuration for Recovery Appliance"), configure your metric settings. For example, you may want to configure the Recovery Appliance to issue a warning if a threshold is passed.
"Modifying the Metric and Collection Settings" describes this task.
-
During the ongoing maintenance phase (see "Maintenance Tasks for Recovery Appliance"), modify protection policies as needed. Typical modification tasks include:
-
Investigate incidents as needed.
"Viewing the Incident Manager Page" describes this task.
-
View metrics as needed.
"Modifying the Metric and Collection Settings" describes this task.
-
Modifying the Metric and Collection Settings
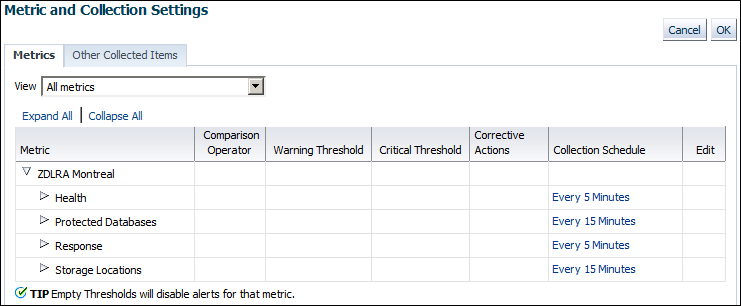
The Metric and Collection Settings page provides details about thresholds and schedules for target metric collection. Using this page, you can edit the warning threshold and critical threshold values of target metrics and other collected items, and the time intervals for collection. The page shows a pencil icon in the Edit column for modifiable settings.
Prerequisites
You must log in to the Recovery Appliance metadata database as RASYS.
Assumptions
You want to receive warnings when the space needed to meet the recovery window goal for a database is 80% percent of its reserved space setting. You want the critical threshold to be 95%.
To modify the metric and collection settings:
-
Access the Recovery Appliance Home page, as described in "Accessing the Recovery Appliance Home Page".
-
From the Recovery Appliance menu, click Monitoring, and then click Metric and Collection settings.
The Metric and Collection Settings page appears.
-
If All metrics is not selected in the View menu, then select it.
The page refreshes to show all the available metrics.
-
Expand Protected Databases.
-
Scroll down the page until you find the row that says
Recovery Window Space as a Percentage of Reserved Space. -
For this row, enter the following values, and then click OK:
-
In the Warning Threshold column, enter
80. -
In the Critical Threshold column, enter
95.
A confirmation message appears.
Note:
To change the default text of the alert message that is generated when these thresholds are passed, click the pencil icon.
-
-
Modify other metric settings as needed.
Viewing the Incident Manager Page
The Incidents and Events section shows all incidents, events, and warnings for a Recovery Appliance. Click any incident to open the Incident Manager page. Incident Manager provides, in one location, the ability to search, view, manage, and resolve incidents and problems impacting your environment.
Prerequisites
You must log in to the metadata database as RASYS.
Assumptions
This tutorial assumes that Incidents and Events section of the Recovery Appliance Home page for your Recovery Appliance shows a warning. You want to get more details about it.
To view the Incident Manager page:
-
Access the Recovery Appliance Home page, as described in "Accessing the Recovery Appliance Home Page".
-
Review the Incidents and Events section for possible problems.
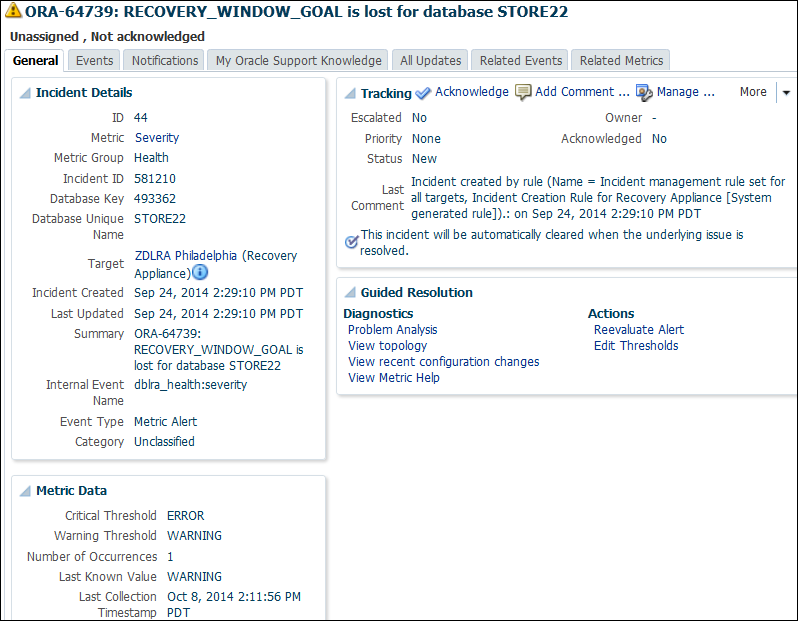
For example, the section shows the following warning:
ORA-64739: RECOVERY_WINDOW_GOAL is lost for database STORE22
-
Click the summary link of the incident that you are interested in.
The Incident Manager page for the selected warning appears, with the General subpage selected:
-
Click the subpages to get detailed information about the incident.
Monitoring Performance
Recovery Appliance ships with two utilities—rastat.pl and network_throughput_test.sh—that can assist you in evaluating the performance of your system.
Generating Performance Statistics by Using the rastat Utility
rastat.pl is a command line utility that runs tests against the Recovery Appliance to gather performance statistics which can help you identify system bottlenecks.
The tests can generate statistics on:
-
backup data sent to the Recovery Appliance over the network
-
restore data received from the Recovery Appliance over the network
-
Recovery Appliance ASM disk group read or write I/O
-
Recovery Appliance container file read or write I/O
-
Recovery Appliance container file allocation rate
The utility is a Perl script that can be run from any Linux or Unix-based client machine that is either a protected database or an upstream Recovery Appliance. The I/O tests however, can also be run directly from the Recovery Appliance server.
You can run multiple tests in parallel on one or more protected databases to simulate a real environment. Each test result represents the performance of an individual client. Note that ongoing activities between other protected databases and the Recovery Appliance being tested, such as backup and restore or other testing, can impact the resulting statistics.
Prerequisites for Running the rastat Utility
Before you run the rastat utility, ensure that the following requirements are met:
-
The platform on which you will be running rastat is either Linux or Unix.
-
If you will be running the utility from a protected database, copy the
rastat.plfile from the/opt/oracle.RecoveryAppliance/client/directory of a Recovery Appliance compute server to the protected database. -
Complete the steps to enroll the protected database with the Recovery Appliance as described in "Enrolling Protected Databases".
-
Ensure that the
$ORACLE_HOMEand$ORACLE_SIDenvironment variables are configured if you do not plan to set them by using the applicable options when you run the utility.
Running the rastat Utility
This section describes how to run rastat.pl and provides several examples of how to execute various performance tests, along with sample output.
Note:
If the NETBACKUP and NETRESTORE tests do not display the results to the standard output, you can view results by looking at the sbtio<pid>.log files.
To run the rastat utility:
-
Ensure that the system from which you are running the utility meets the requirements, as described in "Prerequisites for Running the rastat Utility".
-
Open a command prompt window.
-
Enter the applicable command syntax for the tests you want to run, and press Enter.
Refer to the "rastat Utility Reference" for information about the general syntax and the options for each test.
Example 1: Running rastat to Test Backup Performance
In the following example, the NETBACKUP test is specified, the backup file size is set to 2048 megabytes, the Recovery Appliance VPC user connection string is supplied, and the RMAN configuration is set by using the --parms option.
>$ORACLE_HOME/perl/bin/perl rastat.pl --test=NETBACKUP --filesize=2048M
--catalog=rman/rman@inst2 --parms='SBT_LIBRARY=/u01/oracle/lib/libra.so,
ENV=(RA_WALLET=location=file:/u01/oracle/dbs/ra_wallet
credential_alias=ra-scan:1521/zdlra5:dedicated)'

NETWORK TEST FROM PROTECTED DATABASE TO RECOVERY APPLIANCE

393 MB/s, 2048 MB sent
Example 2: Running rastat to Test I/O Reads from a Recovery Appliance ASM Disk Group
In the following example, the ASMREAD test is specified, the test file size is set to 2048 megabytes, the Recovery Appliance SYS user connection string is supplied, and +RCVAREA is specified as the disk group to read from.
>$ORACLE_HOME/perl/bin/perl rastat.pl --test=ASMREAD --filesize=2048M
--rasys=admin/admin@inst2 --diskgroup=+RCVAREA

RECOVERY APPLIANCE READ IO TEST FROM DISK

Disk Group: +RCVAREA

2048 MB, 6.06s read IO time, .65s CPU time, 337.99 MB/s, 10.79% CPU usage

PL/SQL procedure successfully completed.
Example 3: Running rastat to Test I/O Writes to a Recovery Appliance Container Group
In the following example, the CONTAINERWRITE test is specified, the test file size is set to 2048 megabytes, the Recovery Appliance SYS user connection string is supplied, and the BLOCK_POOL container group is specified as the disk group to write to.
>$ORACLE_HOME/perl/bin/perl rastat.pl --test=CONTAINERWRITE --filesize=2048M
--rasys=admin/admin@inst2 --diskgroup=/:BLOCK_POOL

RECOVERY APPLIANCE WRITE IO TEST TO CONTAINER FILES

Disk Group: /:BLOCK_POOL

2048 MB, 9.55s write IO time, 3.50s CPU time, 214.35 MB/s, 36.60% CPU usage

PL/SQL procedure successfully completed.
Example 4: Running rastat to Test File Allocation to a Recovery Appliance Container Group
In the following example, the CONTAINERALLOC test is specified, the test file size is set to 2048 megabytes, the Recovery Appliance SYS user connection string is supplied, and the BLOCK_POOL container group is specified as the disk group to write to.
>$ORACLE_HOME/perl/bin/perl rastat.pl --test=CONTAINERALLOC --filesize=2048M
--rasys=admin/admin@inst2 --diskgroup=/:BLOCK_POOL

RECOVERY APPLIANCE CONTAINER FILE ALLOCATION TEST

Disk Group: /:BLOCK_POOL

2048 MB, 6.24s allocation time, 3.69s CPU time, 328.34 MB allocated per second, 59.09% CPU usage

PL/SQL procedure successfully completed.
Testing Network Throughput
You can measure theoretical network throughput in a Recovery Appliance environment by using the network_throughput_test.sh script that ships with the appliance.
See My Oracle Support Note Doc ID 2022086.1 (http://support.oracle.com/epmos/faces/DocumentDisplay?id=2022086.1) for information and instructions on how to use the utility.


