28 Using the DBaaS Self Service Portal
About the Database Cloud Self Service Portal
The Database Self Service Portal allows self service users to view, monitor and deploy databases on selected zones, as well as create schemas on running databases. To view the Database Cloud Self Service Portal, log in to Enterprise Manager as a user with EM_SSA_USER role or an user with the EM_SSA_USER_BASE role. Users with these roles must be part of the DBAAS Cloud Service Family and must have privileges for the DB, Schema, or PDB service types. The Self Service Portal appears. Select Databases from the Manage drop down list.
Figure 28-1 Database Cloud Self Service Portal

The Database Self Service Portal allows SSA users to view, monitor, deploy databases on selected zones, and create schemas on running databases.
The following details are displayed:
-
Home: This is the Home page for the Database Self Service Portal. It contains the following sections:
-
Notifications: This section shows the number of databases that are expiring in the next 7 days.
-
Usage: This region displays the quota that you currently have and how much has been used for the following:
-
Databases: The number of databases requested so far and the maximum number of databases that can be requested.
-
Schema Services: The number of schemas requested so far and the maximum number of schemas that can be requested.
-
Pluggable Databases: The number of PDBs requested so far and the maximum number of PDBs that can be requested.
-
Memory: The total amount of memory allocated to the user and the memory used by all databases and schemas requested so far.
-
Storage: The total storage volumes allocated to the user and the storage used by all databases requested so far.
-
-
Services: This table lists the services that you currently own. You can request more databases, schemas, or PDBs by selecting the appropriate option from the Request New Service menu. You can also delete any databases you own to release it prior to expiration. Click on the service instance name to drill down to the database details page. This page provides basic monitoring capabilities and provides life cycle operations for the service.
From the Actions menu, you can do the following:
-
Start / Stop a Service Instance: You can start a service instance that has been stopped or stop a service instance that is running.
-
View History: Select a service instance and click View History to view the history of operations performed on the service instance.
-
Grant: You can grant view or full privileges over the service instance to other users or roles. See Granting, Revoking, and Reassigning Privileges to Service Instances.
-
Revoke: You can revoke privileges that you have granted to other users or roles. See Granting, Revoking, and Reassigning Privileges to Service Instances.
-
-
Requests: This table tracks the requests that you have created, deleted, or refreshed. For each request, the status, request type, service type, and submission date of the request is displayed.You can select a scheduled such as a Create or Delete request and click Reschedule to reschedule the request. To delete a scheduled request, select the request and click Cancel. If a request that is scheduled such as Create gets canceled, all other associated requests are also canceled.
-
-
Chargeback: This page displays all the chargeback break-up data for the databases and pricing for different zones. The charge incurred will be calculated from the database requested date to current date. This page contains the following sections:
-
Charge Trend: This graph show the usage and charge trends over time.
-
Aggregate By: You can aggregate the charge back data for the database by resources or metrics. You can export this data to an external application such as a spreadsheet.
-
Charge Plans: The charge plans that have been assigned to each are displayed. Select a zone to view the pricing. The rate for each metric in the database zone for a specific time period is displayed.
-
-
Preferences: Click this link to set up your preferences such as your default service portal, default PaaS Infrastructure Zone, default email address for notifications, and so on.
Provisioning of Database using Database Cloud Self Service Portal
To provision a database using Database Cloud Self Service Portal, follow these steps:
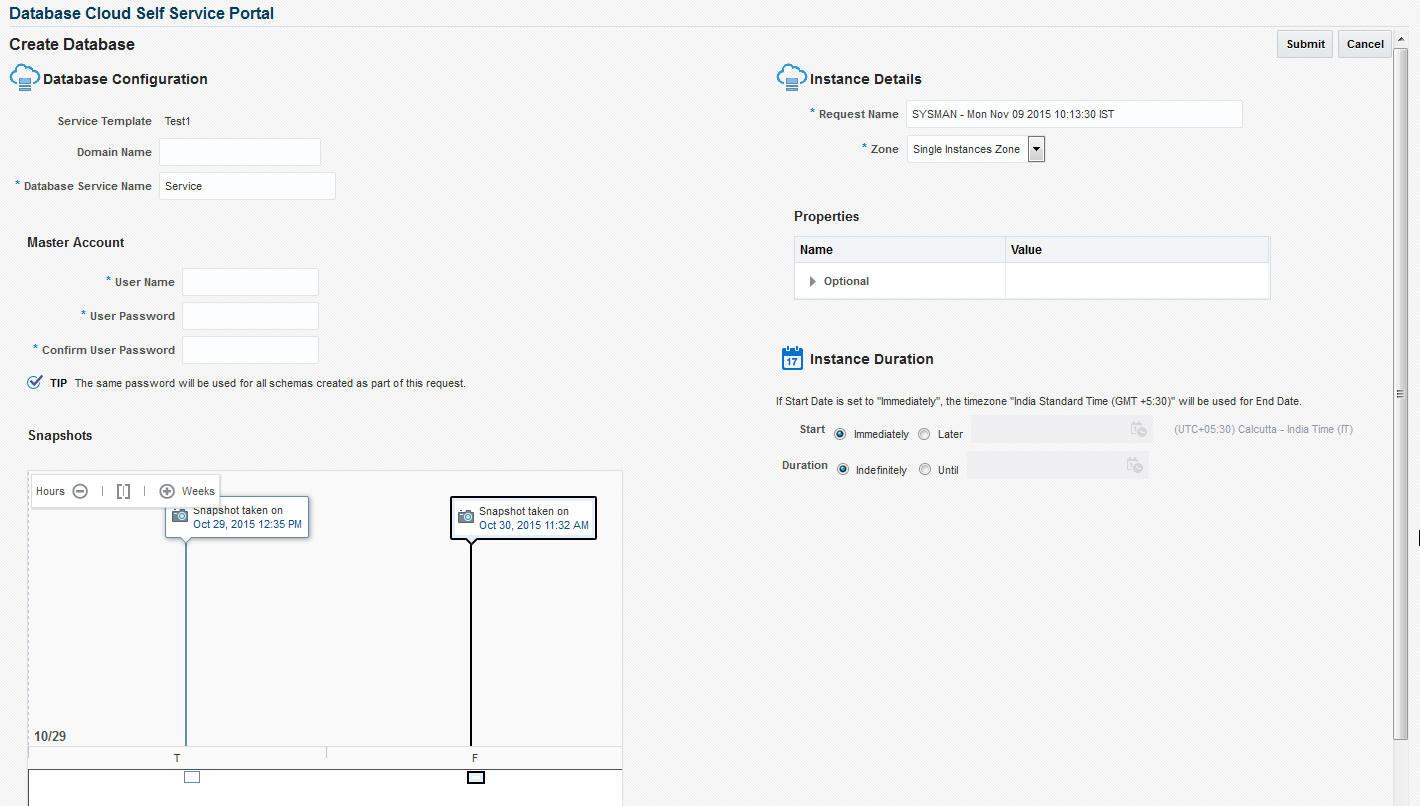
Requesting a Database
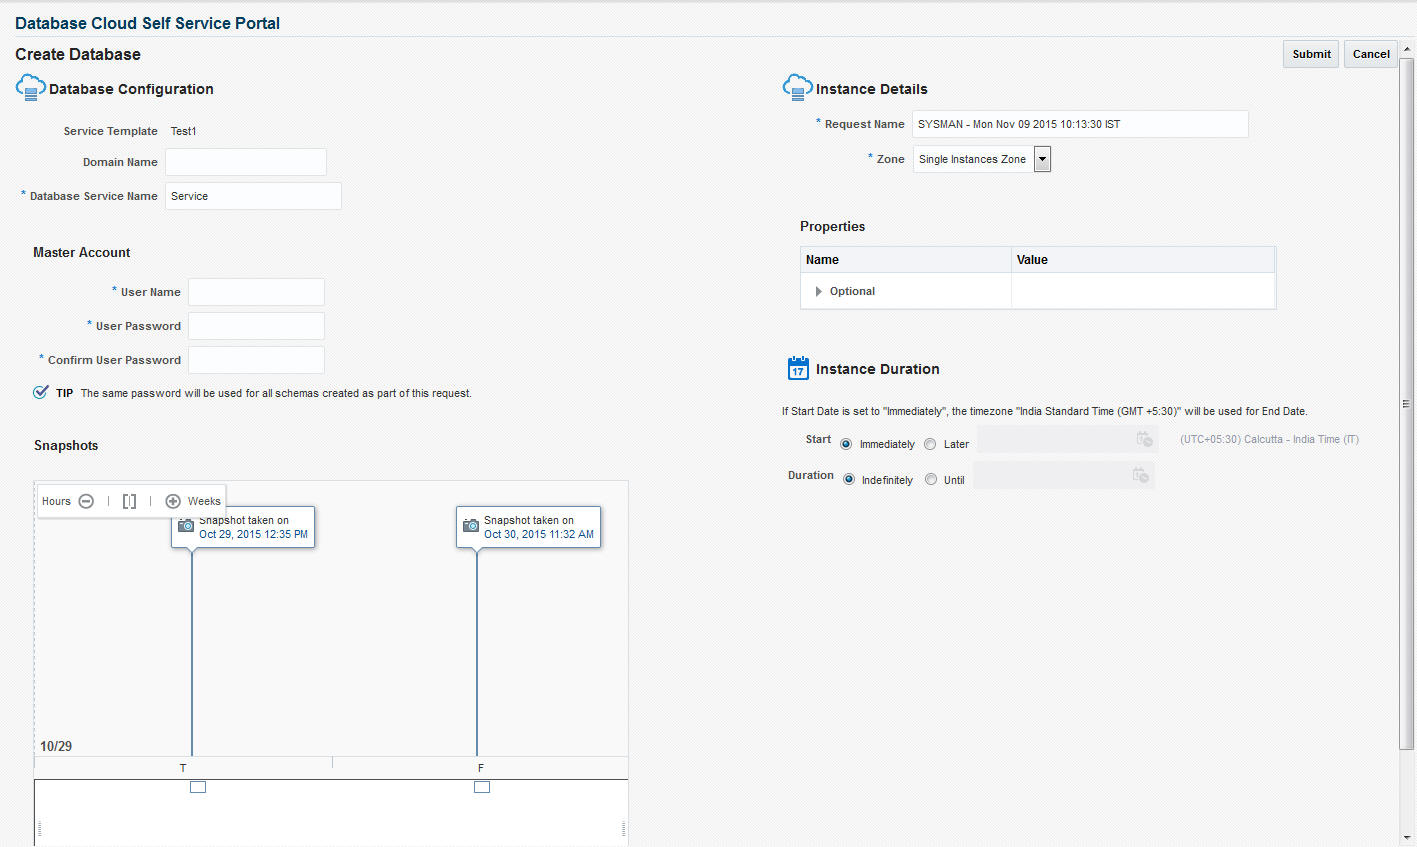
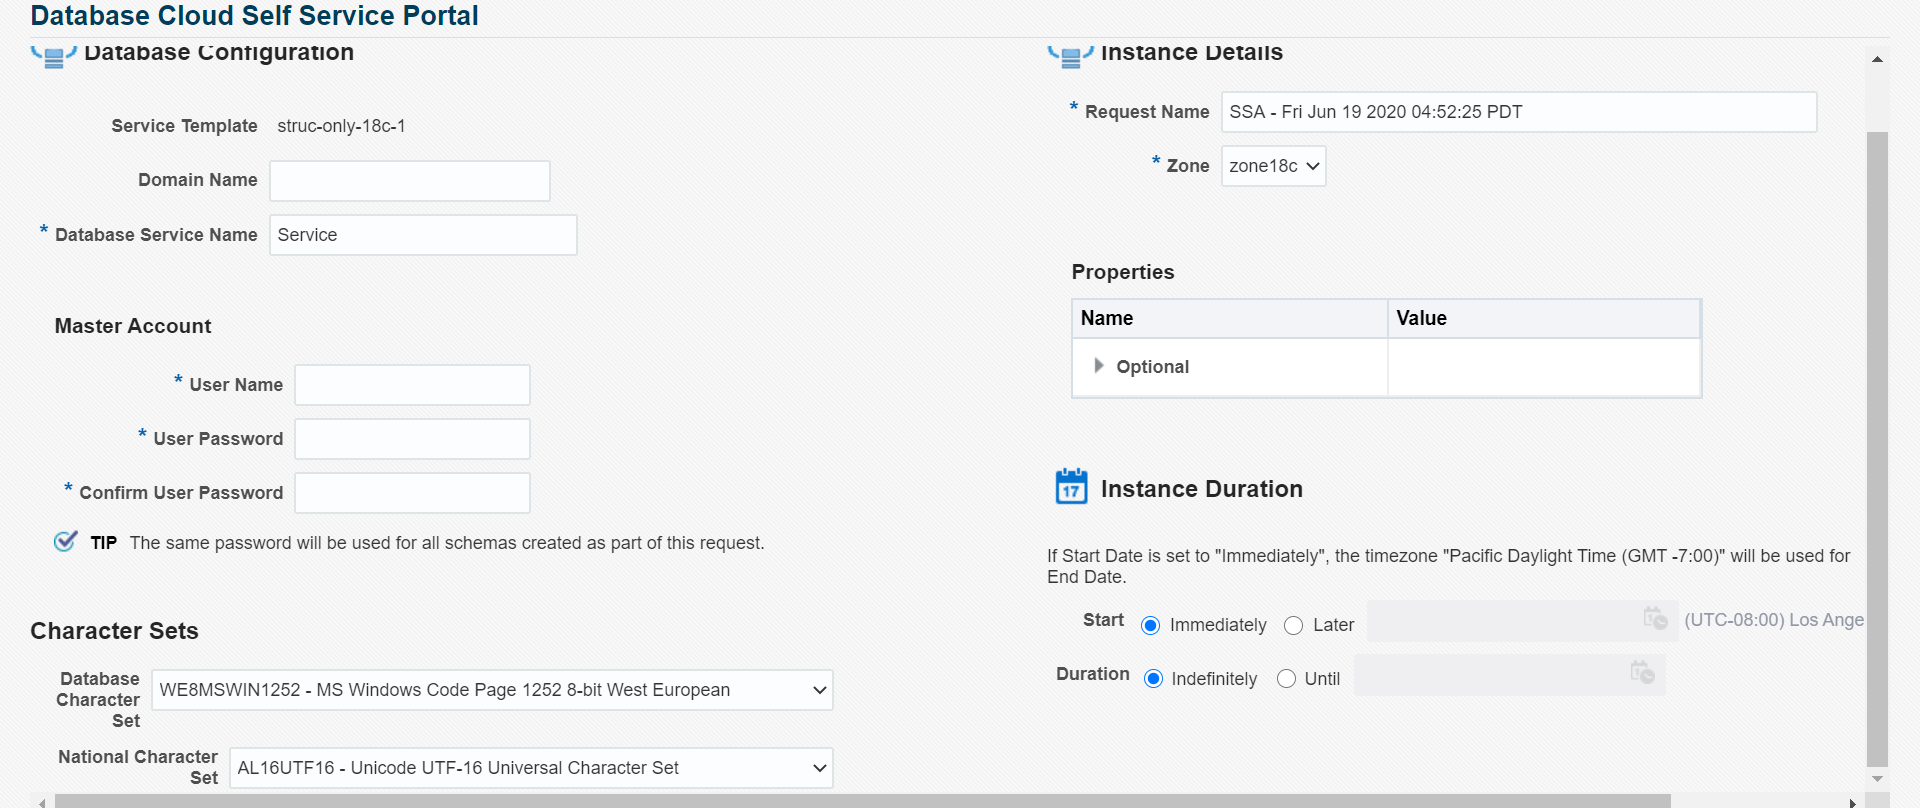
To request a new database, follow these steps:
Requesting a Schema
You can create a database service with one or more schemas and populate the schema with the required data.
Requesting an Export Profile Based Schema
You can create a schema based on a service template with a schema export profile or an empty service template. To create a schema based on a schema export profile, follow these steps:
-
Log in to Enterprise Manager as a user with
EM_SSA_USERrole or any role that includesEM_SSA_USERrole. -
The Database Cloud Self Service Portal page appears. Select Databases from the Manage drop down list to navigate to the Database Cloud Self Service Portal.
-
Click Request New Service in the Services region.
-
Choose a Schema Service Template with an schema export profile from the list and click Select. The Create Schema page appears. The name and description of the service template you have selected is displayed. Enter the following details:
-
Request Name: Enter a name for the schema service request.
-
Zone: Select the zone in which the schema is to be created.
-
Database Service Name: Enter a unique name for the database service.
-
Workload Size: Specify the workload size for the service request.
-
Schema Prefix: Enter a prefix for the schema. For clustered databases, the service is registered with Grid Infrastructure credentials.
-
-
Click Rename Schema to enter a new name for the schema. If you wish to retain the source schema name, ensure that the Schema Prefix field is blank.
-
Specify the password for the schema. Select the Same Password for all Schemas checkbox to use the same password for all the schemas.
-
The Master Account for the schema is displayed. The schema with Master Account privileges will have access to all other schemas created as part of the service request.
-
In the Tablespace Details region, the names of all the tablespaces in the schema are displayed. You can modify the tablespace name and specify a new name in the New Tablespace Name box.
-
Specify the schedule for the request and click Submit to create the schema.
Requesting an Empty Schema
To create a schema with an empty schema template, follow these steps:
- Follow steps 1 to 3 listed above and in the Select Service Template window, select an empty schema template from the list.
- Specify the details of the schema as listed in steps 4 to 7.
- In the Tablespace Details region, you can specify a separate tablespace for each schema or use the same tablepsace for all the schemas.
- Specify the schedule for the schema request and click Submit to create the schema.
Requesting a Pluggable Database
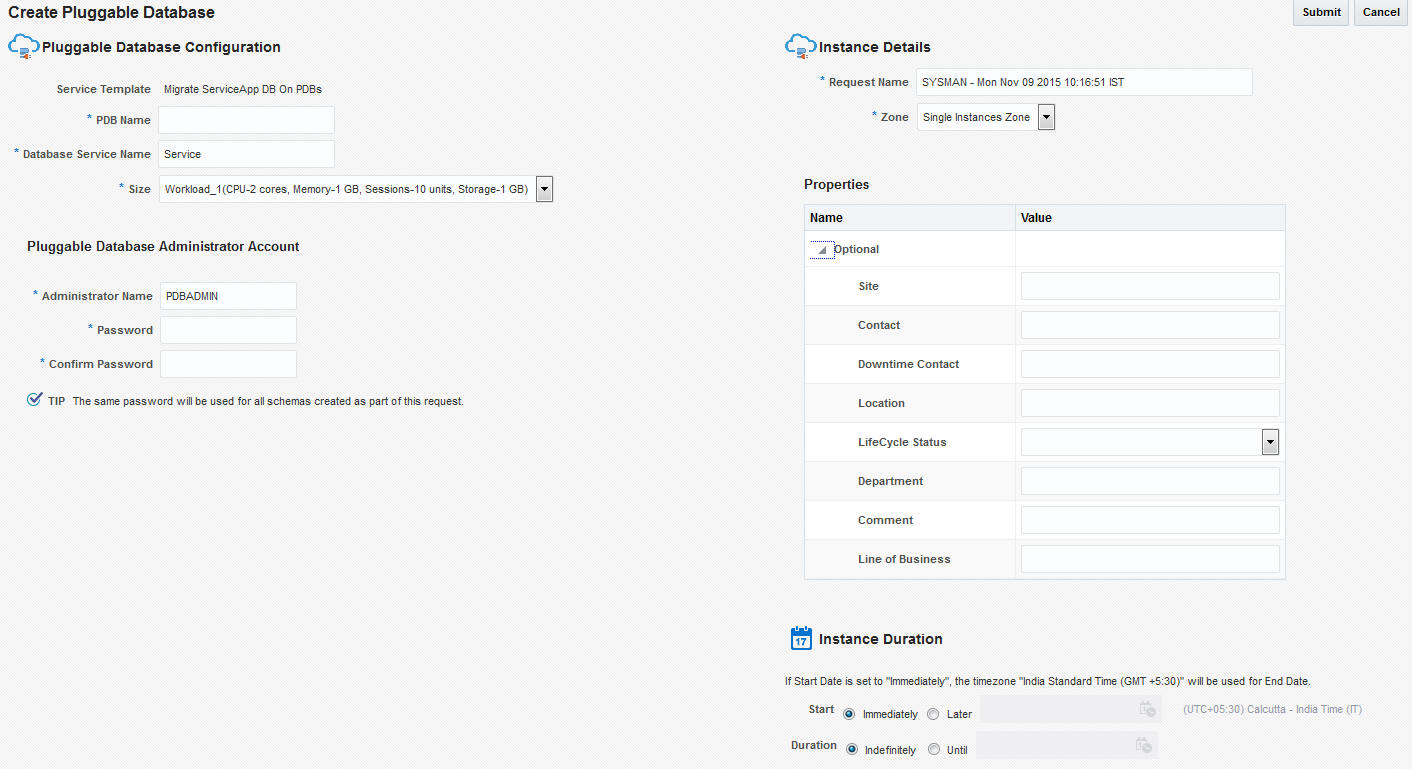
You can request a pluggable database based on a selected service template. To request a pluggable database, follow these steps:
Requesting a Hybrid Pluggable Database
When using the Oracle Cloud Infrastructure (OCI), you can now provision Pluggable Databases (PDBs) running on OCI VM Hosts and DB systems.
Before You Begin
Before provisioning a PDB to run in an OCI environment, you first need to ensure that an Enterprise Manager agent has been deployed to the OCI VM host. This is required to enable monitoring of the OCI environment. For more information, see Deploying Agents on OCI Resources
Request the PDB
- Login to Enterprise Manager as a user with
EM_SSA_USERrole or any role that includesEM_SSA_USERrole. - The Infrastructure Cloud Self Service Portal page appears. Select Databases from the Manage drop down list.
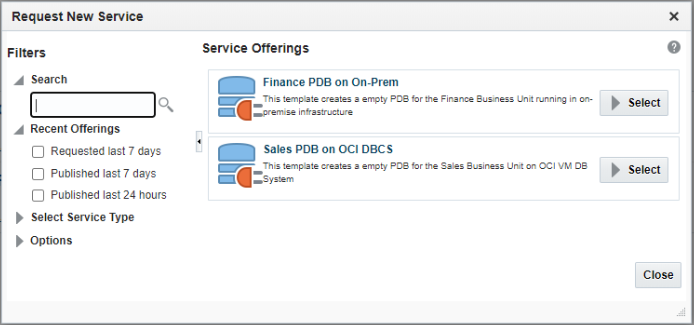
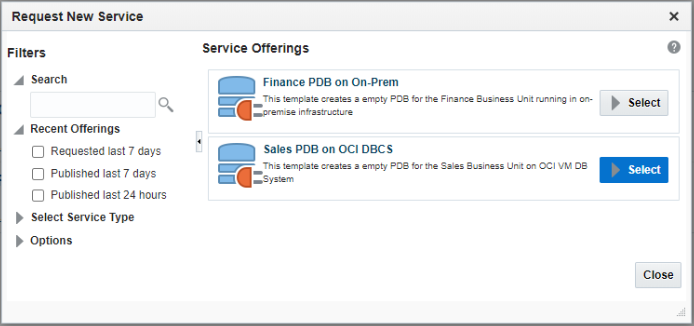
- Click Request New Service in the Services region. In the Request New Service window that appears, select Pluggable Database from the Service Type drop down.
- Choose the PDB on OCI DBCS service template from the list and click Select.
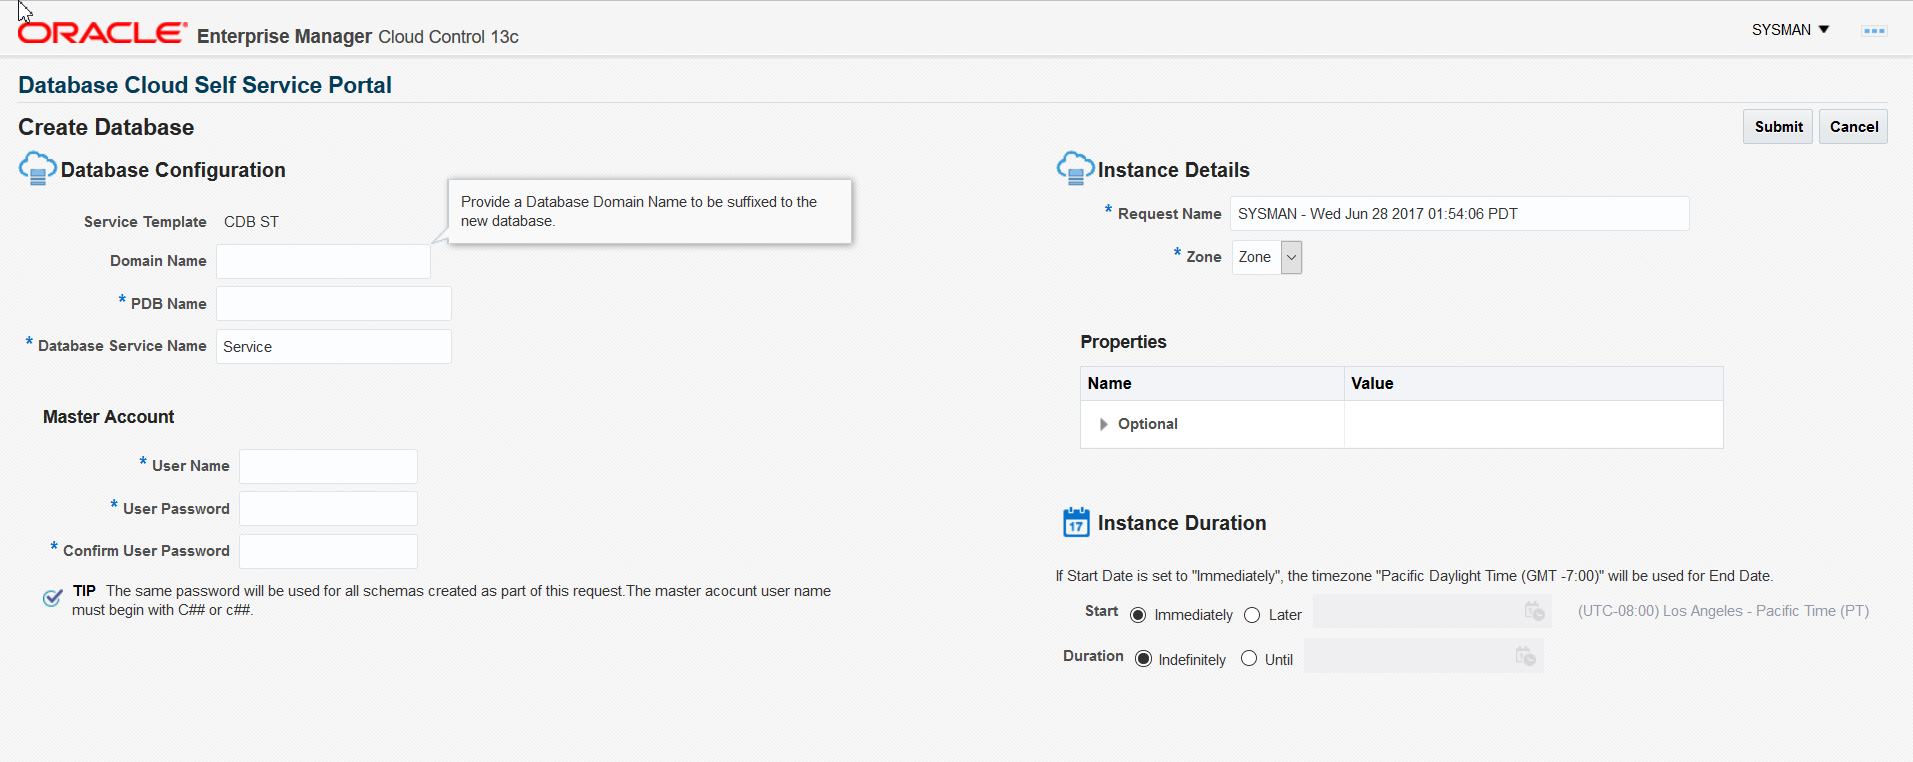
The Create Pluggable Database page appears.
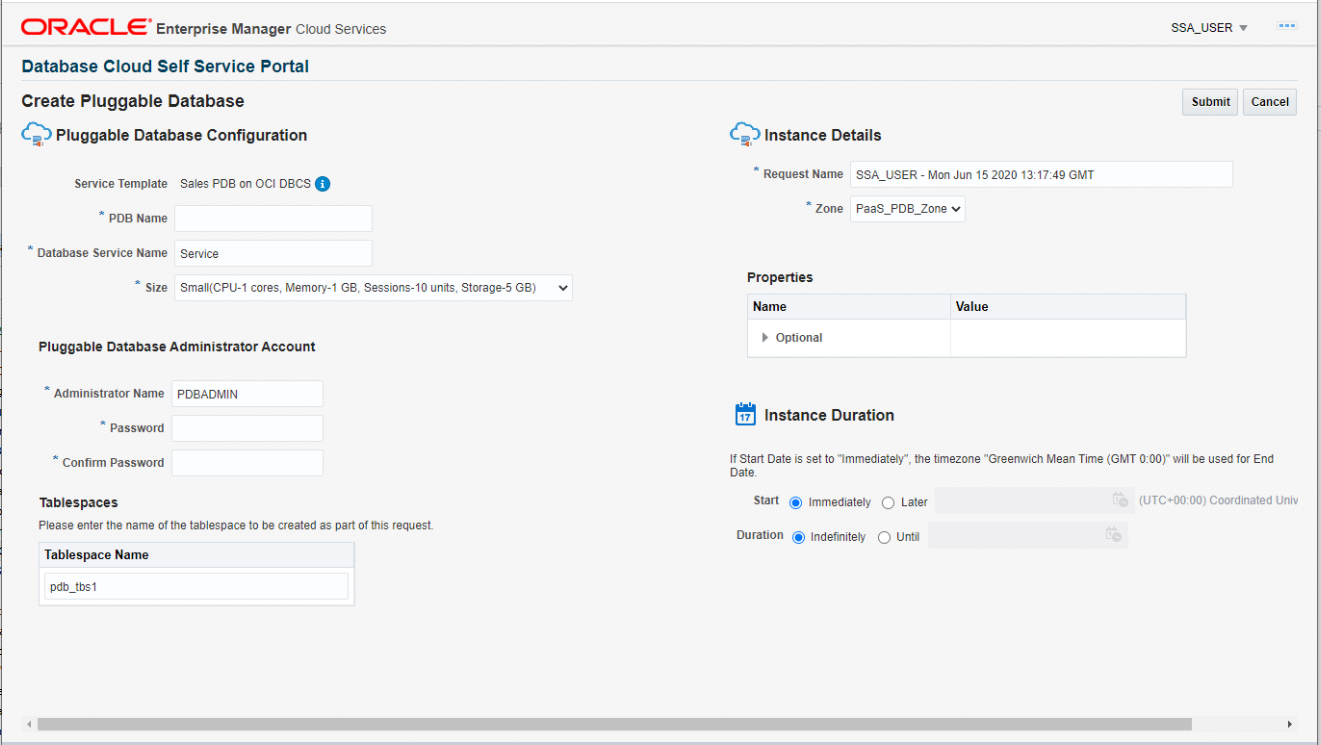
- Specify the following details:
- Request Name: Enter the name of the request.
- Zone: Select a PaaS Infrastructure Zone with the container databases into which the pluggable database is to be deployed.
- PDB Name: Enter a unique pluggable database name.
Note:
- The database service name you specify must be unique across all database, pluggable database, and schema service requests.
- You cannot use the same database service name that has been used for future scheduled request.
- If a Delete operation failed, you cannot use the name specified in the failed request.
- Database Service Name: Enter a unique database service name.
- Workload Size: Workload represents the total CPU, memory, and storage requirements for each service. Select the Workload Size from the drop down list.
- Deployment Input: Specify the pluggable database administrator user name and password.
- Schedule Request: Specify the schedule for the request.
- Service Instance Properties: Any mandatory and optional target properties are displayed here. If a property is marked mandatory, you must enter a value for that property.
- Click Submit to deploy the database to the selected zone.
Refreshing a Database
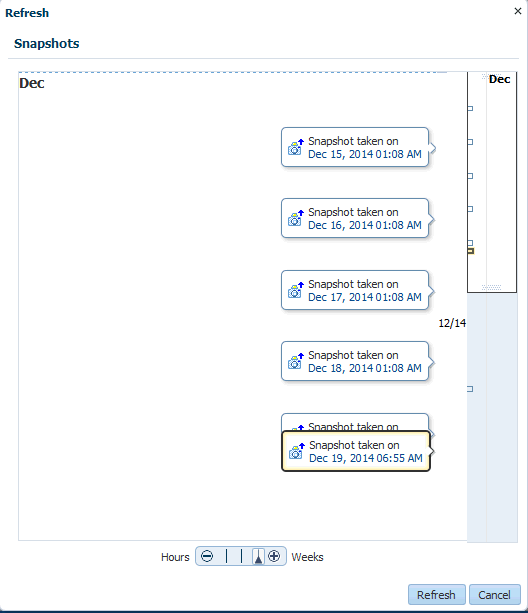
After you have created a database, you can keep the data current and consistent with the production database by refreshing it on a regular basis. To refresh a database, follow these steps:
Viewing the History of a Request
To view the history for a database instance, select the row in the Services column and select History from the Actions menu. All the requests that have been submitted for the database instance and the status of each request is displayed.
Database Service Home Page
Database services are logical abstractions for managing workloads in Oracle Database. Services divide workloads into mutually disjointed groupings. Each service represents a workload with common attributes, service-level thresholds, and priorities. The Database Service Home page provides a detailed view of the database service.
It contains the following regions:
-
Summary: Displays the status of the database service and the database version.
-
Connection Details: Shows the database connection details including the Connect String and the Master Account Name.
-
Export: You can do the following:
-
Export: Click Export to take export dumps of all the schemas that are part of the service. In the Export window, enter the name, description, and specify when the export dump should be scheduled and click Schedule.
-
Import: Click Restore to restore schemas from the selected export dump.
-
Remove: Select an export dump and click Remove to delete it.
-
-
Requests: This region shows the requests that you have created. For each request, the status, type, start date, and submission date of the request is displayed.You can select a scheduled request and click Reschedule to reschedule the request. To delete a scheduled request, select the request and click Cancel.
-
Schemas: Displays the name of the schema and tablespace associated with the database service.
-
Resource Usage: This region displays the workloads associated with the schema. This includes the CPU, Memory, and Storage allocated to the database service.
-
Performance: This region displays a graph showing the Average Number of Active Sessions over the last 5 minutes.
Database Instance Home Page
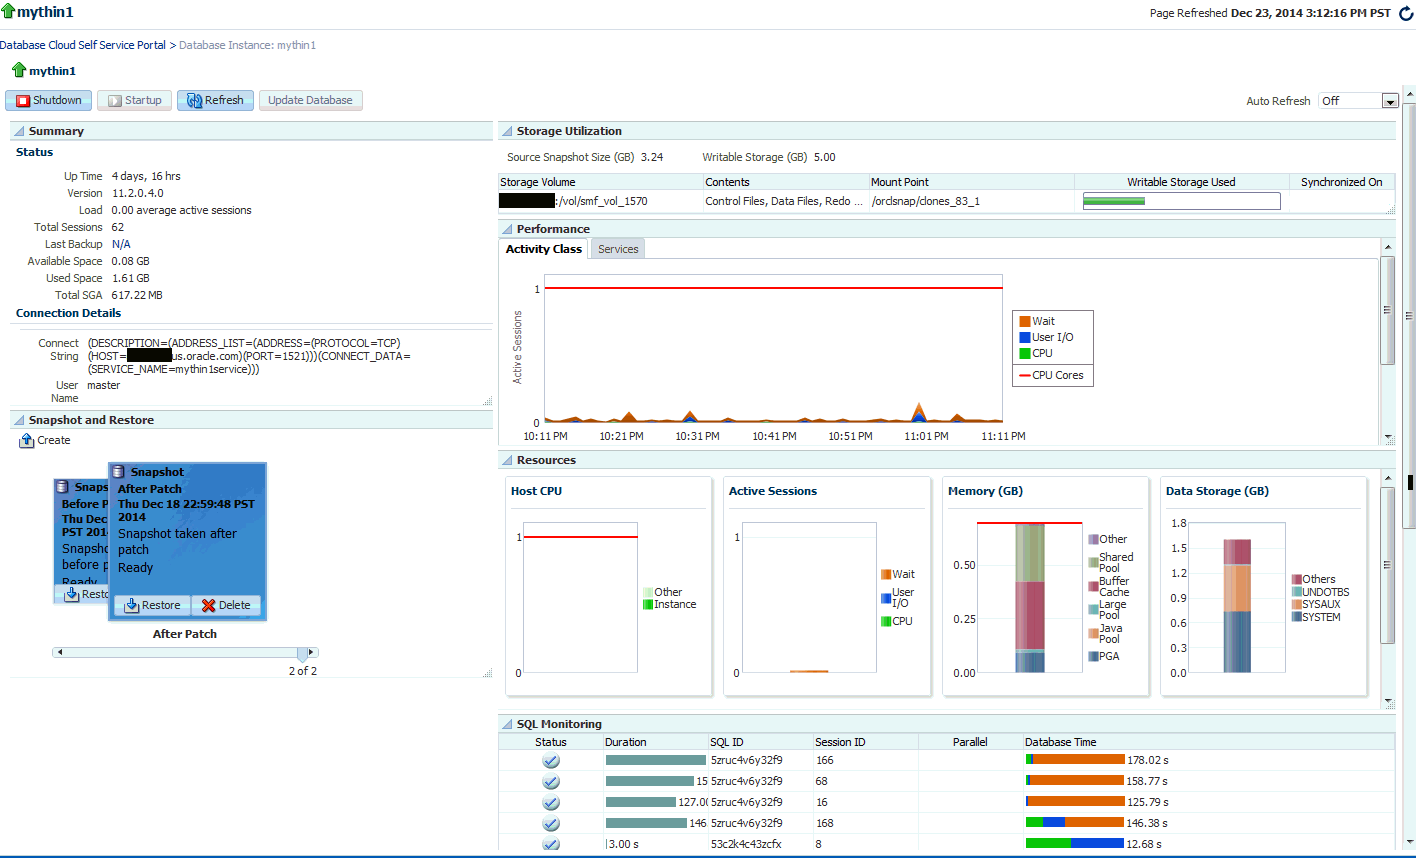
The Database Instance Home page provides a detailed view of the database instance.
This page contains the following regions:
-
Summary: The region of the Database Instance Home page provides a quick overview of the database status and provides basic information about the database. It shows the current status of the database and includes details such as the time stamp of instance start time, database version, date of the last backup, and so on.
-
Connection Details: Shows the database connection details including the Connect String and the name of the user accessing the database.
-
Backup and Restore: If the fast recovery area is configured for the database, you can schedule a daily backup for this database. Click Schedule Backup to perform this task. Once backups are available, you can click Restore to restore the database to a specific point in time. If the fast recovery area is not configured, your Database Administrator can configure the fast recovery area or publish a new service template that allows you to request databases with fast recovery area configured at the time of request fulfillment.
Note:
If the database instance has been created using a snap clone based profile, instead of the Backup and Restore region, you will see the Snapshot and Restore region with a list of snapshots. You can click Restore to restore data from a snapshot. See
-
Performance: Shows the performance monitoring information for the database. Click on the Active Class tab to view a bar chart showing the amount of time spent either waiting for a resource or consuming CPU.
-
Resources: Shows graphs indicating the resource consumption and include Host CPU, Active Sessions, Memory, and Data Storage.
-
SQL Monitoring: Shows the SQL Response Time chart that shows the current response of the tracked set of SQL versus the reference collection response.
-
Requests: This region shows the requests that you have created. For each request, the status, type, start date, and submission date of the request is displayed.You can select a scheduled request and click Reschedule to reschedule the request. To delete a scheduled request, select the request and click Cancel.
Starting and Stopping the Database
Depending on the state of the database, you can click Shutdown to shut down the database if the database is open, the Startup button if the database is shut down, or the Shutdown button if the state of the database is unknown or in a Status Pending state.
Standby Database Home Page
The Home page for a standby database instance contains the following regions:
-
Summary: The region provides a quick overview of the database status and provides basic information about the database. It shows the current status of the database and includes details such as the time stamp of instance start time, database version, date of the last backup, and so on.
-
Connection Details: Shows the database connection details for the primary database, and one or more standby databases. It includes the Connect String and the name of the user accessing the database.
-
Data Guard Summary: This region shows the Protection Mode for all the databases (primary and standby) and the details of each database such as the type of database, role, redo transport mode, and so on. For more details, see Creating a Service Template.
-
Performance: Shows the performance monitoring information for the database. Click on the Active Class tab to view a bar chart showing the amount of time spent either waiting for a resource or consuming CPU.
-
Resources: Shows graphs indicating the resource consumption and include Host CPU, Active Sessions, Memory, and Data Storage.
-
SQL Monitoring: Shows the SQL Response Time chart that shows the current response of the tracked set of SQL versus the reference collection response.
-
Requests: This region shows the requests that you have created. For each request, the status, type, start date, and submission date of the request is displayed.You can select a scheduled request and click Reschedule to reschedule the request. To delete a scheduled request, select the request and click Cancel.
Cluster Database Home Page
Use the Cluster Database Home Page to:
-
Determine the current status of the Oracle Real Application Clusters database by viewing a series of metrics.
-
Start or stop the cluster database.
-
Schedule daily backups and perform a point-in-time-restore of the database.
Note:
The Home Page presents a high level view of the cluster database. Click the arrow key on the left margin to expand the master panel and view the Target Navigation pane. You can select a Database Instance from the left panel to view details for that instance. You can then perform operations such as Startup and Shutdown for the Database Instance.
Home Page Sections
The Cluster Database Home page displays information for the following sections:
-
Summary
-
Performance
-
Configuration Changes
-
Resources
-
Jobs Running
-
SQL Monitor
-
Issues
Summary
The Summary section displays the status and diagnostics information about the cluster database.
Status
This section provides a quick view of the status of the cluster database and provides basic information about the cluster database. The status can be Up, Down, Under Blackout, Unmonitored, or Unknown, and the status is mirrored in the arrow icon that appears to the left.
The number of database instances in the cluster, the Up Time, Version, Load, Total Sessions, Available Space and other details are displayed. Following are the fields displayed in this section:
-
Instances: Displays the number of cluster database instances that are up.
-
Up Time: Displays the total elapsed time since the cluster database was started.
-
Availability: Displays the percentage of time that the cluster database was available.
-
Version: Displays this version of the Oracle Database.
-
Load: Displays the number of average active sessions since this cluster database was started.
-
Total Sessions: Displays the total cluster database sessions running.
-
Latest Backup: Displays when the last backup of the database was performed.
-
Available Space: Displays space available on the cluster database.
-
Total SGA: Displays total system global area.
-
Problem Services: Displays the services that have problems
Note: QoS Status on Cluster Database Home page shows if the database is enabled for QoS Management. The possible states are:
-
Enabled: Indicates that this database is enabled for QoS monitoring.
-
Disabled: Indicates that this database is disabled for QoS monitoring.
-
Active: Indicates that this database is enabled and monitored by QoS.
The QoS Status shown on the Cluster Database Home page is different from status shown on Quality of Service Dashboard. QoS Dashboard shows overall status of QoS itself in the Cluster.
Jobs Running
This table displays a report of the job executions that shows the scheduled, running, suspended, and problem (stopped/failed) executions for all Enterprise Manager jobs on the cluster database, ordered by submission of the job to the cluster database or to any member instance. If a value other than 0 appears in a field, you can click the number to go to the Job Activity page where you can view information about all scheduled, currently running, and past jobs.
Note: The four job status categories displayed group together job executions of similar status. For a complete list of job status values, refer to the Jobs tab to view all jobs or search for jobs of a certain status.
Performance
The Performance section shows active sessions during a one-hour window for activity classes and top services.
Activity Class
The Active Sessions chart shows potential problems inside the database. Categories, called wait classes, show how much of the database is waiting for a resource, such as CPU or disk I/O. The chart displays the load on the instance and identifies bottlenecks in performance.
To quickly identify problem areas, the chart displays a larger block of color to indicate more severe problems. Click the largest wait class on the highest peak, or alternatively click the corresponding wait class (indicated in yellow highlighting). Either action takes you to the Active Sessions Waiting page for the wait class selected, which shows top SQL, sessions, files, and objects for the wait class and also shows the associated wait events.
Services
The Active Sessions chart shows the top services waiting for the corresponding wait event during the time period shown. Only active services are shown. Click on one of the service legends to the right of the chart to go to the Service Activity page, where you can view real-time data showing the sessions load for all wait classes associated with the service.
Resources
The Resources section displays a bar chart showing relative CPU utilization of the Oracle host. This instantaneous value is refreshed every minute from the host by the Agent. The 100% represents the total CPU that the host system provides. The Instances tab is a break down of instance-wise measure of the resources, and the Database tab presents the overall measure.
Host CPU
This section displays a bar chart showing the relative CPU utilization across all hosts in the cluster. This instantaneous value is refreshed every minute by the Agent. The 100% represents the total CPU across all hosts in the cluster. Two values appear in the bar chart. The bottom, darker color corresponds to the Database legend and represents how much of the CPU is consumed by all the instances of this database. Click the Database link to go to the Top Activity page to display all wait classes and related statistics. The upper, lighter color corresponds to the Other legend and represents all other processes. Click the Other link to go to the Host Performance page for a quick glimpse of the utilization statistics (CPU, Memory, Disk I/O, and Program Resource Utilization) for this host.
The Load number is unrelated to the Host CPU chart. The Load number relates to the sum of the current CPU load for all cluster hosts. Click the Load link to go to the Host Performance page for a quick glimpse of the utilization statistics (CPU, Memory, Disk I/O, and Program Resource Utilization) for this host.
Note: The Host CPU section does not appear for pre-10g databases.
Active Sessions
The bar chart shows the amount of time all instances consumed using I/O and CPU, and the amount of time it consumed in bottlenecks. The number shown beside the bar chart is a literal number representing the number of active sessions, rather than the total number of sessions. The chart shows the latest value instead of a historical value. The three session categories are always CPU, User I/O, and Wait.
The Wait category represents the value for all wait classes combined, excluding User I/O. All of the links go to the Cluster Database Performance page.
User I/O displays the average active sessions spent on waiting for user I/O. User I/O means that the workload originating from the user causes the database to read data from the disk or write data to the disk. Click the User I/O link to go to the Performance page to view potential problems inside and outside of the current database.
CPU displays the average active sessions spent on using CPU. Click the CPU link to go to the Top Activity page to display all wait classes and related statistics.
The Maximum CPU number is the total CPU count across all the cluster database hosts.
Note: The Active Sessions section does not appear for pre-10g databases.
Memory
The chart shows the memory used by the database in GB.
Shared Pool displays various constructs that can be shared among users. For example:
-
SQL statements that users implement are cached so that they can be reused if the same statement is used again.
-
Information from the data dictionary is cached for quick access and reusability.
-
Stored procedures, which are executable code that is stored in the database, can be cached for faster access.
Buffer Cache caches blocks of data retrieved from the database. If a piece of data can be found in the buffer cache, then there is no need to read it from disk. There are subcaches for multiple block sizes, if used.
Large Pool displays optional area used for buffering large I/O requests for various server processes.
Java Pool used for all session-specific Java code and data within the Java Virtual Machine (JVM).
Other SGA displays shared memory area that contains data and control information for the instance. Multiple users can share data within this memory area (controlled by Oracle), and information stored in the SGA can avoid repeated access from physical disk, a time consuming operation.
Data Storage
The chart shows data storage details for tablespaces UNDOTBS, SYSAUX, and SYSTEM.
SQL Monitor - Last Hour
This section lists the SQL monitoring details for the last hour. The real-time SQL monitoring feature of Oracle Database enables you monitor the performance of SQL statements while they are executing. By default, SQL monitoring automatically starts when a SQL statement runs parallel, or when it has consumed at least 5 seconds of CPU or I/O time in a single execution. It lists the status, duration, SQL ID, Session ID, Parallel, and Database Time.
Instances
The Instances table lists the instances for the cluster database, their availability, incidents, compliance score, ASM instance information, and ADDM findings. Click an instance name on the left hand panel to go to the home page for that instance. Click the links in the table to get more information about that particular incident.
Pluggable Database Home Page
To view the Pluggable Database Home page, click on the PDB name link in the Databases region of the Database Cloud Self Service Portal.
This page contains the following regions:
-
Summary: The region of the Database Instance Home page provides a quick overview of the database status and provides basic information about the database. It shows the current status of the database and includes details such as the time stamp of instance start time, database version, date of the last backup, and so on.
-
Connection Details: Displays the connect string used to connect to the database.
-
Resource Usage: Shows the usage details such as Expected Workload and Actual Workload.
-
Backup and Restore: If the fast recovery area is configured for the database, you can schedule a daily backup for this database. Click Schedule Backup to perform this task. Once backups are available, you can click Restore to restore the database to a specific point in time. If the fast recovery area is not configured, your Database Administrator can configure the fast recovery area or publish a new service template that allows you to request databases with fast recovery area configured at the time of request fulfillment.
-
Performance: Shows the performance monitoring information for the database. Click on the Active Class tab to view a bar chart showing the amount of time spent either waiting for a resource or consuming CPU.
-
SQL Monitoring: Shows the SQL Response Time chart that shows the current response of the tracked set of SQL versus the reference collection response.
-
Requests: This table tracks the requests that you have created. For each request, the status, type, start date, and submission date of the request is displayed.You can select a scheduled request and click Reschedule to reschedule the request. To delete a scheduled request, select the request and click Cancel.
Starting and Stopping the Database
Depending on the state of the database, you can use the Shutdown button to shut down the database if the database is open, the Startup button if the database is shut down, or the Shutdown button if the state of the database is unknown or in a Status Pending state.
Data Guard Switchover
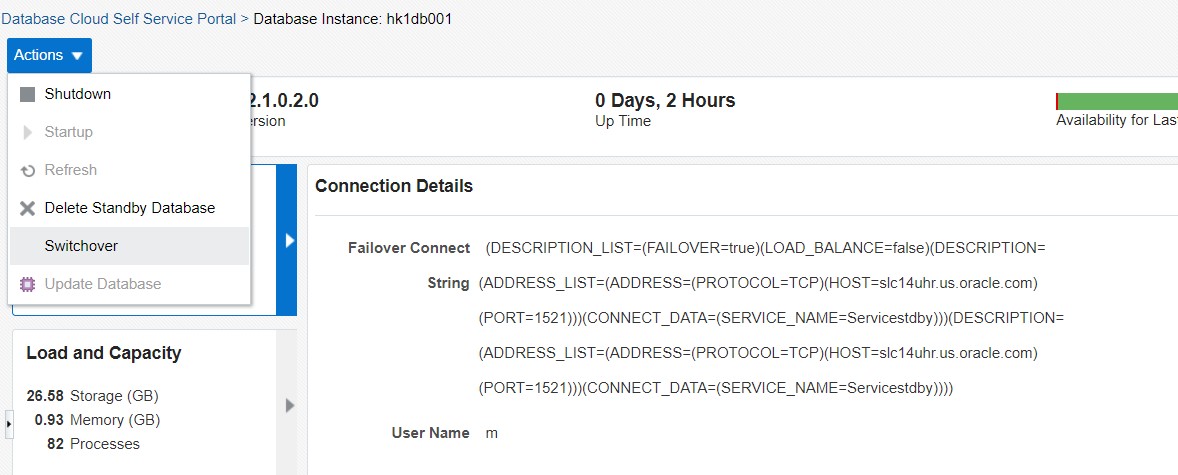
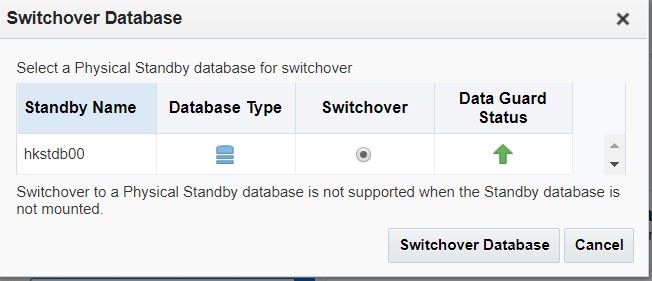
A switchover is a role reversal between the primary database and one of its standby databases. A switchover guarantees no data loss and is done for planned maintenance of the primary system. During a switchover, the primary database transitions to a standby role, and the standby database transitions to the primary role.
The switchover is supported for the DBaaS service type "Database".
To switchover a database, follow these steps:
