View Predefined Dashboards
The Oracle Enterprise Manager App for Grafana ships with predefined dashboards that let you visualize key operational data about an Enterprise Manager site.
Note:
For a demonstration of how to use out-of-box dashboards, you can view the video Oracle Enterprise Manager App for Grafana Out-of--the-box Dashboards.
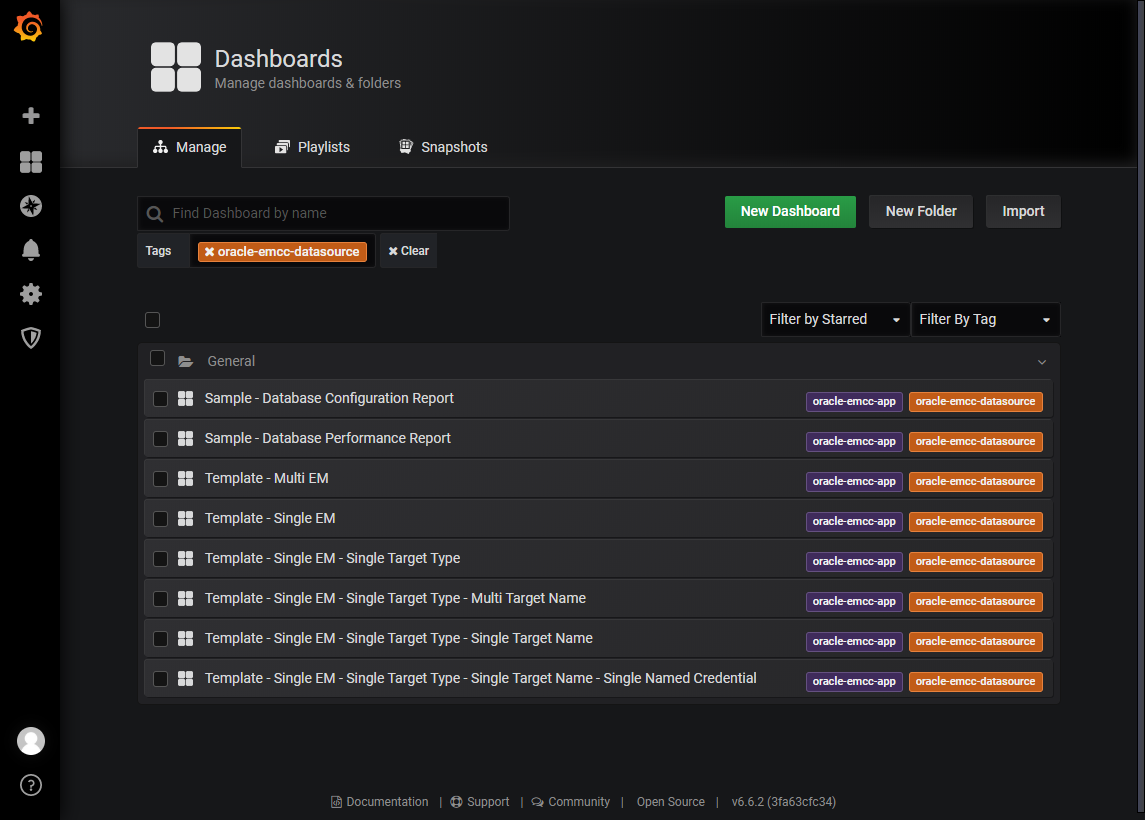
From the left tool bar, select Dashboards > Manage to view all dashboards installed with the App.

Click on one of the sample dashboards:
- Sample-Database Configuration Report (Non-Time Series)
- Sample-Database Performance Report (Time Series)
Note:
If you want to make changes to the two sample dashboards, you must first make a local copy of the dashboard using the Save As option. Click the (Settings) gear icon in the top toolbar to display dashboard settings and then click Save As....