5 Working With Dashboards
Introduction to Dashboards
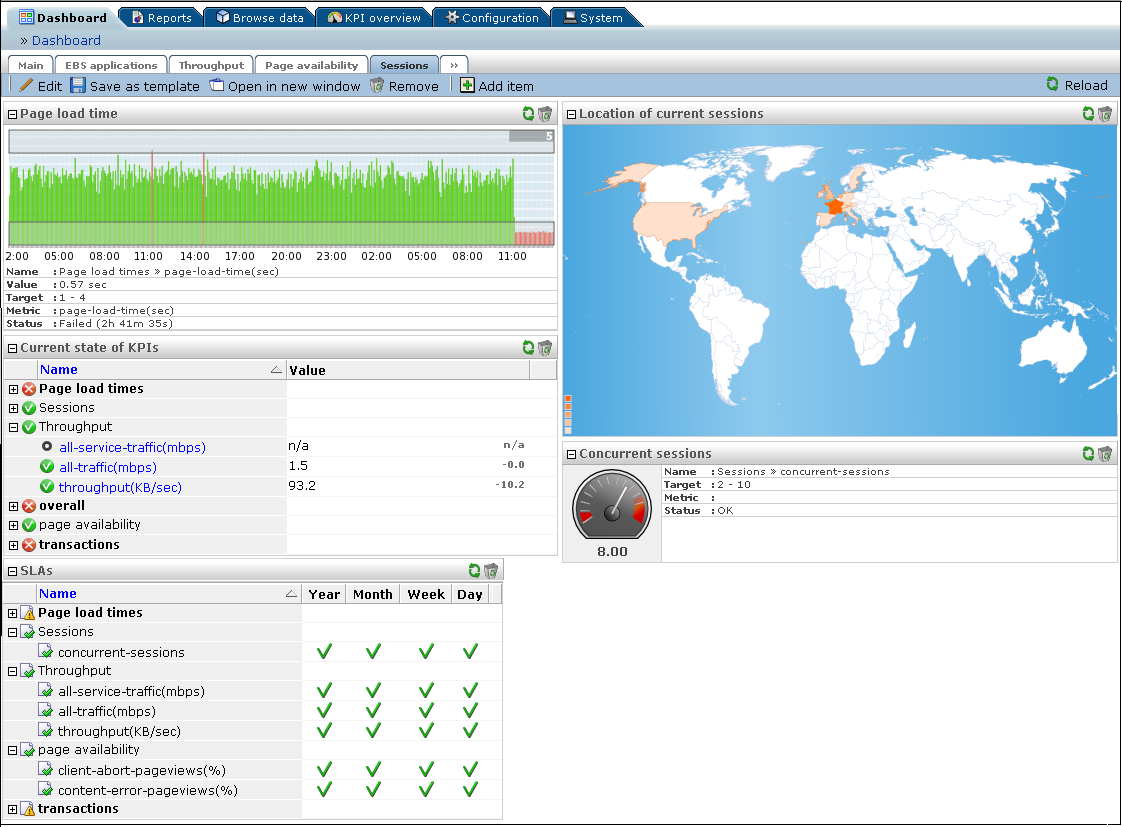
RUEI allows you to create a set of your own customized dashboards. A dashboard is a visual display of the most important information required to achieve an objective, consolidated and arranged on a single screen so that the information can be monitored at a glance. An example is shown in Figure 5-1.
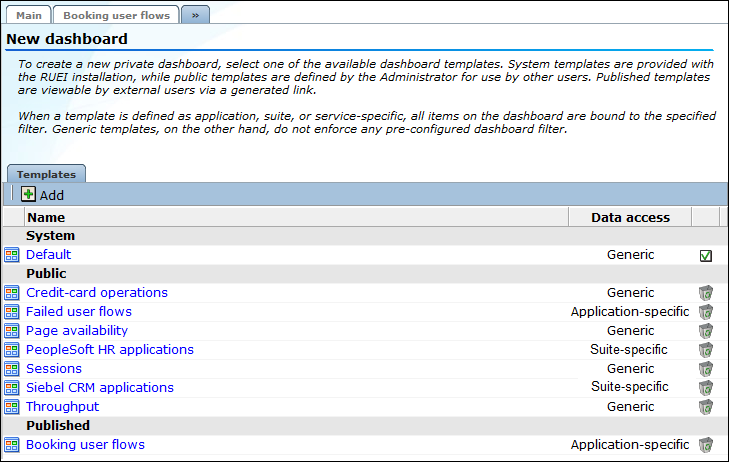
Each of your currently defined dashboards is available via tabs at the top of the screen. The last tab (») provides an overview of the templates available to you to use as the basis for creating new dashboards.
Designing Effective Dashboards
When designing your dashboards, it is recommended you carefully consider the dashboard's appropriate content in terms of which data to report, and what visualizations to use. In particular, it is recommended you carefully consider the following points:
-
Is the dashboard's information content overloaded? Ideally, it should help you visually identify trends, patterns, and anomalies.
-
Which visualizations provide the clearest, most meaningful presentation of the data in the least amount of space?
-
Does the displayed information need to be refreshed in real-time and, if so, how often? Do the objectives it serves require real-time information?
-
Does the dashboard quickly point out something that deserves your attention, and might require action?
Dashboards and Templates
Dashboards are created based on templates. There are four types of templates: system, private, public, and published.
-
System templates are provided with the product installation, and cannot be modified. After installation, these templates can be disabled, if required.
-
Private templates are created by non-admin users. Only the user who created the private template can view or edit it.
-
Public templates are dashboard templates created and maintained by Administrators. They cannot be modified by any other user.
-
Published templates are used to create dashboards that are viewable by external users via a generated link.
Creating New Dashboards
To create a new dashboard, do the following:
Example 5-1 Viewing Dashboards
Each of your currently defined dashboards is available by clicking its associated tab within the Dashboard tab. You can also click the Open in a new window icon on the taskbar. This is useful for viewing dashboards in a full-screen display, or for viewing several dashboards at the same time through resized and aligned windows.
Example 5-2 Modifying Dashboards
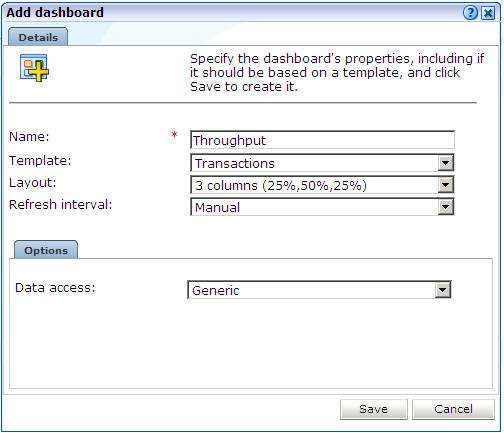
You can modify a dashboard's properties by clicking the Edit icon within the dashboard taskbar. A dialog similar to the one shown in Figure 5-3 appears. Use this dialog to modify the dashboard's underlying template, name, layout, and refresh interval. The dashboard's layout and filter (described in Using Data Access Filters) are also reported.
You can also add or remove items to and from a dashboard, as well as modify existing items. This is described in the following section.
Modifying a Dashboard's Contents
To add an item to a dashboard, do the following:
Note:
You can define a maximum of 35 items for a dashboard.
Example 5-3 Drilling-Down Into The Data Browser
In the case of Data Browser dashboard items, you can click the Browse icon located in the top right-hand corner of the item to obtain a complete view of the data from which the item is derived. The use of the Data Browser is described in Working With the Data Browser. Note this icon is only available if you have either Business/IT Analytical or Full access level permissions (see Table 14-2).
Example 5-4 Modifying Dashboard Items
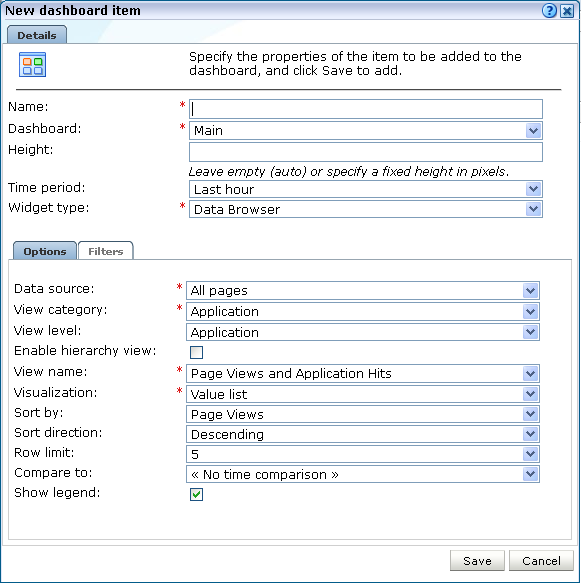
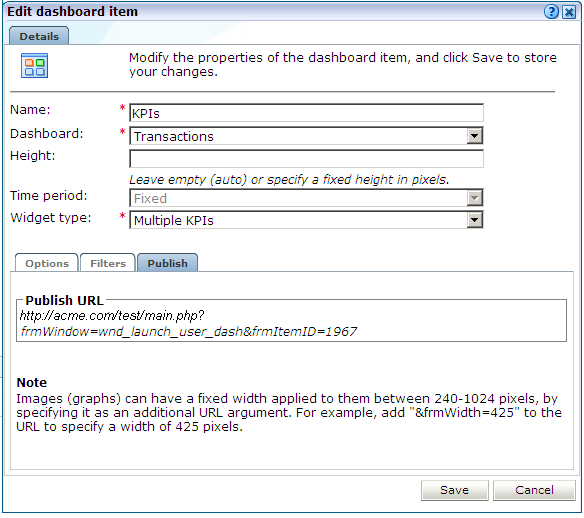
You can click a dashboard item's title to edit it. A dialog similar to the shown in Figure 5-4 allows you to modify its properties. Depending on whether an item is derived from an application, service, or suite-specific template, and your access level permissions, some of the fields within the dialog may be disabled. Note an item can be deleted by clicking the Remove icon within its title area.
Using Data Access Filters
Templates can either be defined as generic, or as application, service, or suite-specific or as application dimension values. In the case of the later, all items on the dashboard are bound to a specified source. Generic dashboards do not have this restriction.
If a source-specific template is defined, each item on the dashboard is filtered on the specified source. If this filter cannot be applied for some reason (for example, because a specified application has since been deleted, or the user is not authorized to view information about the specific application), the item is replaced with a warning that the requested data could not be displayed.
The use of template filters has a number of advantages:
-
It minimizes template maintenance. For example, imagine that a dashboard template contains 20 items, all of which refer to the same application. Instead of having to modify all 20 items when you want to create the same template for another application, you only have to modify the template filter.
-
System users can be authorized to view data within a dashboard that they would not normally be able to view. For example, imagine that a user has only Overview access level permissions. In this case, they do not have access to the Data Browser. However, through their user account definitions (described in Managing Users and Permissions), they can be authorized to view selected data items for a specific application, service, or suite. However, they would be prevented from being able to view information derived other data sources.
Detection of Template Filters
After an application, service, or suite has been configured, it must still be identified at least once in the monitored traffic before it can be used as a template filter.
Adding a Data Browser or KPI View to a Dashboard
You can add the current view within the Data Browser or the currently viewed KPI within the KPI overview facility to a dashboard by clicking the Add to dashboard icon. A dialog similar to the one shown in Figure 5-4 appears. You can use this dialog to finalize how the data source should be reported within the dashboard.
Creating Templates
Public templates are created by Administrators, which are used by other users as the basis for their dashboards. Private templates are created by non-admin users.
Note:
The non-admin user must have the permission under user rights to create private templates. For more information, see Understanding User Account Roles and Permissions.
To create a public or private template, do the following:
-
Click the Dashboard tab, then click an existing dashboard tab, and then click the Save as template icon on the taskbar. The dialog shown in Figure 5-5 appears.
Figure 5-5 Create Dashboard Template Dialog
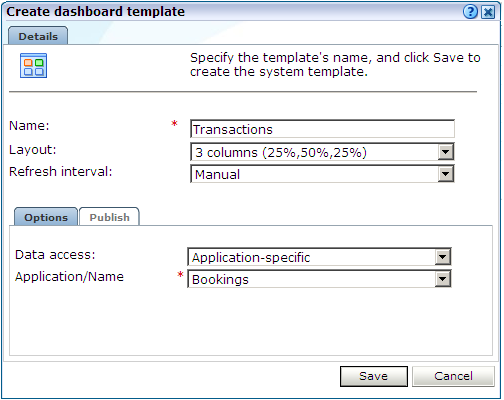
Description of "Figure 5-5 Create Dashboard Template Dialog" -
Specify a name for the new template. This must be unique across system templates.
-
Select the required template layout and refresh interval.
-
In the Options tab, select the required Data access option. You can select whether the template should be bound to a specific application, service, or suite. For more information about filters, see Using Data Access Filters.
In the case of an application or service-specific template, specify the application or service to which it should be bound. In the case of a suite-specific template, specify the suite type (for example, PeopleSoft), and the configured suite. The options available within the Suite type menu depends on the suite instances configured on your system.
-
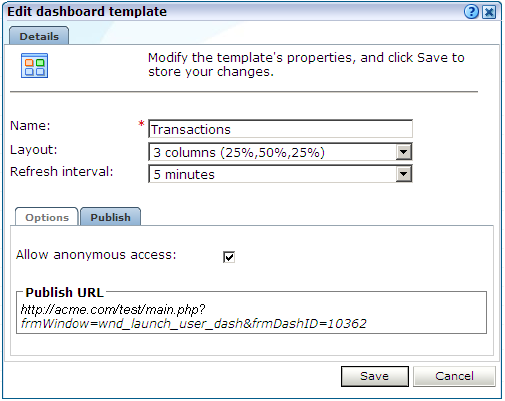
In the Publish tab, select the Allow anonymous access checkbox to specify whether external users can view the selected dashboard. If checked, copy and send the displayed link to the required users. For more information, see Publishing Templates.
-
Click Save.
The created template appears in the list of public or private templates. Access to the items on the template depends on the user's individual access permissions.
Modifying System Templates
System templates cannot be edited directly. If you need to modify a system template, it is recommended that you select the Disable option from the system template's context menu to make it unavailable to other users. You should then modify an existing dashboard (or create a new one) with your required modifications, save this as a public template, and then advice users to use the public template as an alternative to the system template.
Modifying a Template's Properties and Contents
After creating public templates for use by other system users, you can edit their properties by doing the following:
-
Click the Dashboard tab, and then click the last (
») tab. The currently available public templates are listed. Select the Edit option from the required template's context menu. A dialog similar to the one shown in Figure 5-5 appears. -
Use the fields available within the dialog to modify the templates name, layout, refresh interval, and data source as described Creating Templates. When ready, click Save.
To edit the template's contents, do the following:
- Select the Edit content option from the required template's context menu. The template appears in a new window in edit mode.
- Use the procedure described in Modifying a Dashboard's Contents to edit template's content. When ready, close the window.
As explained earlier, there is no direct link between a template and the dashboards created based upon it. Hence, any changes you make to a template are not reflected in existing dashboards created from it.
Creating Templates Based on User Dashboards
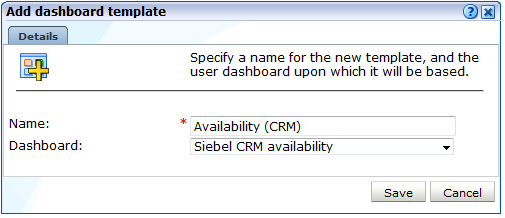
A private dashboard is visible to the owner of the dashboard alone. An admin and non-admin user can create templates based on their own dashboard only. To create a template based on your dashboard, do the following:
Publishing Templates
In addition to defining dashboards, and the templates used as the basis for their creation, RUEI also enables templates to be made available to external users. For example, via a portal page. As explained in Creating Templates, a dashboard can be made externally available. Do the following:
- Select the Edit option from the required template's context menu. A dialog similar to the one shown in Figure 5-5 appears.
- Click the Publish tab, and check the Allow anonymous access check box.
- When ready, click Save.
- Once again, select the Edit option from the required template's context menu. Click the Publish tab. Copy and send the displayed link to the required users. An example is shown in Figure 5-7.
