CPU
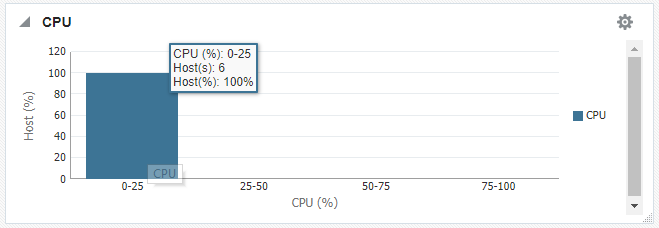
This region displays the range of CPU utilization by the Linux host machines.

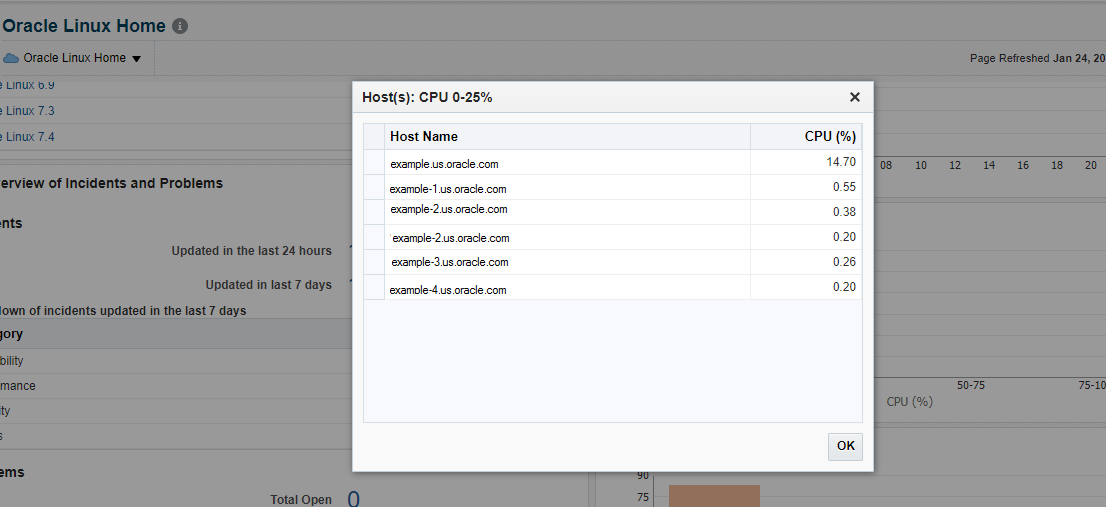
For example, in Figure 4-6 six hosts have a CPU utilization of 0-25%. To view the list of hosts along with the percentage utilization of CPU by each of them, click the bar graph. The CPU Utilization Table displays the details. See Figure 4-7.

Figure 4-6 CPU Graph

Figure 4-7 CPU Utilization Table
