Discover Private Cloud Appliance X3-2
Follow the below steps if you are discovering the Oracle Private Cloud Appliance X3-2:
-
From the Setup menu, select Add Targets, and then select Add Targets Manually.
-
On the Add Targets Manually page, click Add Targets Using Guided Process.
-
On the Add Using Guided Process window, select Private Cloud Appliance. Click Add to begin the discovery wizard.
-
On the Discovery Inputs page, you will need to enter the Monitoring Agent host location.
Click Search. The Select Discovery Agent dialog box opens.
Select the URL from the available list. Once you select the URL, the Management Agent field on the Discovery Input page should auto-populate with the required information.
Click Next.
-
On the Discovery Prerequisites page, a series of checks are conducted automatically. Any errors returned must be resolved before continuing.
Note:
If you get error severity messages, you must resolve the errors then click Reload to run the prerequisites check again.
Click Next.
A confirmation pop-up window will appear to show how many targets must be discovered.
Click Close to continue.
-
On the Discovered Targets page, select the targets you want included in the discovered Oracle Private Cloud Appliance rack. By default, all available targets are preselected.
Click Next.
-
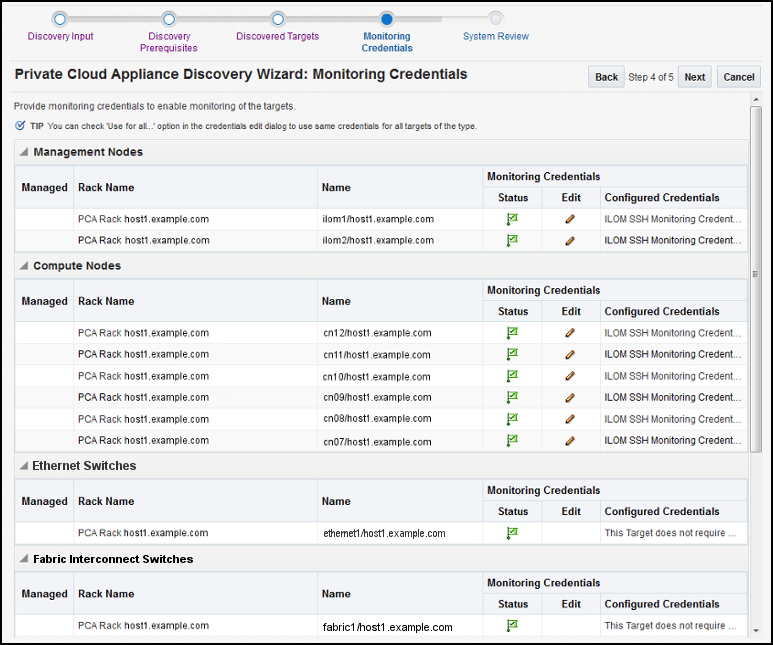
On the Monitoring Credentials page, the credentials must be set for each component in the Oracle Private Cloud Appliance rack. A red status flag is shown for all components where the credentials are not set.
For each component type, click the Edit icon. In the Monitoring Credentials pop-up, enter the user name and password for each component in the Oracle Private Cloud Appliance rack:
Note:
In a default case, for the InfiniBand Switch, enter public in the Community String mandatory field input.
You can select Use same credentials for all in the credential's edit dialog to use the same credentials for all targets of the type. The image below shows an example of the Monitoring Credentials page with all credentials set:
Figure 4-3 Private Cloud Appliance Discovery Wizard: Monitoring Credentials

Click Next.
-
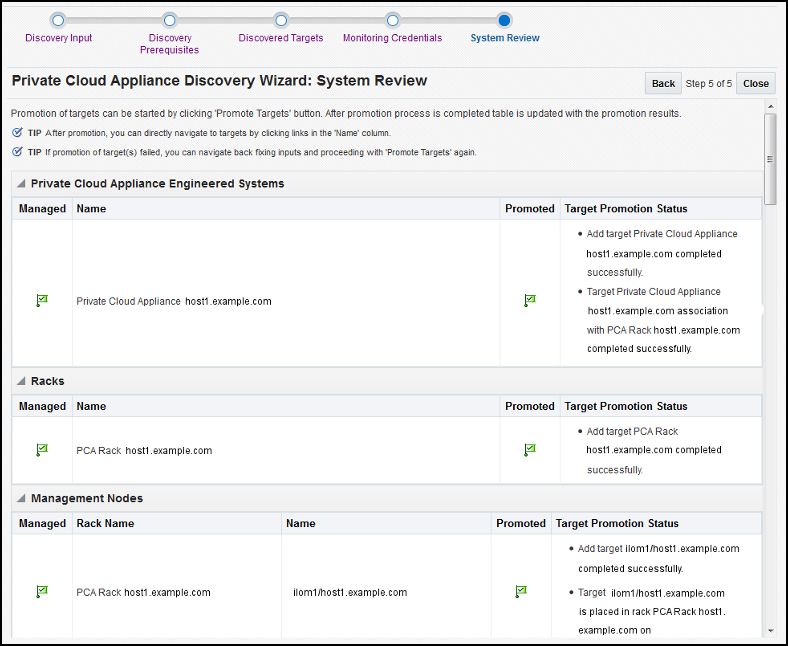
On the System Review page, click Promote Targets to promote all components of the Oracle Private Cloud Appliance rack. If any component fails the promotion process, click Back to update the inputs for that component. A pop-up window will appear to show the progress. Once complete, click Close.
The image below shows an example of completed promotion of all components:
Figure 4-4 Private Cloud Appliance Discovery Wizard: System Review

Click Close.
New Features in Oracle Fabric Interconnect Target
This section provides information about new features in Oracle Fabric Interconnect Target.
Enterprise Manager 13.3 introduces new features to the Oracle Fabric Interconnect Target. The following information can now be monitored:
-
Cumulative performance
-
The managed devices and their serial numbers
-
The discovered servers
-
The configured I/O templates
-
Network and storage clouds
-
The Alarms tracked by the Oracle Fabric Manager
To view this information, select the Fabric Interconnect Target from All Targets menu or click the Fabric Interconnects on the Private Cloud Appliance's Target Navigation Tree.
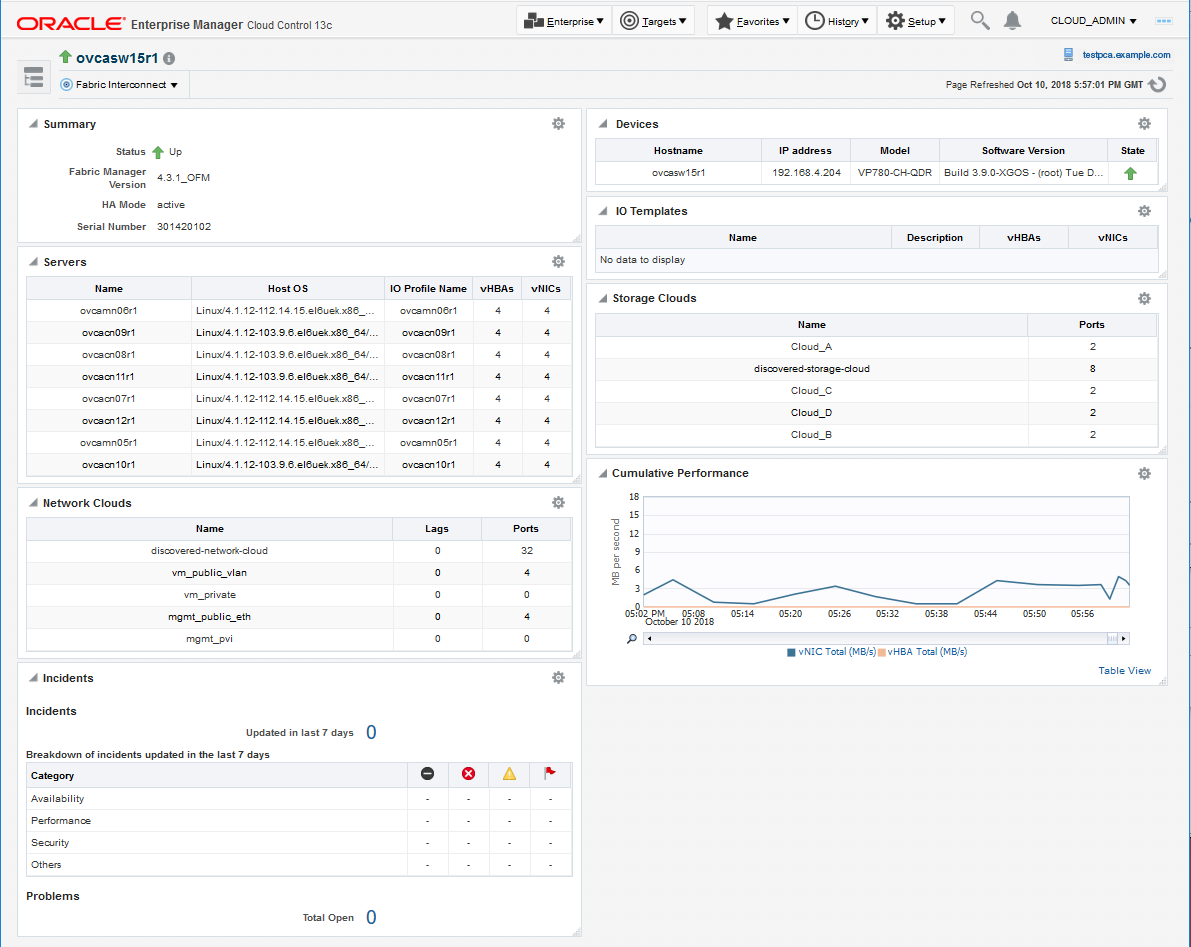
Figure 4-5 Oracle Fabric Interconnect Target Home Page

Summary
Oracle Fabric Manager supports high availability mode, in which multiple Fabric Manager servers are associated with each other to provide a system of Fabric Manager servers that operate in active or passive roles. The summary section of the Fabric Interconnect home page lists the current Oracle Fabric Manager's status and version, and the high availability mode.
Cumulative Performance
When vNICs and vHBAs are configured and deployed on the host server, it can be seen in the graph of the network and storage total throughput.
Devices
Information about the Oracle Fabric Interconnect chassis and the Oracle SDN that are managed through the Oracle Fabric Manager is displayed in the Fabric Interconnect home page. The Devices table displays the host name of each managed device, the device IP address, the software version currently installed on each managed device, the current state of the managed device and the model of the device.
Servers
Oracle Fabric Manager discovers servers that are connected through the devices and have Oracle Virtual Networking Drivers installed. This table lists the host name of each server that Oracle Fabric Manager has discovered, the operating system currently in use on the host server, the name of the I/O profile bound to each server, and the total number of vNICs and vHBAs that are configured on the server.
I/O Templates
When I/O templates are configured, they are listed in the Fabric Interconnect home page regardless of whether they are deployed to a host server or not. This table lists the name of each configured I/O template, the total number of vNICs and vHBAs configured in each I/O template, and the description that was applied to the I/O template.
Network Clouds
Information about the Private Virtual Interconnect (PVI) clouds is displayed. If Oracle Fabric Interconnect is attached, this table lists the name of each configured cloud, the number of Ethernet ports, and link aggregation groups (LAGs) in the cloud.
Storage Clouds (only for Oracle Fabric Interconnect)
Information about the configured storage clouds is displayed. This table lists the name of each configured cloud, and the number of Fiber Channel ports in the storage cloud.
Alarms
The Oracle Fabric Interconnect target monitors system events and network management alarms tracked by the Oracle Fabric Manager.
The alarms shown in the Fabric Interconnect home page are of one of the following severities:
-
Critical
-
Major
-
Minor
-
Warning
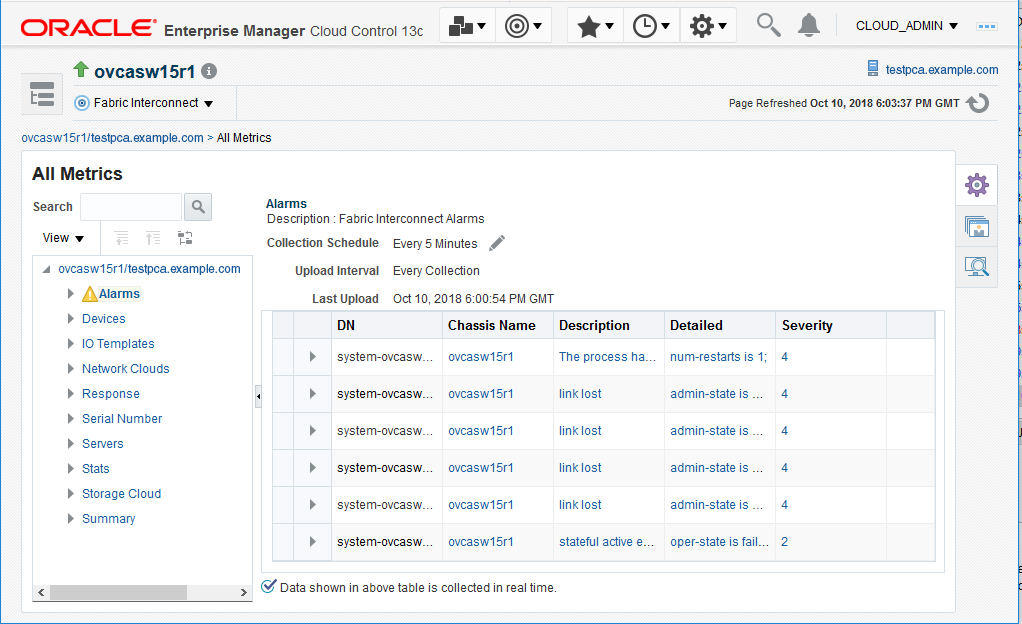
To view critical, major, minor, and warning alarms go to the Target's All Metrics page, and select the Alarms metric. Critical alarms are displayed in the Incidents and Problems section of the Fabric Interconnect home page. Major, warning and minor alarms can also appear on the Incidents and Problems section, if the user activates a rule for this purpose.
Figure 4-6 Alarms Shown in the All Metrics Page
