Reporting
To monitor the performance of the database machine or the storage server by viewing the metrics and diagnostic data, access the support workbench or create a dashboard for access the database machine reports and capacity planning reports.
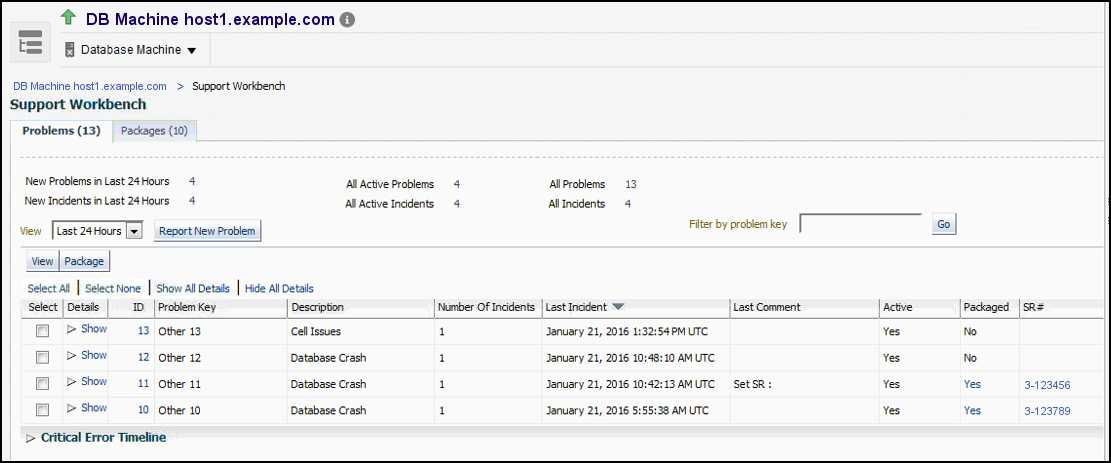
Accessing Oracle Support Workbench for Exadata Storage Server
You can access the Oracle Support Workbench for the current Exadata Storage Server to access diagnostic data for problems and incidents related to the Exadata Storage Server.
To access the Support Workbench for a single Exadata Storage Server, follow these steps:
Accessing Oracle Analytics Server Reports
Access the Oracle Analytics Server to run the Exadata reports Exadata Capacity Planning Details and Exadata vCPU Consumption Report to understand the health and utilization of your Exadata portfolio.
-
To access the Exadata reports, you will need a Standalone Oracle Analytics Server. See Standalone Oracle Analytics Server in Oracle Enterprise Manager Cloud Control Administrator's Guide.
-
Expand the Exadata Reports tree.
The links to the following reports are displayed:
-
Capacity Planning Details: The capacity planning report for Oracle Exadata Database Machine.
-
Exadata Cloud Service Capacity Planning Report: The capacity planning report for Oracle Exadata Cloud. See Exadata Cloud Service Capacity Planning Report in Oracle Enterprise Manager Cloud Control for Oracle Exadata Cloud.
Note that the report for Oracle Exadata Cloud has a subset of applicable sections of the Capacity Planning Details report used for Oracle Exadata Database Machine, specifically: Configuration, Global Summary, Storage Capacity Planning Details, CPU and Memory Capacity Planning Details, and IO Capacity Planning Details.
-
Exadata vCPU Consumption Report: Total daily vCPU consumption and daily vCPU consumption by compute node and virtual host for Exadata.
-
-
Click the link on the report to view it. In the resulting report page, you can optionally obtain the report in PDF, HTML, RTF, Excel or PowerPoint formats.
Exadata Capacity Planning Details
Capacity Planning Details report enables you to analyze and visualize the utilization and health of Exadata resources like storage, CPU, memory, IO and network. It also helps to plan for upcoming resource requirements.
Some of the benefits of monitoring your resources:
- Optimum Resource Usage: Helps you to fine tune the size and number of resources to ensure that you are getting optimum output
- Cost Efficiency: You pay for the exact amount of resources that you will use
- Predictive Capacity Planning: Based on the past performance of your configuration, you can plan your resources for future requirements
- Improved IT Management: Helps you to keep a close watch on the performance and health parameters of your resources
Exadata Machine Configuration
This section reports the name of the Exadata Database Machine for which the capacity planning report is generated. It also lists the various hosts and their corresponding host types associated with the configuration. The host type can be Database Node or Storage Cell.
Global Summary
This section summarizes the key metrics of your configuration for the time ranges like Last 24 hours, Last 7 Days, Last 31 Days, and Last 365 Days. The same key metrics are analyzed in greater details in the following sections of the report.
The metrics for Last 24 Hours time range are calculated based on the metric collection frequency.
The metrics for the Last 7 Days time range are calculated based on the hourly aggregated data.
The metrics for the Last 31 Days and Last 365 Days time ranges are calculated based on the daily aggregated data.
This is an example global summary of an Exadata Database Machine:

Storage Capacity Planning Details
As an administrator, you can use the Storage Capacity Planning Details section to diagnose and resolve issues in your storage systems, thus resulting in better performance of not only the storage systems but also the applications relying on them. This section displays the current and historical storage space usage information for all the disk groups.
The current space usage is reported based on the data that was last collected. The following parameters are tabulated for each disk group:
- Redundancy
- Used (%)
- Total Size (GB) - Raw
- Free Space (GB) - Raw
- Used Space (GB) - Raw
- Total Size (GB) - Usable
- Free Space (GB) - Usable
- Used Space (GB) - Usable
The historical report is generated based on the data available for the selected time range. The following parameters are tracked and plotted in a line chart along the y-axis against time which is on x-axis:
- Historical Space Usage By Disk Group (GB) - Usable
- Historical Space Usage By Disk Group (%) - Usable
- Historical Total Space Usage (GB) - Raw
- Historical Total Space Usage (GB) - Usable
- Historical Space Usage by the Top 5 Serviced Databases - As seen daily
CPU and Memory Capacity Planning Details
Your CPU and Memory utilizations should not be at critical limits during normal load hours. You should determine CPU and Memory utilizations based on your application needs, including CPU and Memory cycles for peak usage. If your CPU and Memory utilizations are optimized at 100% during normal load hours, you have no capacity to handle a peak load. A mismatch between the capacity and the demands can result in unsatisfactory utilization of resources.
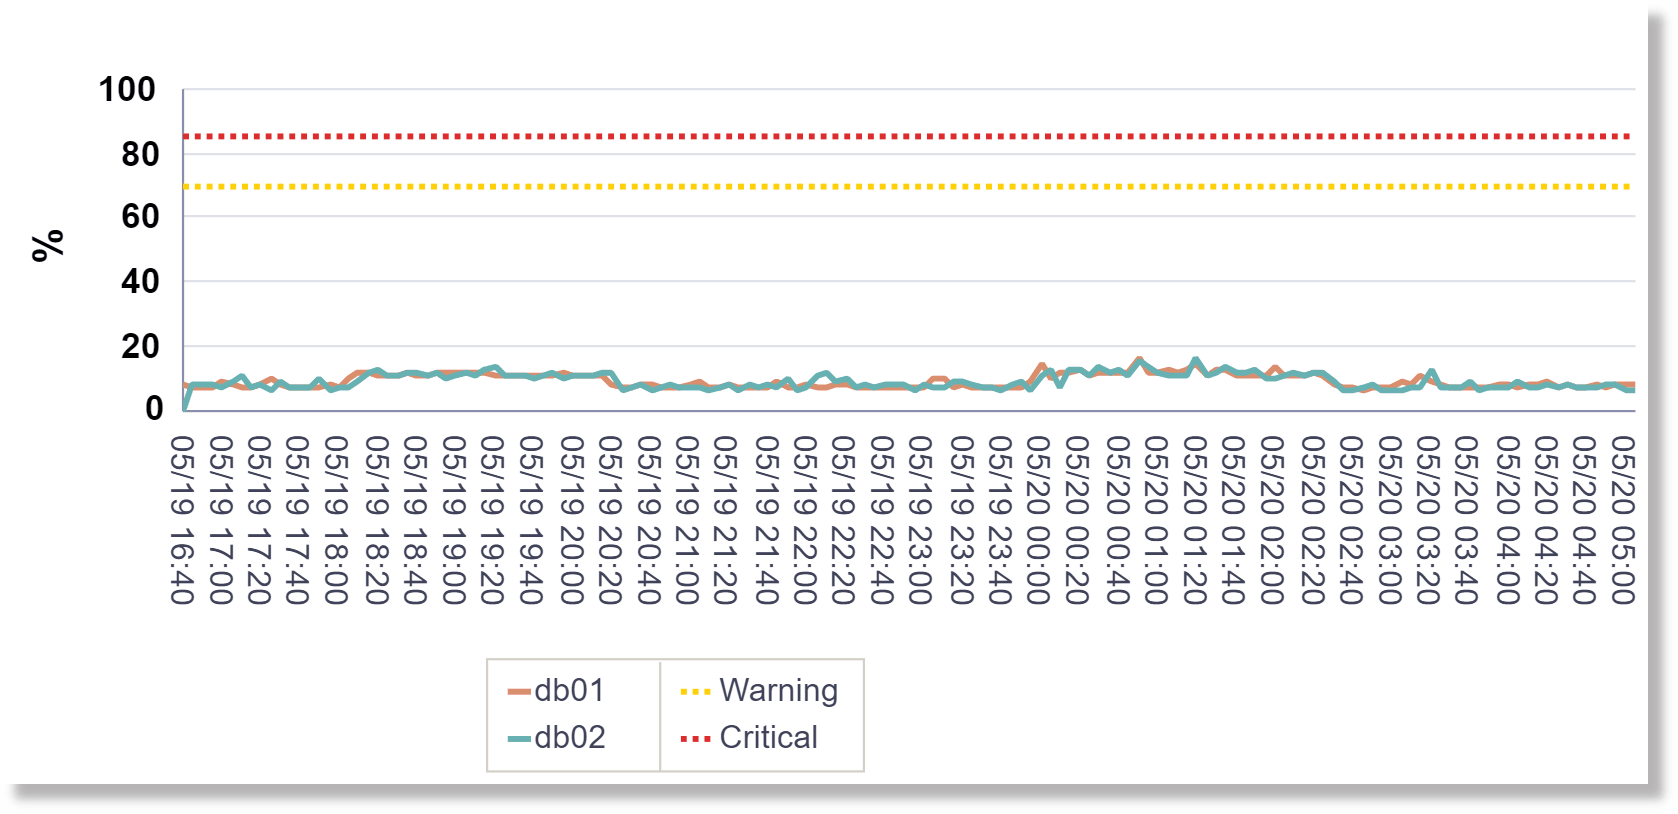
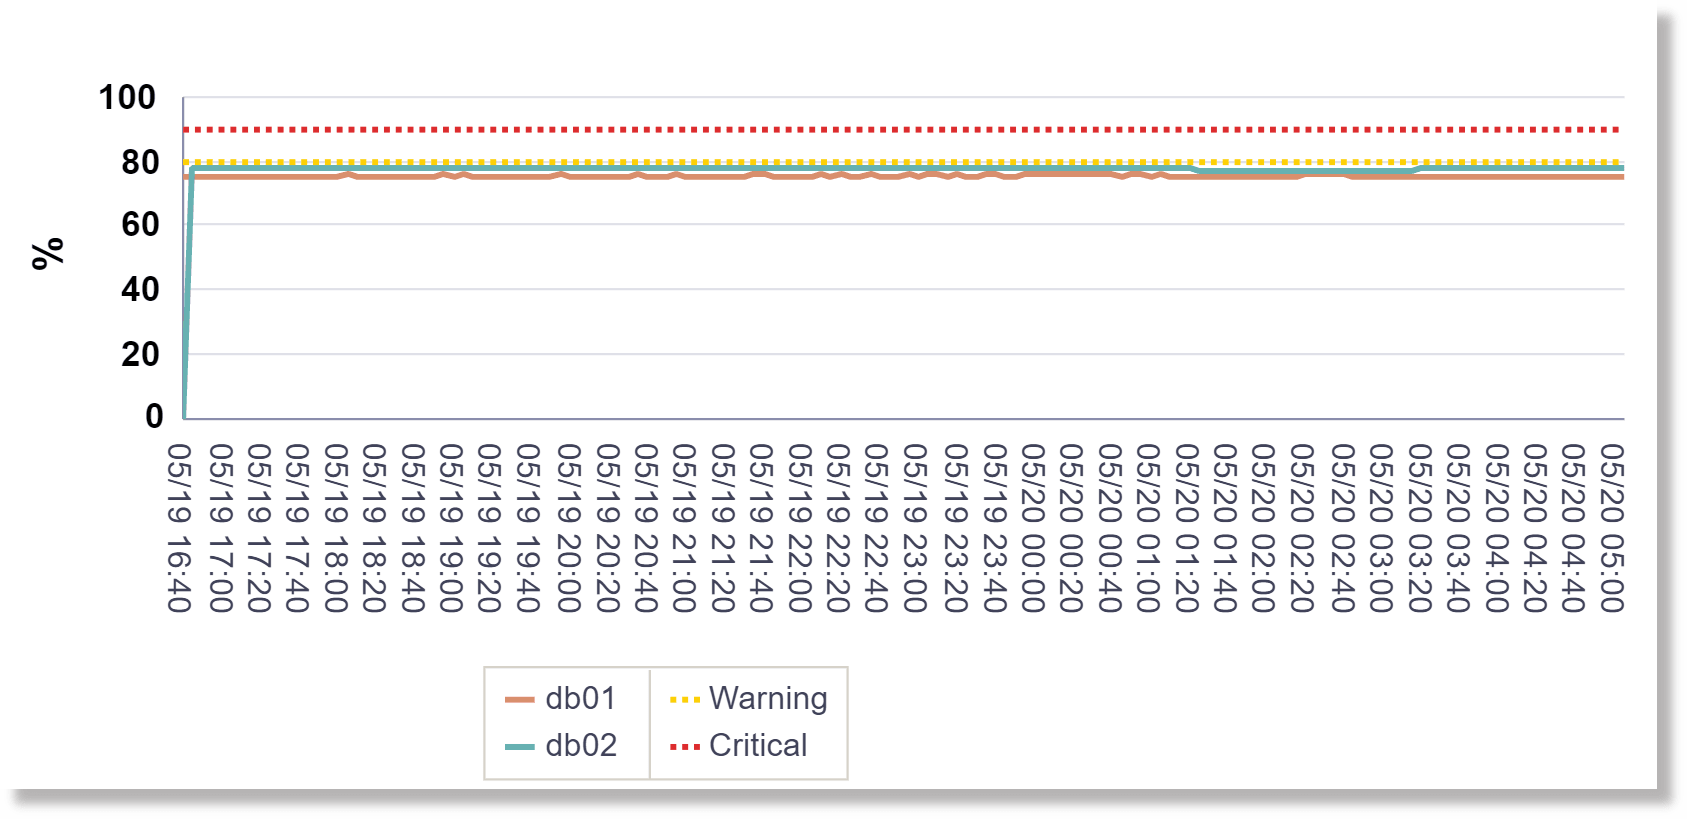
In the CPU and Memory Capacity Planning Details section, CPU Utilization and Memory Utilization parameters of each database node are measured and plotted in line charts for the time ranges Last 24 Hours, Last 7 Days, Last 31 Days, and Last 365 Days.
Following is an example of the CPU Utilization metric for the 24 hours time range:
Following is an example of the Memory Utilization metric for the 24 hours time range:
IO Capacity Planning Details
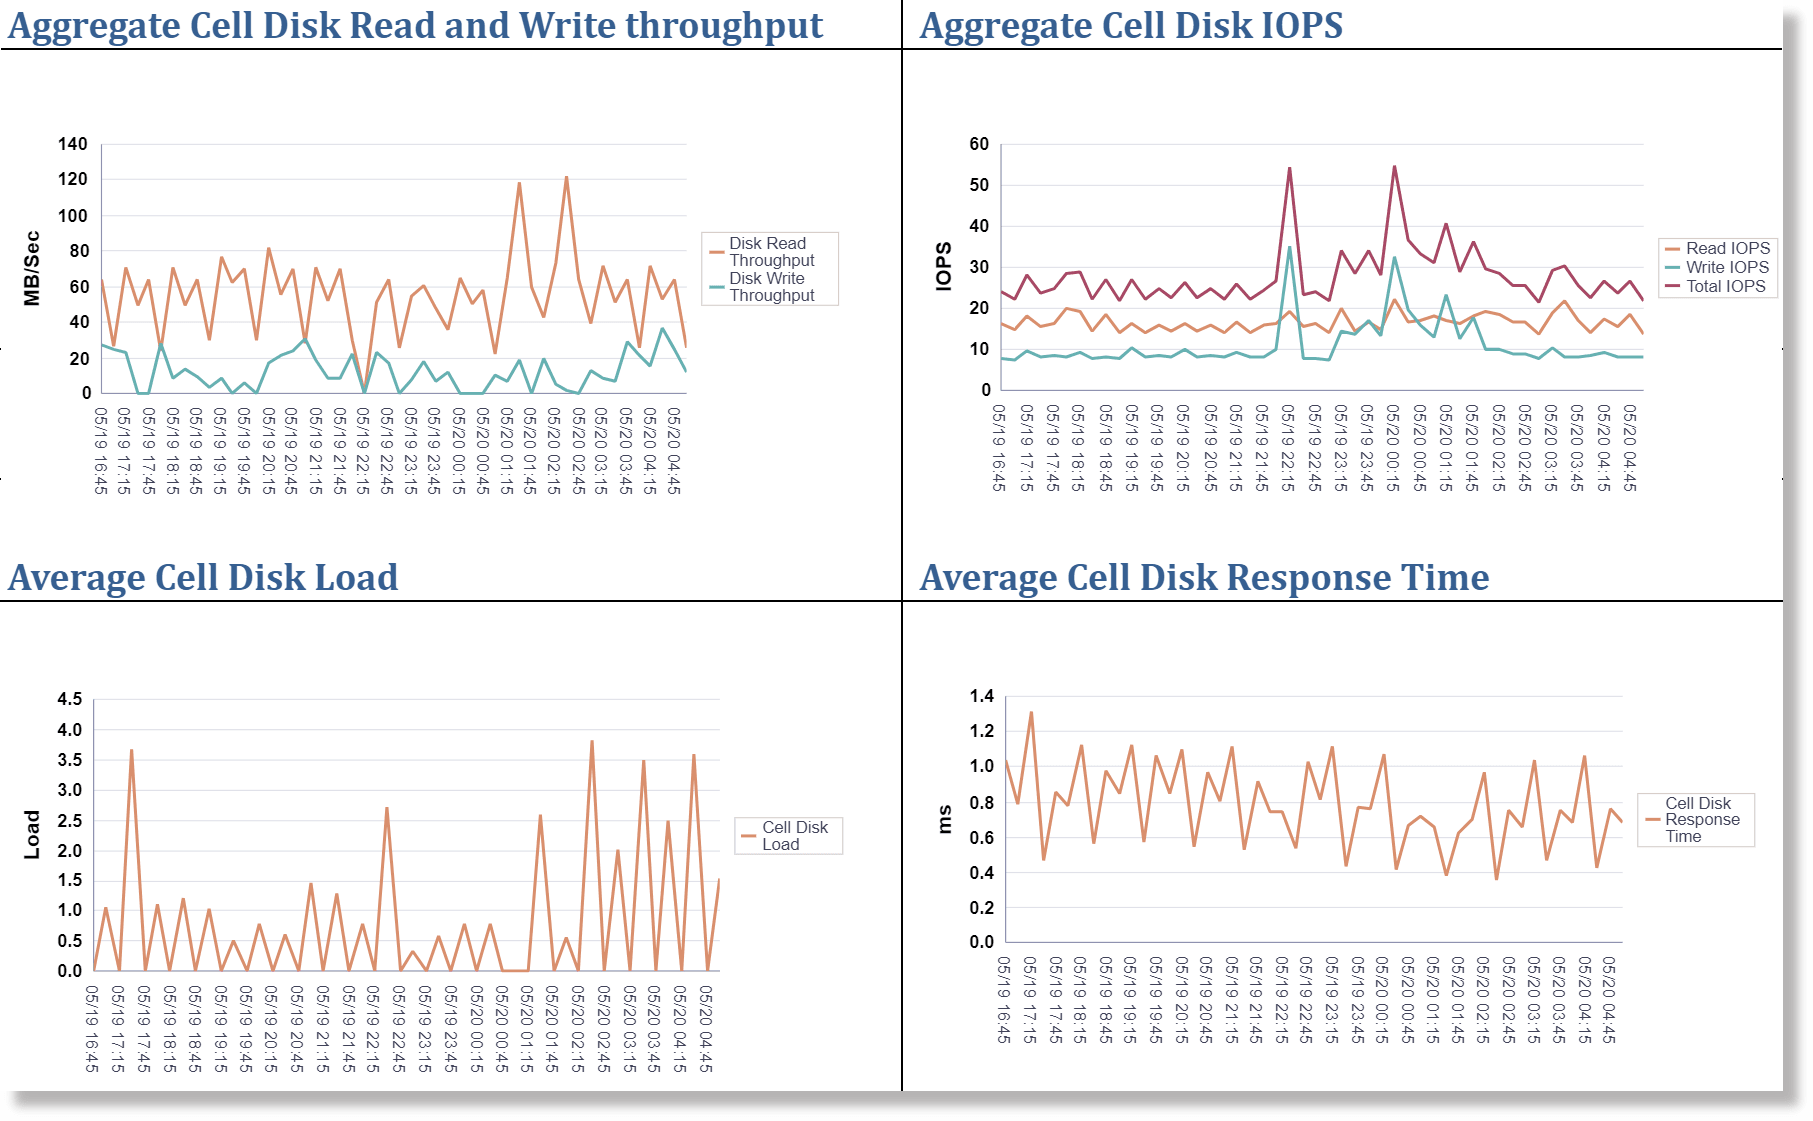
The IO Capacity Planning Details section displays the current and historical IO, throughput and disk utilization aggregated across all the storage servers for the selected Exadata Database Machine. It summarizes the amount of data being stored in the disks, the read/write throughput rate, and load handling in response to normal and peak demands. Use this section to optimize your disk resources and to plan for future demands.
The following parameters of Cell Disk and Flash are measured and plotted in line charts for the time ranges Last 24 Hours, Last 7 Days, Last 31 Days, and Last 365 Days:
- Average Cell Disk Utilization
- Aggregate Cell Disk Read and Write throughput
- Disk Read Throughput
- Disk Read Throughput
- Aggregate Cell Disk IOPS
- Read IOPS
- Write IOPS
- Total IOPS
- Average Cell Disk Load
- Average Cell Disk Response Time
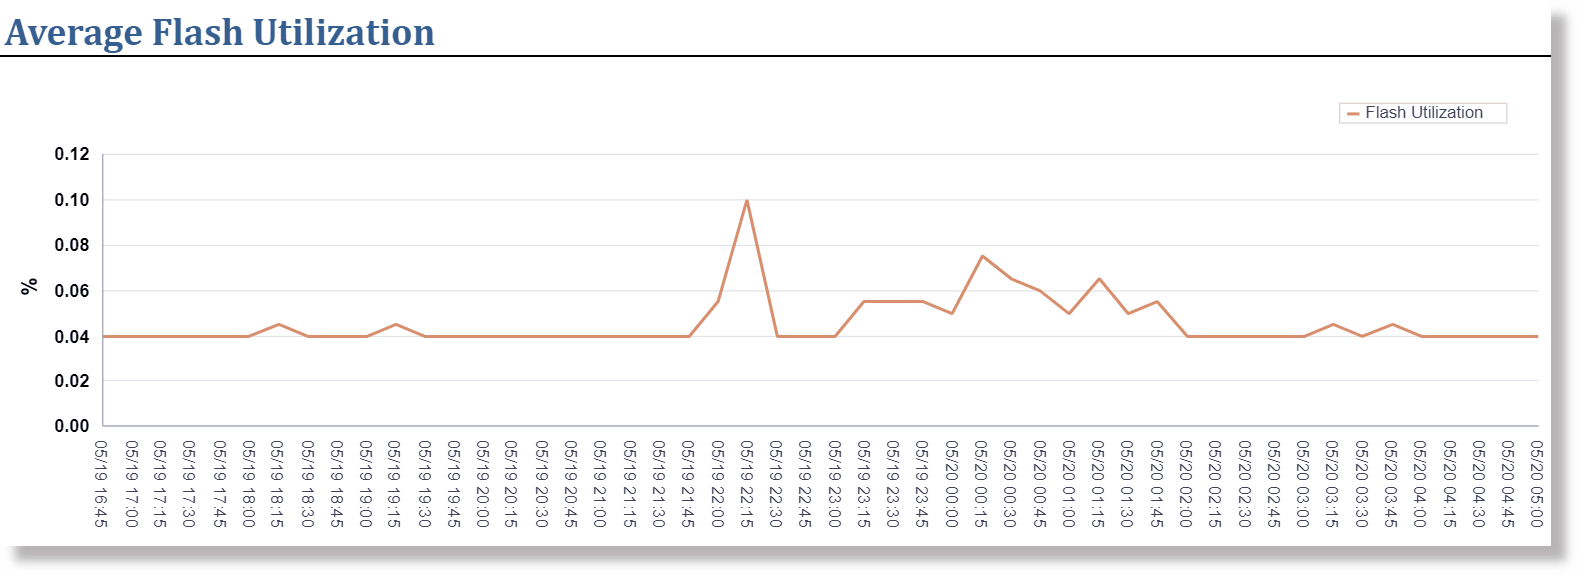
- Average Flash Utilization
- Aggregate Flash Read and Write throughput
- Flash Read Throughput
- Flash Read Throughput
- Aggregate Flash IOPS
- Read IOPS
- Write IOPS
- Total IOPS
- Average Flash Load
- Average Flash Response Time
Following is an example of the average utilization of Flash over a 24-hour time range:
Following is an example of the various IO capacity metrics of a Cell Disk over a 24-hour time range:
Network Capacity Planning
The Network Capacity Planning section displays the Bonded (logical) interfaces and Slave (Physical) interfaces throughput. Network bonding corresponds to a single IP address and is the single logical bonded interface formed by aggregating multiple physical network interfaces. Use this section to determine the amount of network traffic handled at various loads.
The section displays the following Transmit and Receive throughputs in Gb/sec for bonded and slave interfaces measured and plotted in line charts for the time ranges Last 24 Hours, Last 7 Days, Last 31 Days, and Last 365 Days:
- Transmit - Bonded Interfaces
- Receive - Bonded Interfaces
- Transmit - Slave Interfaces
- Receive - Slave Interfaces
This section does not show the RDS protocol traffic metrics.
Exadata vCPU Consumption Report
Use the Exadata vCPU Consumption Report to track the vCPU usage of your virtualized Exadata Database Machine. Compare the vCPU consumption for different payloads and plan the vCPU allocations for future requirements.
The two parameters used in the report are Exadata target name and time period. The report is generated based on an Exadata target, and defined for the time ranges like 7 Days, 30 Days, 90 Days, 180 Days, and 1 Year, 2 years, 3 years, and 4 years. The default time range is 30 Days. If there is no data on a specific day, then the default value is 0.
Report Summary: The summary includes the selected Exadata target name, selected time period, current total vCPU consumption, and total number of physical CPUs enabled. The last two values add all the current values together from each virtual machine.
The following metrics are generated in the report for the specific Database Machine:
Total Daily vCPU Consumption
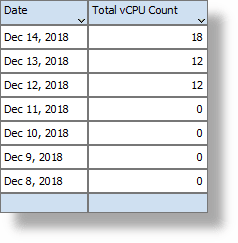
Total vCPU consumption is reported based on the time period that you select. For example, if you select 30 days, the data for 30 days including the current date is reported. The details like Exadata target, compute nodes, and hosts are obtained from the Exadata target name and target association relationship. The CPU count is obtained from the historical host configuration metrics. Within a day, only the high value of the number of vCPUs is used for the daily CPU count. On the whole, the CPU count is aggregated by the virtual host for each day. The chart that displays the total vCPU consumption for the time period of 90 days is shown below:
Following is the total vCPU consumption table for a time period of 7 days:
Daily vCPU Consumption by Compute Node and Virtual Host
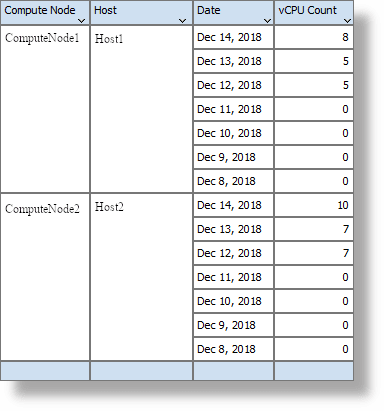
This table is similar to the table for total vCPU consumption, but without the aggregation of the count. The section presents the data grouped by compute nodes and host.
Following is the daily vCPU consumption of the listed compute nodes and their hosts:
Oracle Exadata Database Machine Dashboard Creation
You can create a Database Machine dashboard to monitor the performance and usage metrics of the Database Machine system, its sub-components, as well as all the database system components residing on the Database Machine.
How to Make the Report "Public"
The generated report is accessible only by the Enterprise Manager user who creates it. To make the report public:
- Select the dashboard report from the list of Information Publisher reports shown after following the steps mentioned above.
- Click Edit.
- Select the Run report using target privileges of the report owner option under Privileges section in General tab.
- Click the Access tab.
- Select the Allow viewing without logging in to Enterprise Manager option.
- Click OK.

