2 Logs
This chapter explains the process to retrieve the logs and status that can be used for effective troubleshooting.
Collecting Logs
This section describes the steps to collect logs from PODs and containers. Perform the following steps:
- Run the following command to get the PODs
details:
$ kubectl -n <namespace_name> get pods - Collect the logs from the specific pods or
containers:
$ kubectl logs <podname> -n <namespace> -c <containername> - Store the log in a file using the following
command:
$ kubectl logs <podname> -n <namespace> > <filename> - (Optional) You can also use the following commands for the log stream with file
redirection starting with last 100 lines of
log:
$ kubectl logs <podname> -n <namespace> -f --tail <number of lines> > <filename>
For more information on kubectl commands, see Kubernetes website.
Log Formats
This section provides information about the log formats.
Log4j JSON Format
Following are the log format and fields. All logs are represented in JSON format.
{
     "thread": <threadName>,
     "level": <log_level>,
     "loggerName": <name_of_the_logging_class>,
     "message": <message>,
     "instant": <timestamp_in_miliseconds>,
     "logTimestamp": <timestamp_in_readable_format>,
     "threadId": <threadId>,
     "threadPriority": <threadPriority>,
     "pod": <name_of_the_pod>,
     "processId": <processId>,
     "contextMap": <context_map>,
     "ocLogId": <unique_trace_id_for_every_request>,
     "instanceType": <instanceType>,
     "ingressTxId": <IngressTransactionId>
 }
Table 2-1 Log Details
| Name | Description | Example |
|---|---|---|
| thread | Name of the thread | "thread": "reactor-http-epoll-1" |
| level | Level of the log. It can be: Log level (INFO, WARN, DEBUG, TRACE) | "level": "INFO" |
| loggerName | Name of the class that generated the log | "loggerName": "ocpm.cne.gateway.cncc.GatewayApplication" |
| logTimestamp | Time represented in human readable format and in UTC. Format is date:yyyy-MM-dd'T'HH:mm:ss.SSSZ EFK friendly and also follows Oracle Standards | "logTimestamp": 2020-07-04'T'12:00:40.702Z |
| message | Information about the event | "message": "Started Application....."
By default, all messages are in simple string except Audit Log, Security Log which are represented in CNCC Message Format. |
| instant | The Date and Time the event occurred in epoch second and nano seconds | "instant": { "epochSecond": 1590045388, "nanoOfSecond": 339789000} |
| processId | Linux process Identifier (for a multi-process host) | Linux process Identifier (for a multi-process host). |
| threadId | Id of the thread | "threadId":"43" |
| threadPriority | Priority assigned to the thread | "threadPriority": 5 |
| pod | Name of the pods where the log is generated | "cncc-mcore-ingress-gateway-77df795fb5-wv2sb" |
| contextMap | It holds information added to threadContext. | "contextMap": { "hostname": "cncc-mcore-ingress-gateway-77df795fb5-wv2sb", "ingressTxId": "ingress-tx-1460885598"} |
| ocLogId | It contains the trace id that is uniquely generated for every request of the format "<timestamp(in milliseconds)>_<thread Id>_<POD name>" | It contains the trace id that is uniquely generated for every request of the format "<timestamp (in milliseconds)>_<thread Id>_<POD name>" |
| instanceType | Static tag which implies that instance type is production | "instanceType": "prod" |
| ingressTxId | It contains id of the format "ingress-tx-<Random no>" to track every transaction | "ingressTxId": ingress-tx-1904660570 |
CNCC Message Format
Table 2-2 CNCC Message Format
| Name | Description | Example | Possible Values |
|---|---|---|---|
| logType | Indicates whether it is Security Log or Audit Log | logType=AUDIT | AUDIT SECURITY |
| type | Indicates nature or action of the log | type=REQUEST | For Security Log: REQUEST, RESPONSE For Audit Log: LOGIN, ACCESS_RESOURCE, ACCESS_RESOURCE_ERROR, LOGOUT |
| resourceType | Indicates what is the resource being requested for | resourceType=SCP | CM_SERVICE (For default route) CNCC (For User Login Activity) SCP UDR NRF PCF (all CNCC supported NFs) |
| userId | Id of the user who triggered request or action | userId=3314f54f-08bf-489d-b395-27bf56da1262 | NA |
| username | Name of the user | username= "user1" | NA |
| status | HTTP status of the response. | status=200 OK | NA |
| operationType | HTTP method of the request | operationType=GET | NA |
| scheme | Indicates the scheme of the request | scheme=http | NA |
| remoteAddress | The remote address that is associated with the request. It also means the remote address to where this request is connected when available. | remoteAddress=/192.168.219.64:53587 | NA |
| localAddress | The local address that is associated with the request. It also means the local address to where this request is connected when available. | localAddress=cncc-mcore-ingress-gateway.cncc.svc.cluster.local/<unresolved>:30075 | NA |
| resourcePath | Request uri | resourcePath=/soothsayer/v1/canaryrelease/ | NA |
| queryParams | Query parameters associated with request | queryParams={form_id=9, page=1, view_id=78} | NA |
| headers | Headers associated with request or response | headers={Accept=*/*, X-Requested-With=XMLHttpRequest, User-Agent=Mozilla/5.0 (Windows NT 10.0; WOW64; rv:68.0) Gecko/20100101 Firefox/68.0, Connection=keep-alive, Host=cncc-core-ingress-gateway.cncc.svc.cluster.local:30075, Accept-Language=en-US,en;q=0.5, Accept-Encoding=gzip, deflate, DNT=1, Content-Type=application/json; charset=utf-8} | NA |
| payload | Payload or Data associated with request or response | payload=[{"serviceName":"n5g-eir-eic","canaryReleaseFlag":true,"apiFullVersion":"2.0.0","canaryTraffic":5} | NA |
| authenticationType | This indicates whether user is requesting resource logged in using CNCC or directly accessing through postman or curl. | authenticationType=OAUTH | OAUTH -> User is logged in through CNC Console application and accessing resource JWT -> User is accessing resource directly through postman or curl |
Log Levels
Logs register system events along with their date and time of occurrence. They also provide important details about a chain of events that could have led to an error or problem.
A log level helps in defining the severity level of a log message. For CNC Console, the log level of a microservice can be set to any one of the following valid values:
- TRACE: A log level that describes events, as a step by step execution of code. This can be ignored during the standard operation, but may be useful during extended debugging sessions.
- DEBUG: A log level used for events during software debugging when more granular information is needed.
- INFO: A standard log level indicating that something has happened, an application has entered a certain state, etc.
- WARN: A log level indicates that something unexpected has happened in the application, a problem, or a situation that might disturb one of the processes. But this does not mean that the application has failed. The WARN level should be used in situations that are unexpected, but the code can continue to work.
- ERROR: A log level that should be used when an application hits an issue preventing one or more functionalities from functioning.
Using this information, the logs can be filtered based on the system requirements. For instance, if you want to filter the critical information about your system from the informational log messages, set a filter to view messages with only WARN log level in Kibana.
Types of Logs
Regular logs
These logs contain error messages, warnings, or other events written within the application that provide logical, high level information about the application and ongoing events.
{"level": "INFO","message": "Started GatewayApplication in 10.748 seconds (JVM running for 12.825)"}
{"level": "INFO","message": "Creating plain httpClient"}
{"level": "INFO","message": "Creating plain restTemplate"}
{"level": "ERROR","message": "Can't get cfgs of topic public.dynamic.datamodel,  exception is:\n
javax.ws.rs.ProcessingException: java.net.ConnectException: Connection refused (Connection
        refused)"}
Audit Logs
These logs contain user related information and the activity within the system.
The following events are logged in CNC Console Core:
- Log in: A user has logged in.
- Access Resource: A user is accessing a particular NF resource.
- Access Resource Error: A user is denied from accessing a particular NF resource.
- Logout: A user has logged out.
Note:
The user can find the CNCC Core User Activity logs as part of cncc-core-ingress-gateway and are represented in CNCC message format.
The following events are logged in CNCC IAM:
Login events
- Log in: An admin user has logged in.
- Register: An admin user has registered.
- Logout: An admin user has logged out.
- Code to Token: An application or a client has exchanged a code for a token.
- Refresh Token: An application or a client has refreshed a
token.
Account events
- Update Email: The email address for an account has changed.
- Update Profile: The profile for an account has changed.
- Send Password Reset: A password reset email has been sent.
- Update Password: The password for an account has changed.
Note:
The user can find the CNCC IAM User Activity logs as part of cncc-iam-0, represented in Keycloak format. These events are provided by keycloak and documented under Keycloak Auditing End Events.Logging Error Logs are recorded by keycloak container as :^[[0m^[[33m10:12:57,388 WARN [org.keycloak.events] (default task-3) type=LOGIN_ERROR, realmId=master, clientId=security-admin-console, userId=ef58d62e-a0a8-4f4e-bcc6-abccf917641c, ipAddress=192.168.203.108, error=invalid_user_credentials, auth_method=openid-connect, auth_type=code, redirect_uri=http://10.75.240.33:30085/cncc/auth/admin/master/console/, code_id=3e6d822a-9e82-4660-bb01-a814f7ae8f97, username=admin, authSessionParentId=3e6d822a-9e82-4660-bb01-a814f7ae8f97, authSessionTabId=2ak6Xwal-28
Security Logs
The security logs contain the header, payload, method, scheme, URI information for all the requests and corresponding responses.
Disabling Security Logs
By default Security Log will be enabled for M-CCNC IAM, M-CNCC Core and A-CNCC Core. You can disable this by setting securityLogEnabled flag to false in custom values.yaml file.
# CNCC configuration
cncc:
  # Enable security logs for CNCC
  securityLogEnabled: false
Header Information
At all the log levels, sensitive information like Cookies are masked.
Note:
The user can find the Security logs :- For M-CNCC Core and A-CNCC Core, these are logged as part of cncc-mcore-ingress-gateway or cncc-acore-ingress-gateway and are represented in CNCC message format.
- For M-CNCC IAM, these are logged as part of cncc-iam-ingress-gateway and are represented in CNCC message format.
Log Levels
Default log levels set for M-CNCC Core and A-CNCC Core:
ingress-gateway:
  log:
    level:
      cncc:
        root: WARN
        audit: INFO
        security: INFO
Default log levels set for M-CNCC IAM:
ingress-gateway:
  log:
    level:
      cncc:
        root: WARN
        security: INFO
Supported Headers for Logging
| Header | Header values (regex) |
|---|---|
| Content-Type | ^application/x-www-form-urlencoded.* |
| ^application/json.* | |
| ^application/problem+json.* | |
| Accept | ^application/json.* |
| ^application/ld+json.* | |
| ^application/xml.* | |
| ^multipart/form-data.* |
- At INFO level, only those request and response that match the supporting headers and values are logged.
- At DEBUG level, no supporting headers used and all request and response are logged.
- At ERROR / WARN, no supporting headers used and only error or warnings are logged.
Note:
Any failure in authorizing a request will always be logged irrespective of the supported header configuration.
Configuring Security Logs
This section provides the details about configuring security logs.
By default, Security Log is set to the "INFO" level for both CNC Console Core and CNC Console IAM. You can change the log level by setting log.level.cncc.security to the required level in core and iam values.yaml file.
#Set the root log level
log:
  level:
    root: WARN
    ingress: INFO
    oauth: INFO
    cncc:
security: INFOBy default, the Security Log is enabled for both CNCC Core and CNCC IAM. You can disable
this by setting securityLogEnabled flag to false in core and iam
values.yaml file.
# CNCC configuration
cncc:
  enabled: false
  enablehttp1: false
  securityLogEnabled: false
Accessing logs
This section gives information about how to access the logs.
The CNCC application logs can be accessed in following ways:
- Run the following command to view logs of a cncc application pod:
kubectl logs -f -n <cncc_namespace> <pod_name> -c <container_name>Example:
CNCC Core:
CNCC IAM:$ kubectl logs -f -n cncc cncc-mcore-ingress-gateway-77df795fb5-wv2sb -c ingress-gateway (Security & Audit Log)$ kubectl logs -f -n cncc cncc-iam-ingress-gateway-77df795fb5-wv2sb -c ingress-gateway (Security Log)$ kubectl logs -f -n cncc cncc-iam-0 (Audit Log) - CNCC uses cloud native supported logging framework to view the
logs.
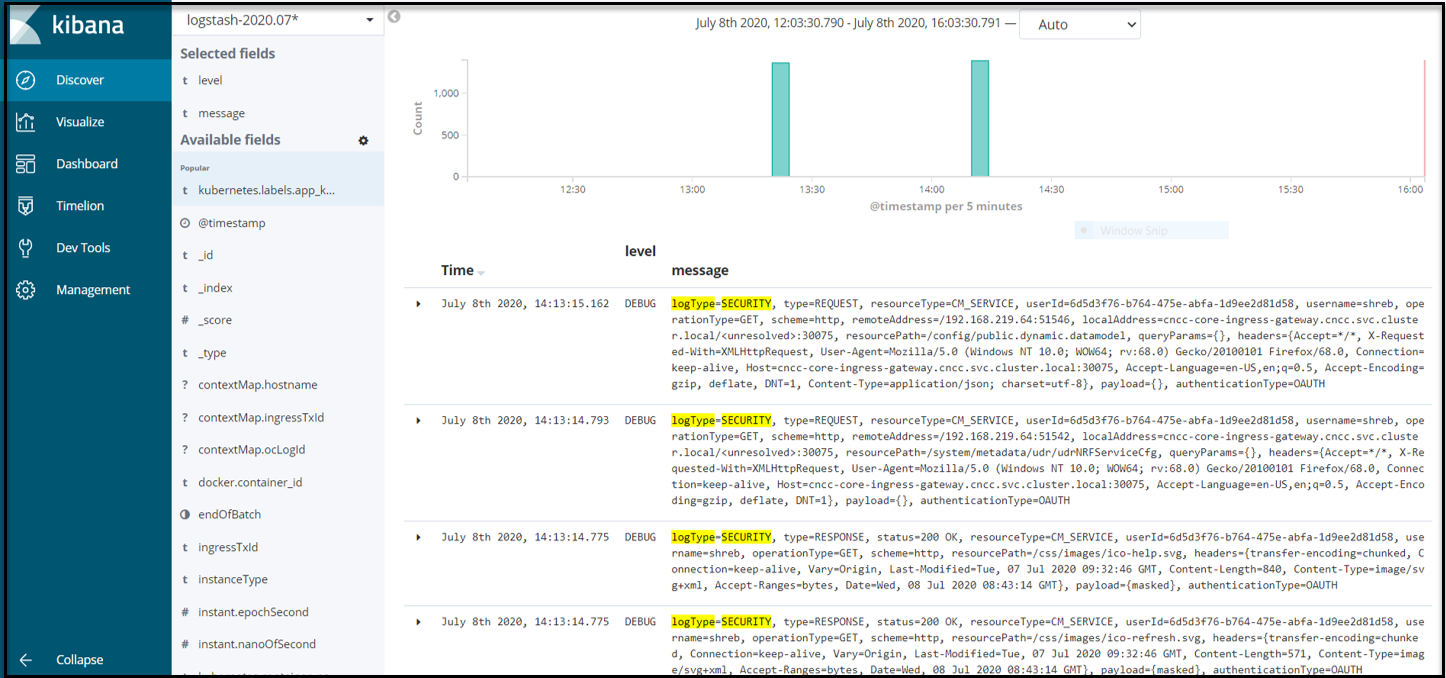
Example : Elasticsearch, Fluentd, and Kibana (EFK) can
be used here with CNC Console to view the logs as follows:
Figure 2-1 Log View
Debugging using Logs
This section provides information to debug CNC Console using Logs.
Table 2-3 CNCC Core Debugging through Logs
| Scenario | Level | Logs to be searched |
|---|---|---|
| CNC Core Login | INFO | Login successful |
| Session Timeout Value | INFO | Session timeout |
| Validating user authorization | INFO | User Authorization Details |
| Accessing a resource | DEBUG | Mapping [Exchange: GET |
| Updating a resource | DEBUG | Mapping [Exchange: PATCH 'or' Mapping [Exchange: PUT |
| Creating a new resource | DEBUG | Mapping [Exchange: POST 'or' Mapping [Exchange: PUT |
| CNCC Core Logout | INFO | Logout successful |