3 Benchmarking SCP Model C
This section describes Model C test topologies and test scenarios for benchmarking SCP.
3.1 Test Topology 1 for SCP Model C Benchmarking
The following image represents the test topology consisting of the following components:
-
SCP
- Consumer NF test simulator
- Producer NF test simulator
- NRF simulator
Figure 3-1 SCP Model C Topology 1
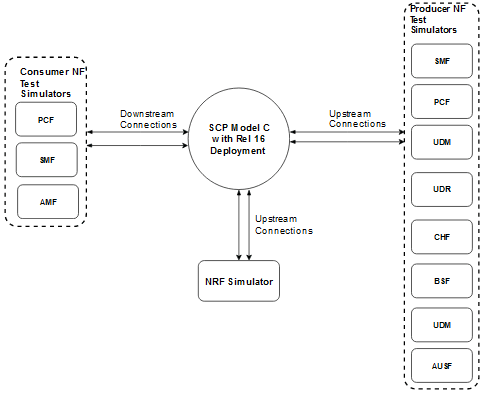
The aforementioned image represents the Model C test topology. In Release 16 Model C indirect 5G SBI communication mode, the consumer NF sends NF discovery service requests to NRF. After receiving the discovery response with NF profiles, the consumer NF performs the following tasks:
- Selects an NF Set or a specific NF instance from the NF Set
- Sends a service request to SCP with the address of the selected service producer NF in 3gpp-Sbi-Target-apiRoot header
- Creates multiple network interfaces for different subnet IPs
Then, SCP selects an NF service instance and routes the service requests to the selected producer NF. In case of failure, if reselection is required, SCP selects the producer NF instance based on the NF Set.
3.1.1 Topology 1 Call Flow
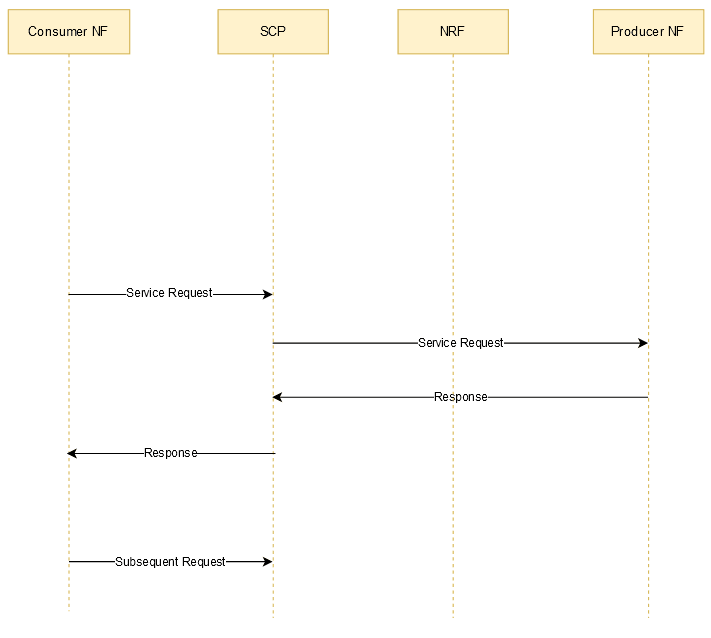
The following call flow represents how a service request is processed by SCP:
- Consumer NF sends the service request to SCP.
- SCP sends the request to the producer NF based on the NF profiles registered through NRF.
- Producer NF sends the response to SCP for the service request.
- SCP routes the response received from the producer NF to the consumer NF.
Figure 3-2 Topology 1 Call Flow
3.1.2 Topology 1 Traffic Distribution
The following table describes the percentage of messages processed by SCP using N11, N7, N10, N36, N28, and other interfaces.
Table 3-1 Topology 1 Traffic Distribution
| NF-C | NF-P | Interface Reference | NF Service | Percentage (%) of Messages |
|---|---|---|---|---|
| AMF | SMF | N11 | nsmf-pdusession | 50.00% |
| SMF | PCF | N7 |
npcf-smpolicycontrol |
30.00% |
| SMF | UDM | N10 |
|
10.90% |
| PCF | UDR | N36 |
nudr-dr |
0.40% |
| PCF | CHF | N28 | nchf-spendinglimitcontrol | 0.40% |
| PCF | BSF | Nbsf | nbsf-management | 0.30% |
| AMF | UDM | N8 |
|
2.50% |
| AMF | AUSF | N12 | nausf-auth | 2.50% |
| AMF | PCF | N15 |
|
3.00% |
Topology 1 Routing Configuration
The following table describes the routing configurations for the NF services:
Table 3-2 Routing Configuration
| NF | Service | Initial Message | Subsequent Message | reverseProxySupport | Deployment | ResponseTimeout | ||
|---|---|---|---|---|---|---|---|---|
| routePolicy | reroutePolicy | routePolicy | reroutePolicy | |||||
| SMF | Nsmf_PDUSession | Load_Balance | RerouteWithinRegion | Load_Balance | RerouteWithinRegion | False | REGIONAL | 1s |
| PCF | Npcf_SMPolicyControl | Load_Balance | RerouteWithinRegion | Load_Balance | RerouteWithinRegion | False | REGIONAL | 1s |
| UDR | Nudr_dm | Load_Balance | RerouteWithinSite | Load_Balance | RerouteWithinSite | False | SITE_WIDE | 1s |
| CHF | Nchf_SpendingLimitControl | Load_Balance | RerouteWithinSite | Load_Balance | RerouteWithinSite | False | SITE_WIDE | 1s |
| UDM | Nudm_sdm | Load_Balance | RerouteWithinSite | Load_Balance | RerouteWithinSite | False | SITE_WIDE | 1s |
| UDM | Nudm_uecm | Load_Balance | RerouteWithinSite | Load_Balance | RerouteWithinSite | False | SITE_WIDE | 1s |
| PCF | Npcf_AMPolicyControl | Load_Balance | RerouteWithinSite | Load_Balance | RerouteWithinSite | False | SITE_WIDE | 1s |
| PCF | Npcf_UEPolicyControl | Load_Balance | RerouteWithinSite | Load_Balance | RerouteWithinSite | False | SITE_WIDE | 1s |
| AUSF | Nausf_UEAuthentication | Load_Balance | RerouteWithinSite | Load_Balance | RerouteWithinSite | False | SITE_WIDE | 1s |
| BSF | Nbsf_management | Load_Balance | RerouteWithinSite | Load_Balance | RerouteWithinSite | False | SITE_WIDE | 1s |
| UDR | Nudr_udrService | Load_Balance | RerouteWithinSite | Load_Balance | RerouteWithinSite | False | SITE_WIDE | 1s |
Topology 1 NF Profiles
The following table describes NF profile configuration, traffic, and message call flows for 176 NF profiles registered on SCP:
Table 3-3 NF Profiles
| NF-C | NF-P | Interfaces | Supported Services | Service-related traffic | Profiles Registered | NF Range | Message Call Flows |
|---|---|---|---|---|---|---|---|
| AMF | SMF | N11 |
|
nsmf-pdusession | 80 | SMF1 to SMF80 |
|
| AMF | PCF | N15 |
|
|
12 | PCF1 to PCF12 |
Npcf_AMPolicyControl
Npcf_UEPolicyControl
|
| SMF | PCF | N7 |
|
npcf-smpolicycontrol | 38 | PCF13 to PCF50 |
|
| SMF | UDM | N10 |
|
|
3 | UDM1 to UDM3 |
Nudm_sdm
Nudm_uecm
|
| AMF | UDM | N8 |
|
|
3 | UDM4 to UDM6 |
Nudm_sdm
Nudm_uecm
|
| PCF | UDR | N36 |
|
nudr-dr | 10 | UDR1 to UDR10 |
|
| PCF | CHF | N28 |
|
nchf-spendinglimitcontrol | 10 | CHF1 to CHF10 |
|
| AMF | AUSF | N12 |
|
nausf-auth | 10 | AUSF1 to AUSF10 | Authenticate UE |
| PCF | BSF | Nbsf | nbsf-management | nbsf-management | 10 | BSF1 to BSF10 |
|
3.2 Test Topology 2 for SCP Model C Benchmarking with SBI Message Feed
The following image represents the test topology consisting of the following components:
-
SCP
- Consumer NF test simulator
- Producer NF test simulator
- NRF simulator
- Oracle Communications Network Analytics Data Director (OCNADD)
Figure 3-3 SCP Model C Topology 2
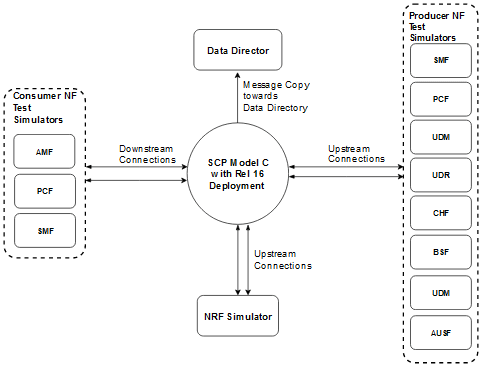
The aforementioned image represents the Model C test topology. In Release 16 Model C indirect 5G SBI communication mode, the consumer NF sends NF discovery service requests to NRF. After receiving the discovery response with NF profiles, the consumer NF performs the following tasks:
- Selects an NF Set or a specific NF instance from the NF Set
- Sends a service request to SCP with the address of the selected service producer NF
- Creates multiple network interfaces for different subnet IPs
- Service requests from consumer NF are copied to OCNADD and then forwarded to the third-party
Then, SCP selects an NF service instance and routes the service requests to the selected producer NF. In case of failure, if reselection is required, SCP selects the producer NF instance based on the NF Set.
3.2.1 Topology 2 Call Flow
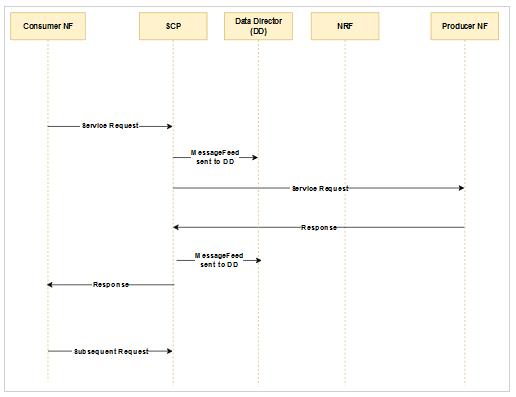
The following call flow represents how a service request is processed by SCP:
- Consumer NF sends the service request to SCP.
- SCP sends the request to the producer NF based on the NF profiles registered through NRF.
- Producer NF sends the response to SCP for the service request.
- SCP routes the response received from the producer NF to the consumer NF.
- SCP copies the requests and responses to DD.
Figure 3-4 Topology 2 Call Flow
3.2.2 Topology 2 Traffic Distribution
The following table describes the percentage of messages processed by SCP:
Table 3-4 Topology 2 Traffic Distribution
| NF-C | NF-P | Interface Reference | NF Service | Percentage (%) of Messages |
|---|---|---|---|---|
| SMF | PCF | N7 |
npcf-smpolicycontrol |
79.55% |
| SMF | UDM | N10 |
|
7.58% |
| PCF | UDR | N36 |
nudr-dr |
0.76% |
| PCF | CHF | N28 | nchf-spendinglimitcontrol | 0.76% |
| SMF | CHF | N40 | nchf-convergedcharging | 11.36% |
Topology 2 Routing Configuration
The following table describes the routing configurations for the NF services:
Table 3-5 Routing Configuration
| NF | Service | Initial Message | Subsequent Message | reverseProxySupport | Deployment | ResponseTimeout | ||
|---|---|---|---|---|---|---|---|---|
| routePolicy | reroutePolicy | routePolicy | reroutePolicy | |||||
| PCF | npcf-smpolicycontrol | Load_Balance | RerouteDisabled | Load_Balance | RerouteDisabled | False | SITE_WIDE | 3s |
| UDM | nudm-sdm | Load_Balance | RerouteDisabled | Load_Balance | RerouteDisabled | False | SITE_WIDE | 3s |
| UDM | nudm-uecm | Load_Balance | RerouteDisabled | Load_Balance | RerouteDisabled | False | SITE_WIDE | 3s |
| UDR | nudr-dr | Load_Balance | RerouteDisabled | Load_Balance | RerouteDisabled | False | SITE_WIDE | 3s |
| PCF | nchf-spendinglimitcontrol | Load_Balance | RerouteDisabled | Load_Balance | RerouteDisabled | False | SITE_WIDE | 3s |
| CHF | nchf-convergedcharging | Forward_Route | RerouteWithinSite | Forward_Route | RerouteWithinSite | True | SITE_WIDE | 1s |
Topology 2 NF Profiles
The following table describes NF profile configuration, traffic, and message call flows for 15 NF profiles registered on SCP:
Table 3-6 NF Profiles
| NF-C | NF-P | Interfaces | Supported Services | Service-related traffic | Profiles Registered | NF Range | Message Call flows |
|---|---|---|---|---|---|---|---|
| SMF | PCF | N7 |
|
npcf-smpolicycontrol | 8 | PCF1-PCF5 |
|
| SMF | UDM | N10 |
|
|
2 | UDM1 to UDM2 |
|
| PCF | UDR | N36 |
|
|
1 | UDM1 |
|
| PCF | CHF | N28 |
|
nchf-spendinglimitcontrol | 2 | CHF1-CHF2 |
|
| SMF | CHF | N40 |
|
nchf-convergedcharging | 2 | CHF1-CHF2 |
|
3.3 Test Topology 3 for SCP Model C Benchmarking
The following image represents the test topology consisting of the following components:
-
SCP
- Consumer NF test simulator
- Producer NF test simulator
- NRF simulator
Figure 3-5 SCP Model C Topology 3
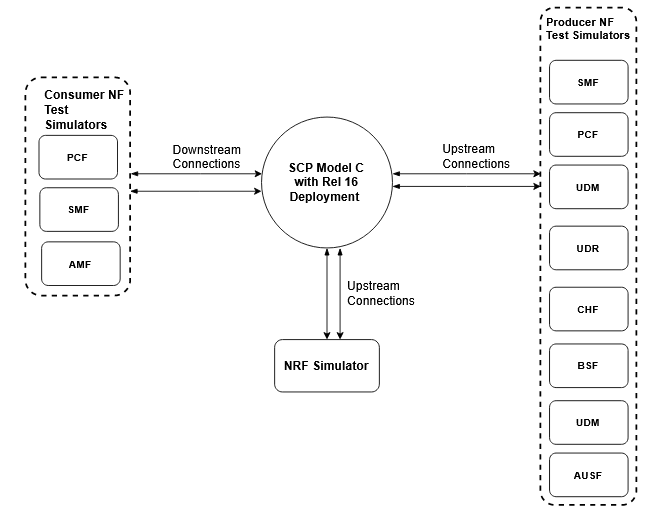
The aforementioned image represents the Model C test topology. In Release 16 Model C indirect 5G SBI communication mode, the consumer NF sends NF discovery service requests to NRF. After receiving the discovery response with NF profiles, the consumer NF performs the following tasks:
- Selects an NF Set or a specific NF instance from the NF Set
- Sends a service request to SCP with the address of the selected service producer NF in 3gpp-Sbi-Target-apiRoot header
- Creates multiple network interfaces for different subnet IPs
Then, SCP selects an NF service instance and routes the service requests to the selected producer NF. In case of failure, if reselection is required, SCP selects the producer NF instance based on the NF Set.
3.3.1 Topology 3 Call Flow
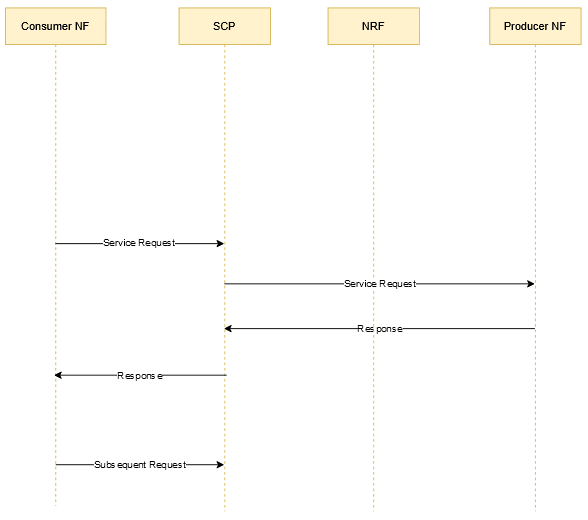
The following call flow represents how a service request is processed by SCP:
- Consumer NF sends the service request to SCP.
- SCP sends the request to the producer NF based on the NF profiles registered through NRF.
- Producer NF sends the response to SCP for the service request.
- SCP routes the response received from the producer NF to the consumer NF.
Figure 3-6 Topology 3 Call Flow
3.3.2 Topology 3 Traffic Distribution
The following table describes the percentage of messages processed by SCP using N8, N11, N7, N10, N36, N28, and other interfaces.
Table 3-7 Topology 3 Traffic Distribution
| NF-C | NF-P | Interface Reference | Percentage (%) of Messages |
|---|---|---|---|
| SMF | PCF | N7 | 60 |
| SMF | UDM | N10 | 5 |
| PCF | UDR | N36 | 1 |
| PCF | CHF | N28 | 1 |
| SMF | CHF | N40 | 10 |
| NRF | SLF | - | 3 |
| PCF | BSF | Nbsf | 2 |
| AMF | UDM | N8 | 7.5 |
| AMF | AUSF | N12 | 7.5 |
| AMF | PCF | N15 | 3 |
| NRF | SCP | Notifications | 10 notifications every 15 minutes |
Note:
Only UDM, AUSF, and UDR traffic traverses between regions through inter-SCP and is ~30% of the overall AUSF, UDM, and UDR traffic rates as represented by the rate captured for SCP.Topology 3 Routing Configuration
The following table describes the routing configurations for the NF services:
Table 3-8 Routing Configuration
| NF | Service | Initial Message | Subsequent Message | Deployment | ResponseTimeout | ||
|---|---|---|---|---|---|---|---|
| routePolicy | reroutePolicy | routePolicy | reroutePolicy | ||||
| PCF | Npcf_SMPolicyControl | Load_Balance | RerouteWithinSite | Load_Balance | RerouteWithinSite | SITE_WIDE | 3s |
| UDR | Nudr_dm | Load_Balance | RerouteWithinSite | Load_Balance | RerouteWithinSite | REGIONAL | 3s |
| CHF | Nchf_SpendingLimitControl | Load_Balance | RerouteWithinSite | Load_Balance | RerouteWithinSite | SITE_WIDE | 3s |
| UDM | Nudm_sdm | Load_Balance | RerouteWithinSite | Load_Balance | RerouteWithinSite | SITE_WIDE | 3s |
| UDM | Nudm_uecm | Load_Balance | RerouteWithinSite | Load_Balance | RerouteWithinSite | SITE_WIDE | 3s |
| PCF | Npcf_AMPolicyControl | Load_Balance | RerouteWithinSite | Load_Balance | RerouteWithinSite | SITE_WIDE | 3s |
| PCF | Npcf_UEPolicyControl | Load_Balance | RerouteWithinSite | Load_Balance | RerouteWithinSite | SITE_WIDE | 3s |
| AUSF | Nausf_UEAuthentication | Load_Balance | RerouteWithinSite | Load_Balance | RerouteWithinSite | SITE_WIDE | 3s |
| BSF | Nbsf_management | Load_Balance | RerouteWithinSite | Load_Balance | RerouteWithinSite | SITE_WIDE | 1s |
| UDR | Nudr_udrService | Load_Balance | RerouteWithinSite | Load_Balance | RerouteWithinSite | SITE_WIDE | 3s |
Topology 3 NF Profiles
The following table describes NF profile configuration, traffic, and message call flows for 280 NF profiles registered on SCP:
Table 3-9 NF Profiles
| NF-C | NF-P | Interfaces | Supported Services | Service-related traffic | NF Range | Profiles Registered | Message Call Flows |
|---|---|---|---|---|---|---|---|
| AMF | PCF | N15 |
|
|
30 | PCF1 to PCF30 |
Npcf_AMPolicyControl
Npcf_UEPolicyControl
|
| SMF | PCF | N7 |
|
npcf-smpolicycontrol | 30 | PCF1 to PCF30 |
|
| SMF | UDM | N10 |
|
|
3 | UDM1 to UDM3 |
Nudm_sdm
Nudm_uecm
|
| AMF | UDM | N8 |
|
|
6 | UDM6 to UDM12 |
Nudm_sdm
Nudm_uecm
|
| PCF | UDR | N36 |
|
nudr-dr | 24 | UDR1 to UDR24 |
|
| PCF | CHF | N28 |
|
nchf-spendinglimitcontrol | 6 | CHF1 to CHF6 |
|
| SMF | CHF | N40 |
|
nchf-convergedcharging | 6 | CHF1 to CHF6 |
|
| AMF | AUSF | N12 |
|
nausf-auth | 6 | AUSF1 to AUSF6 | Authenticate UE |
| PCF | BSF | Nbsf | nbsf-management | nbsf-management | 6 | BSF1 to BSF6 |
|
| NRF | SLF | - | nudr-group-id-map | nudr-group-id-map | 6 | SLF1 to SLF6 | SLF Look up |
3.4 Model C Testcases
This section provides information about SCP Model C testcases.
This test scenario describes the performance and capacity of SCP with Model C and provides the benchmarking results with latency in a network.
3.4.1 Model C Testcase Summary
The following table provides a summary of the benchmark tests.
Table 3-10 Benchmark Testcase Summary
| Benchmark Testcase Number | Description |
|---|---|
| Model C - Testcase Scenario 1 | The Model C test with message feed enabled with 2 trigger points, 110K MPS at SCP and 110K MPS towards OCNADD. |
| Model C - Testcase Scenario 2 | The Model C test is based on the network latency of 150 milliseconds at the rate of 620K MPS with rate limit applied, ASM (Service Mesh) enabled. |
| Model C - Testcase Scenario 3 | The Model C test is based on the network latency of 150 milliseconds at the rate of 640K MPS with rate limit applied and no ASM. |
3.4.2 Model C - Testcase Scenario 1
In Model C testcase scenario, the Message Feed feature is enabled with two trigger points, 110K MPS at SCP, and 110K MPS towards Oracle Communications Network Analytics Data Director (OCNADD).
Objective
This testcase scenario describes the performance and capacity of SCP with Model C. It provides benchmarking results with latency in a network, and no rate limit is applied to the ingress and egress traffic.
Table 3-11 Input Parameter Details
| Input Parameter Details | Configuration Values |
|---|---|
| Duration of Test | 12 Hours |
| SCP Version Tag | 24.1.0 |
| Cluster | Test Bed 3 - CNE on Bare Metal. For more information, see Cluster Details. |
| Topology | Topology 2. For information about topology, see Test Topology 2 for SCP Model C Benchmarking with SBI Message Feed. |
Testcase Parameters
The following table describes the testcase parameters and their values:
Table 3-12 Testcase Parameters
| Input Parameter Details | Configuration Values |
|---|---|
|
Maximum SCP system wide traffic rate (in MPS) |
110K MPS for SCP and 110K MPS towards OCNADD. |
| Network deployment diagram | Topology 2. For information about topology, see Test Topology 2 for SCP Model C Benchmarking with SBI Message Feed. |
| Mode of Network deployment (Model-C or Model-D) | Model C |
| Number of NFs deployed in the network which SCP is supposed to learn (number of NF Profiles) | 8 |
| NF Status Information |
|
| NF Profile - Priority, Capacity, and Load value same in all services of same kind? (Yes, No) | No |
| LAN latency in intra-SCP services and 5G NF communication (between SCP data and control plane services, SCP and other NFs ) in millisecond | 150 milliseconds |
| WAN latency in SCP services and 5G NF communication (SCP to NFs in other regions) in millisecond | 150 milliseconds |
| Number of SCP ingress IPs configured | 1 |
| How many connections per published IP/FQDN producers can handle? | 68 |
| Per Egress connection max traffic in MPS | 1000 |
| How many connections consumer can initiate towards per SCP IP? | 119 |
| Per Ingress connection max traffic in MPS | 1000 |
| Average Request and Response message size |
|
| Percentage of alternate routed requests to NF due to any reason (2% to 5%) | 2% |
| Configured audit interval and audit mode |
|
| Number of NRFs and NRF Sets deployed in the network | NA |
| Response time (latency) from NRF (NRF processing time) | 150 milliseconds |
| Delegated Discovery Traffic Information | NA |
| NF Discovery response size and Info | NA |
| Egress and Ingress Configurations | NA |
| Mediation Configurations | NA |
| Mediation Trigger point configuration | NA |
| Secured HTTPs connection - % of message on HTTPs? | NA |
| DNS SRV configuration and response time | NA |
| Roaming traffic details | NA |
| Pods deployed |
|
| SCP Worker Pod Profile | 8 vCPU and 12 Gi Memory |
| Oracle Communications Network Analytics Data Director Configurations |
|
| LCI Configurations | NA |
| Processing latency(processing time) per producer NF | Upstream Network Latency: 150 milliseconds |
| OAuth Traffic Rate | NA |
| OCI Configurations | NA |
Result and Observation
The performance test observation data shown in the following table can be used to conduct benchmark testing to raise the traffic rate:
Table 3-13 Result and Observation
| Parameter | Values |
|---|---|
| Test Duration | 12 Hours |
| MPS Achieved | 110K MPS |
| Average MPS per scp-worker pod | 5.88K MPS |
| Success rate | ~ 99.98 % |
| Average SCP processing time (Request and Response) | ~25 milliseconds for both Request and Response processing |
SCP Microservices and their Utilization
The following table describes SCP microservices and their utilization:
Table 3-14 SCP Microservices and their Utilization
| SCP Microservices | CPU | Memory | ||
|---|---|---|---|---|
| Max | Avg | Max | Avg | |
| scp-cache | 0.0103 | 0.0061 | 0.92 | 0.92 |
| scp-load-manager | 0.0184 | 0.0112 | 0.68 | 0.67 |
| scp-worker | 2.496 | 2.464 | 3.68 | 3.48 |
| scpc-audit | 0.0064 | 0.0047 | 0.55 | 0.556 |
| scpc-configuration | 0.0147 | 0.0108 | 0.59 | 0.58 |
| scpc-notification | 0.0404 | 0.0370 | 1.21 | 1.20 |
| scpc-subscription | 0.034 | 0.0322 | 0.48 | 0.47 |
Observed Values of cnDBTier Services
Table 3-15 Observed Values of cnDBTier Services
| cnDBTier Services | Value |
|---|---|
| CPU usage of data nodes | 0.385% |
| Memory usage of data nodes | 3.61% |
| Read operations per second | 4.36 seconds |
| Write operations per second | 0.001 seconds |
| Transaction rates on data nodes | 1.112 |
3.4.3 Model C - Testcase Scenario 2
The Model C test is based on the network latency of 150 milliseconds at the rate of 620K MPS with a rate limit applied and ASM (Service Mesh) enabled.
Objective
This testcase scenario describes the performance and capacity of SCP with Model C. It provides benchmarking results with latency in a network, and no rate limit is applied to the ingress and egress traffic.
Table 3-16 Input Parameter Details
| Input Parameter Details | Configuration Values |
|---|---|
| Duration of Test | 12 Hours |
| SCP Version Tag | 23.3.1 |
| Cluster | Test Bed 4 - CNE on Bare Metal. For more information, see Cluster Details. |
| Topology | Topology 3. For information about topology, see Test Topology 3 for SCP Model C Benchmarking. |
Testcase Parameters
The following table describes the testcase parameters and their values:
Table 3-17 Testcase Parameters
| Input Parameter Details | Configuration Values |
|---|---|
|
Maximum SCP system wide traffic rate (in MPS) |
620K MPS |
| Network deployment diagram | Topology 3. For information about topology, see Test Topology 3 for SCP Model C Benchmarking. |
| Mode of Network deployment (Model-C or Model-D) | Model C |
| Number of NFs deployed in the network which SCP is supposed to learn (number of NF Profiles) | 280 |
| NF Status Information |
|
| NF Profile - Priority, Capacity, and Load value same in all services of same kind? (Yes, No) | No |
| LAN latency in intra-SCP services and 5G NF communication (between SCP data and control plane services, SCP and other NFs ) in millisecond | 150 milliseconds |
| WAN latency in SCP services and 5G NF communication (SCP to NFs in other regions) in millisecond | 150 milliseconds |
| Number of SCP ingress IPs configured | 1 |
| How many connections per published IP/FQDN producers can handle? | 260 |
| Per Egress connection max traffic in MPS | 1000 |
| How many connections consumer can initiate towards per SCP IP? | 455 |
| Per Ingress connection max traffic in MPS | 1000 |
| Average Request and Response message size |
|
| Percentage of alternate routed requests to NF due to any reason (2% to 5%) | 2% |
| Configured audit interval and audit mode |
|
| Number of NRFs and NRF Sets deployed in the network |
|
| Response time (latency) from NRF (NRF processing time) | 150 milliseconds |
| Delegated Discovery Traffic Information | NA |
| NF Discovery response size and Info | NA |
| Egress and Ingress Rate Limit Configurations |
|
| Mediation Configurations | NA |
| Mediation Trigger point configuration | NA |
| Secured HTTPs connection - % of message on HTTPs? | NA |
| DNS SRV configuration and response time |
|
| Roaming traffic details | NA |
| Pods deployed |
|
| SCP Worker Pod Profile | 12 vCPU and 16 Gi Memory |
| Oracle Communications Network Analytics Data Director Configurations |
|
| LCI Configurations |
|
| Processing latency(processing time) per producer NF | Upstream Network Latency: 150 milliseconds |
| OAuth Traffic Rate | NA |
| OCI Configurations | NA |
Result and Observation
The performance test observation data shown in the following table can be used to conduct benchmark testing to raise the traffic rate:
Table 3-18 Result and Observation
| Parameter | Values |
|---|---|
| Test Duration | 12 Hours |
| MPS Achieved | 620K MPS |
| Average MPS per scp-worker pod | 9.5K MPS |
| Success rate | 100 % |
| Average SCP processing time (Request and Response) | Less than 25 milliseconds for both Request and Response processing |
SCP Microservices and their Utilization
The following table describes SCP microservices and their utilization:
Table 3-19 SCP Microservices and their Utilization
| SCP Microservices | CPU/Pod | Memory/Pod | CPU/Pod Sidecar | Memory/Pod Sidecar | ||||
|---|---|---|---|---|---|---|---|---|
| Max | Avg | Max | Avg | Max | Avg | Max | Avg | |
| scp-worker | 6.75 | 5.63 | 5.29 GB | 4.70 GB | 4.17 | 3.89 | 653 MB | 573 MB |
| scp-nrfproxy | NA | NA | NA | NA | NA | NA | NA | NA |
| scpc-notification | 0.999 | 0.960 | 2.13 GB | 2.13 GB | 0.307 | 0.295 | 286 MB | 273 MB |
| scpc-audit | 0.00982 | 0.00686 | 672 MB | 672 MB | 0.0371 | 0.0183 | 261 MB | 248 MB |
| scpc-configuration | 0.0678 | 0.0573 | 766 MB | 764 MB | 0.0614 | 0.0487 | 281 MB | 268 MB |
| scpc-subscription | 0.0391 | 0.0350 | 488 MB | 487 MB | 0.0303 | 0.0170 | 248 MB | 235 MB |
| scp-cache | 0.965 | 0.888 | 1.19 GB | 1.19 GB | 0.266 | 0.0197 | 238 MB | 225 MB |
| scp-load-manager | 0.456 | 0.0702 | 1.53 GB | 1.53 GB | 0.845 | 0.00948 | 240 MB | 228 MB |
| scpc-alternate-resolution | 0.0133 | 0.0112 | 1.39 GB | 1.39 GB | 0.0277 | 0.0121 | 238 MB | 225 MB |
Observed Values of cnDBTier Services
Table 3-20 Observed Values of cnDBTier Services
| cnDBTier Services | Value |
|---|---|
| Memory usage of data nodes | 0.5% |
| CPU usage of data nodes | 0.7% |
| Write operations per second | 0.9 seconds |
| Read operations per second | 69 seconds |
| Transaction rates on data nodes | 1.6 |
3.4.4 Model C - Testcase Scenario 3
The Model C test is based on the network latency of 150 milliseconds at the rate of 640K MPS with rate limit applied and no ASM.
Objective
This testcase scenario describes the performance and capacity of SCP with Model C. It provides benchmarking results with latency in a network, and rate limit is applied to the ingress and egress traffic.
The following table describes test bed configurations:
Table 3-21 Input Parameter Details
| Input Parameter Details | Configuration Values |
|---|---|
| Duration of Test | 12 Hours |
| SCP Version Tag | 24.1.0 |
| Cluster | Test Bed 4 - CNE on Bare Metal. For more information, see Cluster Details. |
| Topology | Topology 3. For information about topology, see Test Topology 3 for SCP Model C Benchmarking. |
Testcase Parameters
The following table describes the testcase parameters and their values:
Table 3-22 Testcase Parameters
| Input Parameter Details | Configuration Values |
|---|---|
| Maximum SCP system wide traffic rate (in MPS) | 640K MPS |
| Network deployment diagram | Topology 3. For information about topology, see Test Topology 3 for SCP Model C Benchmarking. |
| Mode of Network deployment (Model-C or Model-D) | Model C |
| Number of NFs deployed in the network which SCP is supposed to learn (number of NF Profiles) | 280 |
| NF Status Information |
|
| NF Profile - Priority, Capacity, and Load value same in all services of same kind? (Yes, No) | No |
| LAN latency in intra-SCP services and 5G NF communication (between SCP data and control plane services, SCP and other NFs ) in millisecond | 150 milliseconds |
| WAN latency in SCP services and 5G NF communication (SCP to NFs in other regions) in millisecond | 150 milliseconds |
| Number of SCP ingress IPs configured | 1 |
| How many connections per published IP/FQDN producers can handle? | 260 |
| Per Egress connection max traffic in MPS | 1000 |
| How many connections consumer can initiate towards per SCP IP? | 190 |
| Per Ingress connection max traffic in MPS | 1000 |
| Average Request and Response message size |
|
| Percentage of alternate routed requests to NF due to any reason (2% to 5%) | 2% |
| Configured audit interval and audit mode |
|
| Number of NRFs and NRF Sets deployed in the network |
|
| Response time (latency) from NRF (NRF processing time) | 150 milliseconds |
| Delegated Discovery Traffic Information | NA |
| NF Discovery response size and Info | NA |
| Egress and Ingress Rate Limit Configurations |
|
| Mediation Configurations | NA |
| Mediation Trigger point configuration | NA |
| Secured HTTPs connection - % of message on HTTPs? | NA |
| DNS SRV configuration and response time |
|
| Roaming traffic details | NA |
| Pods deployed |
|
| SCP Worker Pod Profile | 12 vCPU and 16 Gi Memory |
| Oracle Communications Network Analytics Data Director Configurations | NA |
| LCI Configurations |
|
| Processing latency(processing time) per producer NF | Upstream Network Latency: 150 milliseconds |
| OAuth Traffic Rate | NA |
| OCI Configurations |
|
Result and Observation
The performance test observation data shown in the following table can be used to conduct benchmark testing to raise the traffic rate:
Table 3-23 Result and Observation
| Parameter | Values |
|---|---|
| Test Duration | 12 Hours |
| MPS Achieved | 640K MPS |
| Average MPS per scp-worker pod | 16K MPS |
| Success rate | 100 % |
| Average SCP processing time (Request and Response) | Less than 25 milliseconds for both Request and Response processing |
SCP Microservices and their Utilization
The following table describes SCP microservices and their utilization:
Table 3-24 SCP Microservices and their Utilization
| SCP Microservices | CPU/Pod | Memory/Pod | ||
|---|---|---|---|---|
| Max | Avg | Max | Avg | |
| scp-worker | 9.36 | 8.59 | 9.64 GB | 9.44 GB |
| scp-nrfproxy | NA | NA | NA | NA |
| scpc-notification | 0.752 | 0.715 | 1.65 GB | 1.65 GB |
| scpc-audit | 0.0178 | 0.00677 | 604 MB | 604 MB |
| scpc-configuration | 0.0419 | 0.0344 | 769 MB | 768 MB |
| scpc-subscription | 0.0643 | 0.0499 | 821 MB | 820 MB |
| scp-cache | 0.775 | 0.695 | 921 MB | 917 MB |
| scp-load-manager | 0.402 | 0.0629 | 1.48 GB | 1.48 GB |
| scpc-alternate-resolution | 0.0175 | 0.0107 | 749 MB | 746 MB |
Observed Values of cnDBTier Services
The following table provides information about observed values of cnDBTier services:
Table 3-25 Observed Values of cnDBTier Services
| cnDBTier Services | Value |
|---|---|
| Memory usage of data nodes | 0.6% |
| CPU usage of data nodes | 0.7% |
| Write operations per second | 1 second |
| Read operations per second | 69 seconds |
| Transaction rates on data nodes | 2.8 |