2 Installing OSO
Note:
OSO 24.3.0 is an installation only release. OSO does not support upgrade from 24.2.x and 24.1.x to 24.3.0- All the required OSO images, including opensource software as a tar file.
- All the required OSO Helm charts.
- The following custom values.yaml files:
ocoso_csar_24_3_1_0_0_prom_custom_values.yamlis used for configuring the Prometheus parametersocoso_csar_24_3_1_0_0_alm_custom_values.yamlis used for configuring the Alertmanager parameters.
Note:
The README doc contains details to populate mandatory values in theocoso_csar_24_3_1_0_0_prom_custom_values.yamlandocoso_csar_24_3_1_0_0_alm_custom_values.yamlfiles. For more information about the configuration parameters, see OSO Configuration Parameters.
2.1 Prerequisites
Before installing and configuring OSO, ensure that the following prerequisites are met:
- CSAR package is downloaded.
- Unzip and TAR utilities are installed.
- Docker or Podman is installed, and you must be able to run the docker or podman commands.
- Helm is installed with the minimum supported Helm version (v3.15.2).
- kubectl is installed.
- A central repository is made available for all images, binaries, helm charts, and so on, before running this procedure.
- The following images are populated in the registry on the repo
server:
occne.io/oso/prometheus:v2.52.0occne.io/oso/alertmanager:v0.27.0occne.io/oso/configmapreload:v0.13.0occne.io/occne/24_3_common_oso:24.3.1
All the above images are packed into tar format and will be present in OSO CSAR under (Artifacts/Images) folder. You can use the following commands to load these images into your cluster's registry.$ docker/podman load -i <image-name>.tar $ docker/podman tag <image-url> <registry-address>:<port>/image-url $ docker/podman push <registry-address>:<port>/image-url
2.2 Resource Utilization
The use of resources such as CPU and RAM by the OSO services are constrained to ensure that the CPU and RAM do not consume excess resources that could be used by other applications.
During the deployment of the services, each service gets an initial CPU and RAM allocation. Each service is allowed to consume the resources to a specified upper limit while it continues to run. The initial allocation limit and the upper limit are set to the same value for services where the resource consumption limit remains the same as the initial allocation or in a case where increasing the CPU or RAM limits underneath a running application can cause service disruption. The resource requests and limits are as follows:
Table 2-1 CPU and RAM Resource Requests and Limits
| Service | CPU Initial Request(m) | CPU Limit(m) | RAM Initial Request(Mi) | RAM Limit(Mi) | Instances |
|---|---|---|---|---|---|
| Prometheus | 2000 | 2000 | 4096 | 4096 | 2 |
| Prometheus AlertManager | 20 | 20 | 64 | 64 | 2 |
The overall observability services resource usage varies on each worker node. The observability services listed in the table are distributed evenly across all worker nodes in the Kubernetes cluster.
2.3 Installing OSO Using CSAR
Open Network Automation Platform (ONAP) compliant orchestrator uses CSAR format to onboard, validate, and install OSO. However, in the absence of an orchestrator, manual installation is possible using the CSAR file contents.
- Download the OSO CSAR zip file from My Oracle Support (MOS).
- Extract the CSAR zip
file:
$ unzip <OSO CSAR package> - Upload all the artifacts present in the
Artifacts/Imagesfolder to the configured repository. For more information about the artifacts, see the Prerequisites section. - From 24.3.0 onwards, the
existing
ocoso_csar_24_3_1_0_0_custom_values.yamlfile is split into two different files:ocoso_csar_24_3_1_0_0_prom_custom_values.yamlis used for configuring the Prometheus parametersocoso_csar_24_3_1_0_0_alm_custom_values.yamlis used for configuring the Alertmanager parameters.
Artifacts/Imagesdirectory with the required values as mentioned in OSO Configuration Parameters. - Enable IPv6 Dualstack.
- To enable IPv6 DualStack in
Prometheus
- Enable IPv6 Dualstack in the
ocoso_csar_24_3_1_0_0_prom_custom_values.yaml. Search for the following comment in the yaml file and uncomment the following four lines after this comment.# Custom section to enable IPV6, Uncomment below section in order to enable Dualstack OSO having both Ipv4 and Ipv6 addresses #ipFamilies: #- IPv4 #- IPv6 #ipFamilyPolicy: PreferDualStack - Change the service type from ClusterIP to LoadBalancer to assign IPv6.
- Save the file and proceed with the normal installation.
- Enable IPv6 Dualstack in the
- To enable IPv6 DualStack in
AlertManager Replace "ENABLE_DUAL_STACK" with
"true" in below section inside the
ocoso_csar_24_3_1_0_0_alm_custom_values.yamlfile before installing alertmanager.# ip dual stack ipDualStack: enabled: ENABLE_DUAL_STACK ipFamilies: ["IPv6", "IPv4"] ipFamilyPolicy: "PreferDualStack"
- To enable IPv6 DualStack in
Prometheus
- Save the file and proceed with the normal installation.
- Install OSO using the following steps:
- Extract the Helm charts tgz file available in the
Artifacts/Scriptsdirectory.$ cd Artifacts/Scripts $ tar -xvzf ocoso_csar_24_3_1_0_0_alertmanager_charts.tgz $ tar -xvzf ocoso_csar_24_3_1_0_0_prometheus_charts.tgz - Install Prometheus and Alertmanager using Helm charts provided
and updated
ocoso_csar_24_3_1_0_0_prom_custom_values.yamlandocoso_csar_24_3_1_0_0_alm_custom_values.yamlfile with the following command.Use the following command for installation using Helm, if custom labels are given:
$ kubectl create namespace <deployment-namespace-name>
$ helm install -f <ocoso_csar_24_3_1_0_0_prom_custom_values.yaml> --namespace=<deployment-namespace-name> --name-template=<deployment-name> ./prometheus
$ helm install -f <ocoso_csar_24_3_1_0_0_alm_custom_values.yaml> --namespace=<deployment-namespace-name> --name-template=<deployment-name> ./alertmanager
For example:
$ kubectl create namespace ns1
## Prometheus
$helm install -f ocoso_csar_24_3_1_0_0_prom_custom_values.yaml --namespace=ns1 --name-template=oso-p ./ocoso_csar_24_3_1_0_0_prometheus_charts.tgz
##  Alertmanager
$ helm install -f ocoso_csar_24_3_1_0_0_alm_custom_values.yaml --namespace=ns1 --name-template=oso-a ./ocoso_csar_24_3_1_0_0_alertmanager_charts.tgz
Note:
Skip the flag (--disable-openapi-validation) if custom labels aren't given. - Run the following commands to bring Prometheus up in the
Prometheus GUI.
- Take a backup of current
configmapfor restoration.$ kubectl -n <oso-namespace> get cm <oso-prom-configmap-name> -oyaml > prom-cm-backup.yamlFor example:
[cloud-user@occne4-xyz-bastion-1 Scripts]$ o get cm oso-p-prom-svr -oyaml > prom-backup.yaml [cloud-user@occne4-xyz-bastion-1 Scripts]$ [cloud-user@occne4-xyz-bastion-1 Scripts]$ [cloud-user@occne4-xyz-bastion-1 Scripts]$ ls -lrth prom-backup.yaml -rw-------. 1 cloud-user cloud-user 5.5K Apr 3 18:48 prom-backup.yaml - Take a copy of the current
configmapfor further modifications.$ kubectl -n <oso-namespace> get cm <oso-prom-configmap-name> -oyaml > /tmp/prom-cm.yamlFor example:
[cloud-user@occne4-xyz-bastion-1 Scripts]$ o get cm oso-p-prom-svr -oyaml > /tmp/oso-p-cm.yaml [cloud-user@occne4-xyz-bastion-1 Scripts]$ [cloud-user@occne4-xyz-bastion-1 Scripts]$ ls -lrth /tmp/oso-p-cm.yaml -rw-------. 1 cloud-user cloud-user 5.5K Apr 3 18:48 /tmp/oso-p-cm.yaml - Add the
metrics_pathin Prometheus job.$ sed -i '/ job_name: prometheus/a \ \ \ \ \ \ metrics_path: /<cluster-name-prefix>/prometheus/metrics' /tmp/prom-cm.yamlFor example:
[cloud-user@occne4-xyz-bastion-1 Scripts]$ sed -i '/ job_name: prometheus/a \ \ \ \ \ \ metrics_path: /cluster1/prometheus/metrics' /tmp/oso-p-cm.yaml - Verify if the
metrics_pathwas applied appropriately in Prometheus job.$ cat /tmp/prom-cm.yaml | grep metrics_path: -A 2 -B 2For example:
[cloud-user@occne4-xyz-bastion-1 Scripts]$ cat /tmp/oso-p-cm.yaml | grep metrics_path: -A 2 -B 2 scrape_configs: - job_name: prometheus metrics_path: /cluster1/prometheus/metrics static_configs: - targets: - Replace the existing OSO Prometheus configmap
(
oso-p-prom-svrtaken as example here) as shown below:$ kubectl -n <oso-namespace> replace configmap <oso-prom-configmap-name> -f /tmp/prom-cm.yamlFor example:
[cloud-user@occne4-xyz-bastion-1 Scripts]$ o replace configmap oso-p-prom-svr -f /tmp/oso-p-cm.yaml configmap/oso-p-prom-svr replaced - Verify if the
metrics_pathis updated correctly in the OSO prometheus configmap.$ $ kubectl -n <oso-namespace> get cm <oso-prom-configmap-name> -oyaml | grep metrics_path: -A 2 -B 2 scrape_configs: - job_name: prometheus metrics_path: /<cluster-name-prefix>/prometheus/metrics static_configs: - targets:For example:
[cloud-user@occne4-xyz-bastion-1 Scripts]$ o get cm oso-p-prom-svr -oyaml | grep metrics_path: -A 2 -B 2 scrape_configs: - job_name: prometheus metrics_path: /cluster1/prometheus/metrics static_configs: - targets: - Open Prometheus GUI and verify if the Target is up or not under Status→Targets.
- Take a backup of current
- Run the following command to perform a Helm
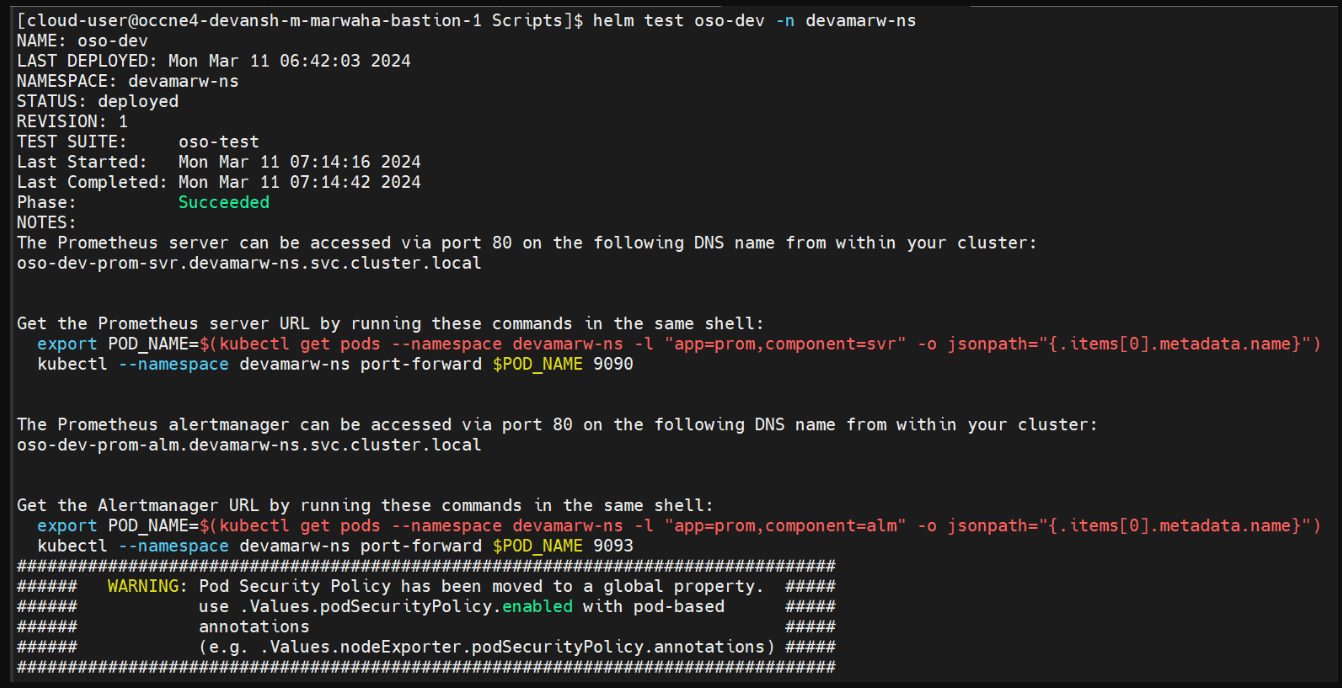
test. Populate the values in the
ocoso_csar_24_3_1_0_0_prom_custom_values.yamlandocoso_csar_24_3_1_0_0_alm_custom_values.yamlfiles to run the Helm test.$ helm test <release-name> -n <namespace>Note:
Helm Test can be run for the first time smoothly, but if some issue occurs, and there's a need to re-run the helm test, first you will have to delete the existing test job and repeat the "helm test" command as shown above.$ kubectl get jobs.batch -n <namespace>$ kubectl delete jobs.batch oso-test -n <namespace>Figure 2-1 Helm Test
- Extract the Helm charts tgz file available in the
2.4 Postinstallation Tasks
This section explains the postinstallation tasks for OSO.
2.4.1 Verifying Installation
To verify if OSO is installed:
- Run the following command to verify the OSO
version.
helm ls -n <oso-namespace>For example:
helm ls -n oso-nameSample output:NAME NAMESPACE REVISION UPDATED STATUS CHART APP VERSION oso oso 3 2024-03-27 18:06:42.575679972 +0000 UTC deployed prometheus-15.16.1 24.1.0 - Run the following commands to verify if pods are up and
running:
$ kubectl get pods --namespace <deployment-namespace-name>For example:
$ kubectl get pods -n occne-infraSample output:NAME READY STATUS RESTARTS AGE oso-prom-alm-0 2/2 Running 0 14h oso-prom-alm-1 2/2 Running 0 14h oso-prom-svr-84c8c7d488-qsnvx 2/2 Running 0 14h - Run the following commands to verify if services are up and running and
are assigned an EXTERNAL-IP (if LoadBalancer is being
used):
$ kubectl get service --namespace <deployment-namespace-name>For example:$ kubectl get service -n occne-infraSample output:NAME TYPE CLUSTER-IP EXTERNAL-IP PORT(S) AGE oso-prom-alm ClusterIP 10.233.16.83 <none> 80/TCP 14h oso-prom-alm-headless ClusterIP None <none> 80/TCP,6783/TCP 14h oso-prom-svr ClusterIP 10.233.46.136 <none> 80/TCP 14h - Verify that all the GUIs are accessible.
Note:
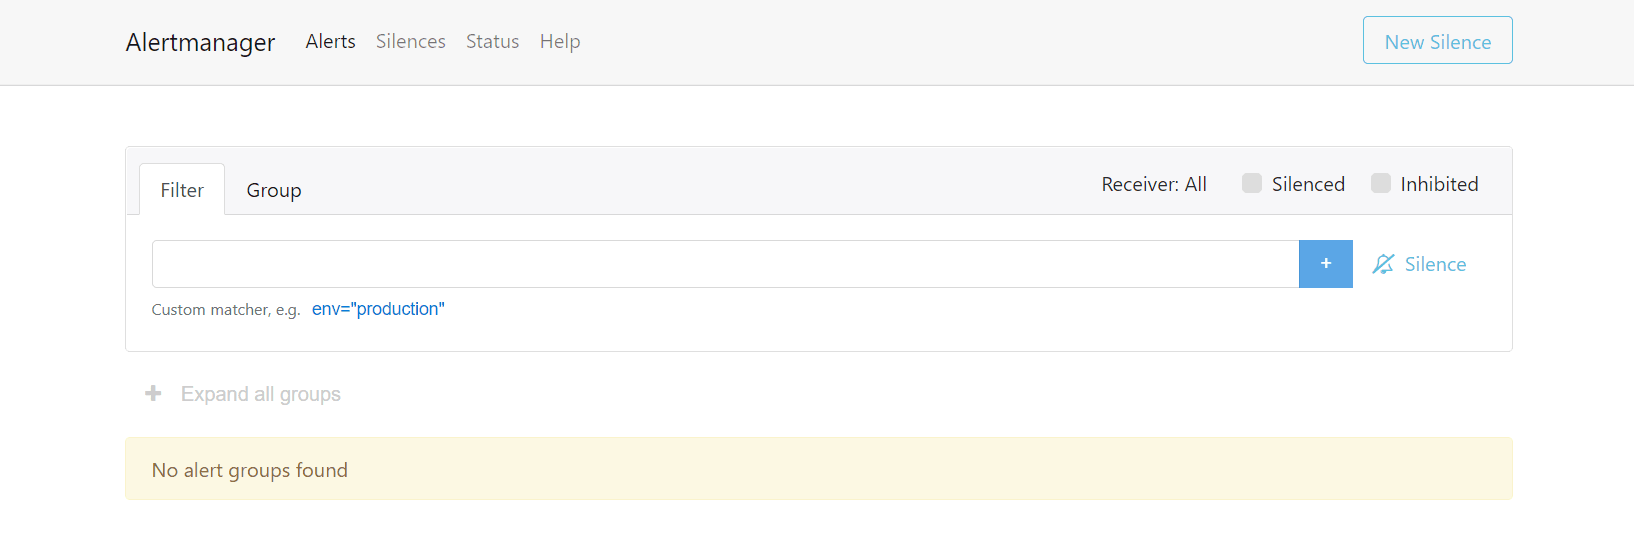
Prometheus and Alertmanager GUIs can be accessed only using the CNC Console. For more information about accessing Prometheus and Alertmanager GUIs using CNC Console, see Oracle Communications Cloud Native Configuration Console User Guide.If the service is of type LoadBalancer, use EXTERNAL-IP to open the Prometheus GUI. Refer to Step 2 to get the services and their EXTERNAL-IPs.
Example to access service IP address with output:
# kubectl get nodes -o wide
NAME     STATUS   ROLES    AGE   VERSION   INTERNAL-IP     EXTERNAL-IP   OS-IMAGE                  KERNEL-VERSION                  CONTAINER-RUNTIME
master   Ready    master   87d   v1.17.1   10.75.226.13    <none>        Oracle Linux Server 7.5   4.1.12-112.16.4.el7uek.x86_64   docker://19.3.11
slave1   Ready    <none>   87d   v1.17.1   10.75.225.177   <none>        Oracle Linux Server 7.5   4.1.12-112.16.4.el7uek.x86_64   docker://19.3.11
slave2   Ready    <none>   87d   v1.17.1   10.75.225.47    <none>        Oracle Linux Server 7.5   4.1.12-112.16.4.el7uek.x86_64   docker://19.3.11
# kubectl get service -n ocnrf NAME TYPE CLUSTER-IP EXTERNAL-IP PORT(S) AGE oso-prom-alm ClusterIP 10.103.63.10 <none> 80/TCP 35m oso-prom-alm-headless ClusterIP None <none> 80/TCP 35m oso-prom-svr ClusterIP 10.101.91.81 <none> 80/TCP 35mNote:
In case Dualstack with IPv6 is enabled, change the service type to LoadBalancer in the custom values file. You can see both IPs when calling thekubectl get servicecommand, and the output is as follows:[root@master Scripts]# kubectl get service -n ocnrf NAME TYPE CLUSTER-IP EXTERNAL-IP PORT(S) AGE oso-prom-alm LoadBalancer 10.103.63.10 10.75.202.205,2606:b400:605:b809::2 80/TCP 35m oso-prom-alm-headless ClusterIP None <none> 80/TCP 35m oso-prom-svr LoadBalancer 10.101.91.81 10.75.202.204,2606:b400:605:b809::1 80/TCP 35mFigure 2-2 Prometheus GUI

Figure 2-3 Alert Manager GUI
- On the Prometheus GUI, click Alerts to verify
that all the alerts (NF Alerts) are visible.
Note:
OSO Prometheus doesn't have any alerts of its own, therefore the GUI must appear empty initially. You can patch any NF alert rules in this section.The following image displays the alerts for cnDBTier:
Figure 2-4 Prometheus GUI
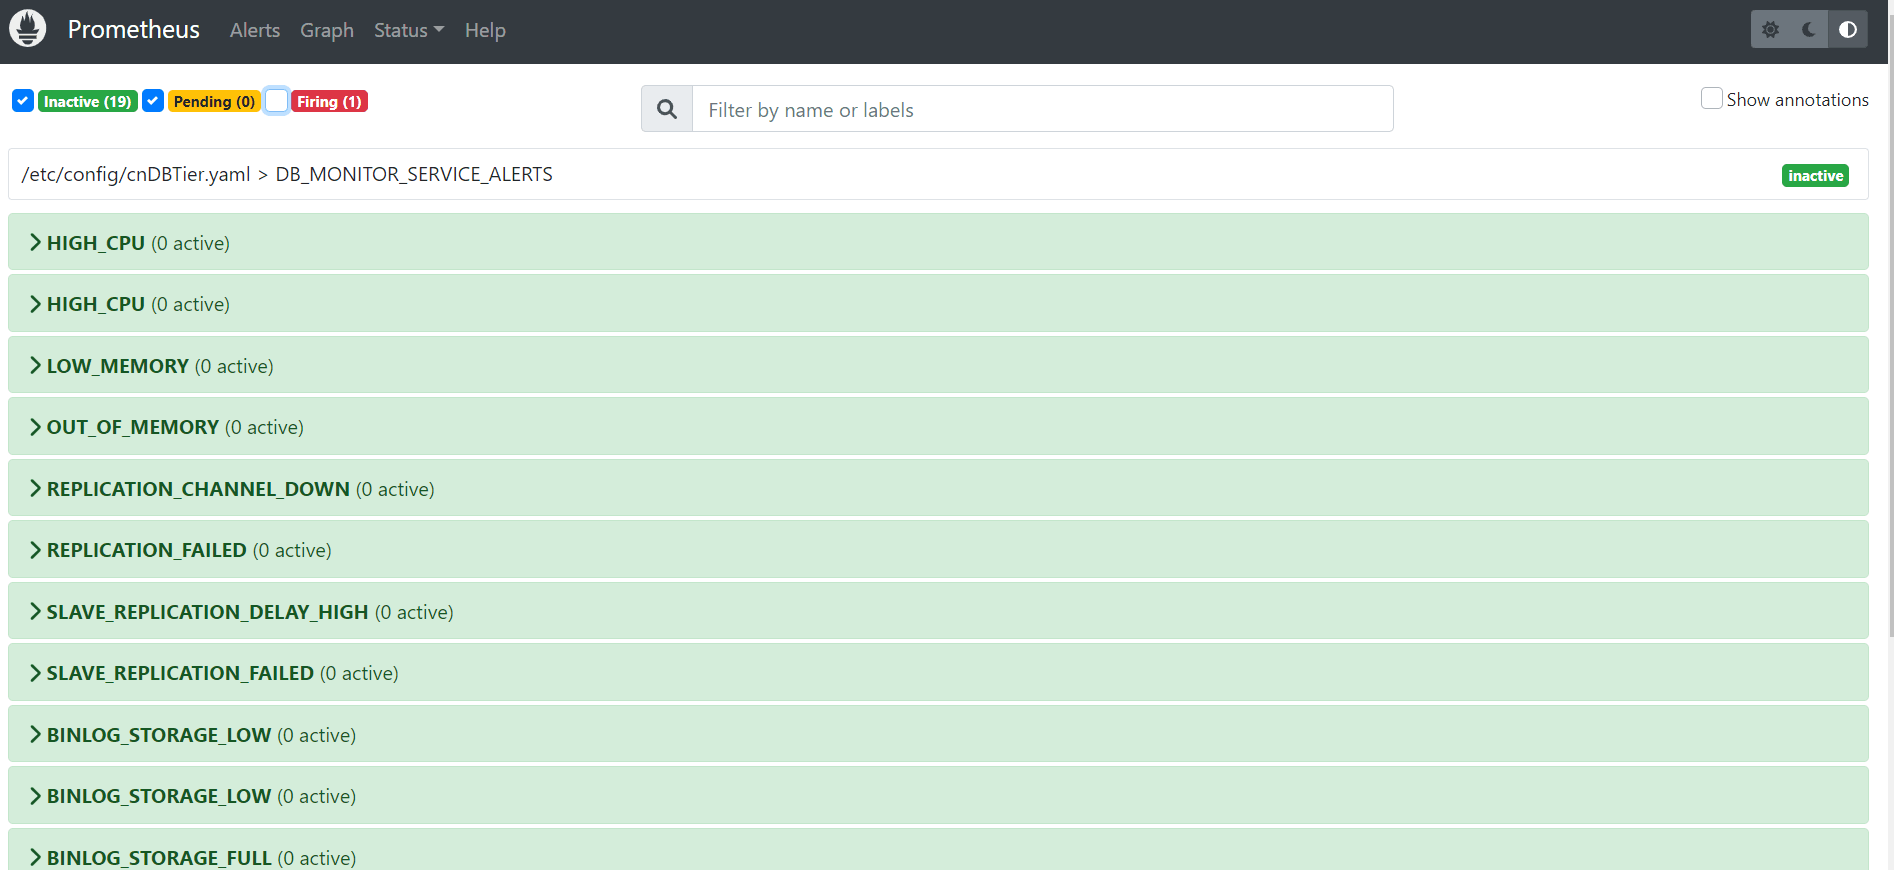 After alerts are raised, the GUI must display the triggered alerts as shown in the following image:
Figure 2-5 Prometheus GUI - Alerts

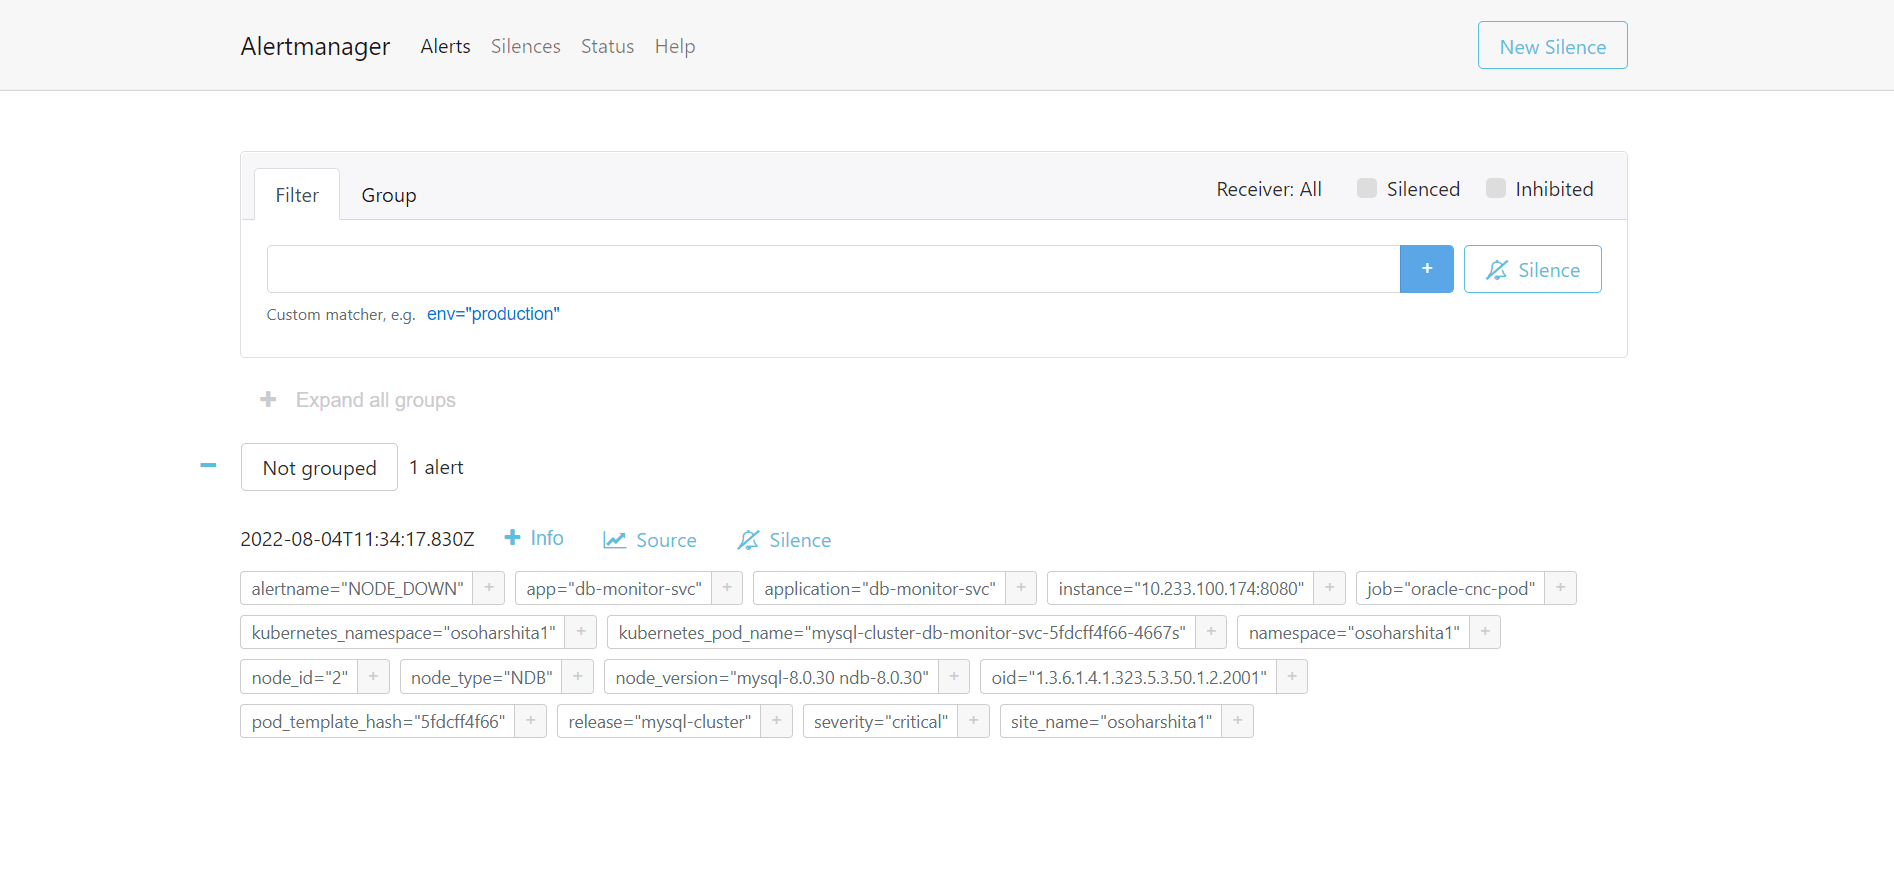
- Select Alerts tab on the Alertmanager GUI to
view the triggered alerts as shown in the following image:
Figure 2-6 Alertmanager - Alerts
- On the Prometheus GUI, click Graph to verify if the expected
metrics (example, NF Metrics) are displayed. The following image displays a sample
Prometheus Graph with metrics:
Figure 2-7 Prometheus Graph

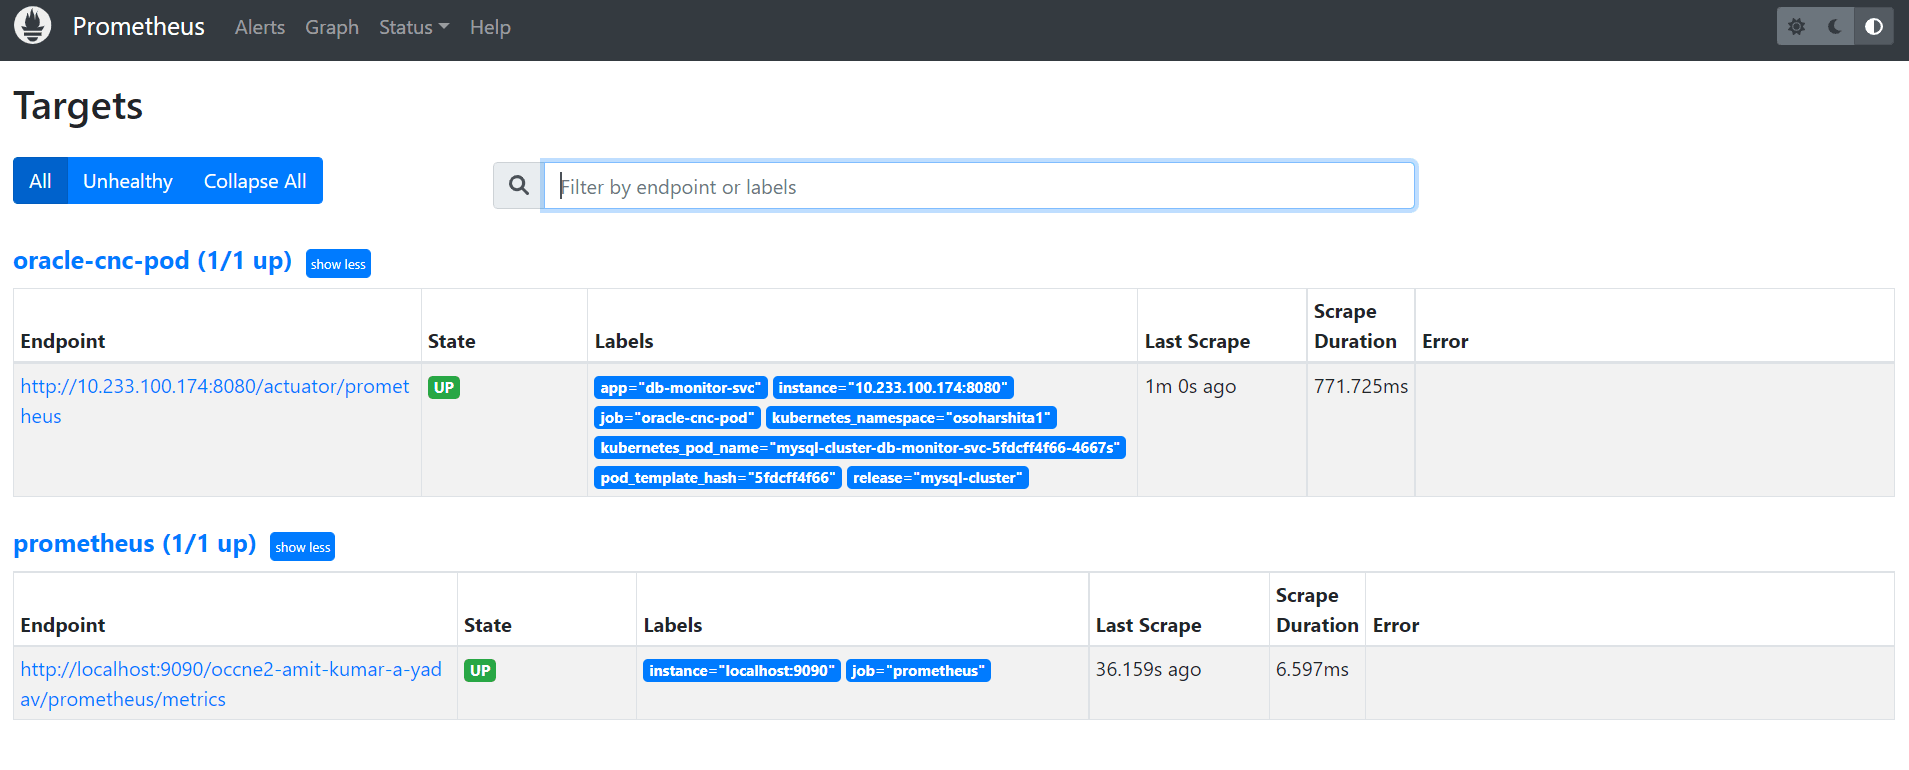
- On the Prometheus GUI, navigate to Status and
then click Target to verify if the configured targets are
displayed.
The following image shows Prometheus targets that are being extracted:
Figure 2-8 Prometheus Target
Note:
Post installation, Prometheus can be vertically scaled to add more resources to an existing Prometheus server for load balancing. For more information about, Prometheus vertical scaling, see Prometheus Vertical Scaling.