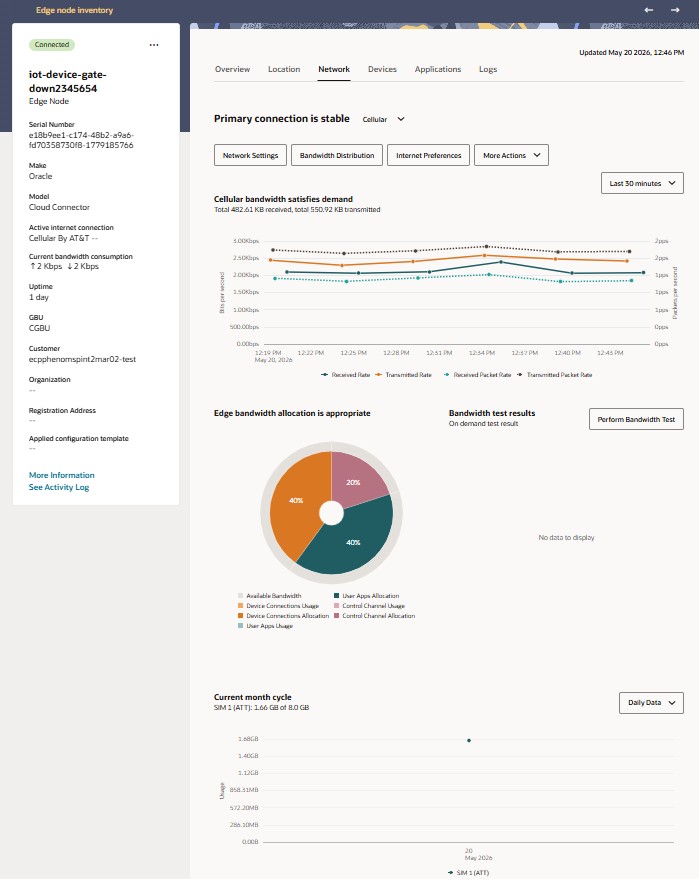
Edge Nodes Details Page - Network Tab
The Network Tab on the Oracle ECP Edge Node Details Page displays information about each active network interface on your Cloud Connector. It is important that you start using the page by selecting the target interface with the Interface Chooser. The page then updates to show the context and relevant information for your selected interface.
The left panel displays standard identifying information about this Cloud Connector. This pane lists which WAN interface is in use, and carrier information about the WAN link if applicable. You can view an additional grouping of information about this Cloud Connector by selecting the More Information link in the left pane which opens the More Information drawer for review.
On the Network tab, use the network interface chooser to select the interface that you want to review or update. The interface chooser lists available WAN and LAN interfaces and icons that indicate their connectivity status. When you select an interface, Oracle ECP displays graphs, configuration buttons, and details for that interface.
Configuration controls on the Network tab are organized into two groups. The always-visible controls provide quick access to configuration tasks that are relevant to the selected interface, such as network settings, bandwidth distribution, or internet preferences. Additional global actions that apply broadly to the edge node, rather than only to the selected interface, are available from the More Actions menu.
Table 7-1 Graph Availability by Network Interface
| Interface Type | Graphs |
|---|---|
| Cellular Network Interface - WAN |
|
| Satellite Network Interface - WAN |
Available views:
|
| Broadband Network Interface - WAN |
|
| Ethernet Network Interface - LAN |
|
| Wi-Fi Network Interface - LAN |
|
- The bandwidth demand graph displays the currently chosen interface's throughput measured in packets per second and bits per second throughput for both inbound and outbound traffic. The time scale of this graph is selectable with the period drop-down list.
- Daily charts aggregate usage across both SIMs where applicable.
- Dual-SIM devices display separate monthly usage charts for each SIM.
- Monthly charts display usage history across the last 11 months and indicate allowance thresholds and over-utilization states.
- Chart subtitles display subscribed data allowance values and actual usage totals.
- Hovering over graph legends highlights the corresponding trend line.
- Clicking a graph legend shows or hides the selected data on the graph.
- Hovering over a graph point displays detailed data for that point.