7 The Monitor and Trace Tab Display and Operations
The Monitor and Trace tab displays links to tools that help you see system and session data on the Oracle® Enterprise Session Border Controller (ESBC). The Monitor and Trace link provides summary reports that include session data, ladder diagrams of call and media flows, and Quality of Service statistics.
Topics:
Monitor and Trace
The Monitor and Trace tab displays the results of filtered SIP session data from the Oracle® Enterprise Session Border Controller in categorical lists. Each of the lists displays the results in a common log format for local viewing, which you can export as HTML and text files.
When you click the Monitor and Trace tab, the Web GUI displays links to the available lists in the navigation pane and defaults to Sessions. In the white space below the list, the GUI displays the total number of entries in the list and the numbers of the entries currently in view. The counter is dynamic and changes the enumeration as you scroll through the list. The following screen capture shows the Monitor and Trace default display.

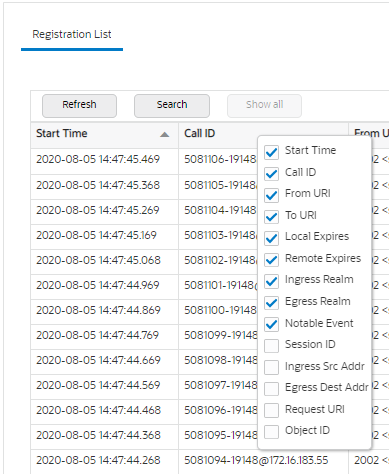
Each summary provides sorting, searching, paging, and exporting functionality, as well as a ladder diagram view where you can see a session summary, session details, and QoS statistics. You can choose which columns that you want each summary list to display by right clicking any column header and selecting column names from the pop-up list. The available column names vary according to the list type.
- On systems with less than 4GB of RAM,
the system can store:
- 50 messages
- 2,000 sessions
- On systems with more than 4GB of RAM,
the system can store:
- 50 messages
- 4,000 sessions
The system can perform live paging from Monitor and Trace tables.
Note:
Only one user at a time can view Monitor and Trace information. Monitor and Trace does not support multiple, simultaneous viewers.SIP Monitor and Trace for Ingress and Egress Messages
SIP Monitor and Trace operations allow the Oracle® Enterprise Session Border Controller (ESBC) to monitor SIP sessions in your network. The system processes SIP Monitor and Trace data on incoming messages first, and then sends the data out on outgoing messages. This process allows the ESBC to capture SIP Monitor and Trace data for display in the Web GUI.
The ESBC captures a SIP message in ingress, applies the Header Manipulation Rules (HMR) that you configured, and applies the Session Plug-in Language (SPL). When the ESBC sends the message on egress, the ESBC applies the SPL, applies the HMR, and sends out the captured SIP message.

SIP Sessions Summary
The SIP Sessions Summary summarizes all logged call sessions on the Oracle® Enterprise Session Border Controller (ESBC). The columns that display on the Sessions Summary page depend on the columns that you specified in the "Customizing the Page Display" procedure.
The following table describes the columns on the SIP Session Summary page.
| Start Time | Timestamps of the first SIP message in the call session. |
| State | Status of the call or media session. Valid values
are:
INITIAL—Session for which an INVITE or SUBSCRIBE was forwarded. EARLY—Session that received the first provisional response (1xx other than 100). ESTABLISHED—Session for which a success (2xx) response was received. TERMINATED—Session that ended by receiving or sending a BYE for an “Established” session or forwarding an error response for an “Initial” or "Early" session. The session remains in the terminated state until all the resources for the session are freed up. FAILED—Session that failed due to a 4xx or 5xx error code. |
| Call ID | Identification of the call source. Includes the phone number and source IP address. |
| Request URI | Uniform Resource Identifier (URI) formatted string that identifies a resource by way of a protocol, name, location, and any other applicable characteristic that is sent by the ESBC in REQUEST headers. |
| From URI | URI formatted string that identifies the call source information. |
| To URI | URI formatted string that identifies the call destination information. |
| Ingress Realm | Name of the inbound realm. |
| Egress Realm | Name of the outbound realm. |
| Duration | Amount of time, in seconds, that the call or media event was active. |
| Notable Event | Indicates if a notable event has occurred on the call session. Valid values
are:
Short Session—Sessions that do not meet a minimum configurable duration threshold. Session dialogue, captured media information, and termination signaling. Any event flagged as a short session interesting event. Local Rejection—Sessions locally rejected at the ESBC for any reason, for example, Session Agent (SA) unavailable, no route found, SIP signaling error, and so on. Session dialogue, capture media information, and termination signaling. Any event flagged as a local rejection interesting event. |
| Session ID | Identification assigned to the call session. |
| Ingress Src Addr | Source IP address of the incoming call or media event. |
| Egress Dest Addr | Destination IP address of the outgoing call or media event. |
| Calling Pkts | Number of calling packets. |
| Called Pkts | Number of called packets. |
| Calling R | Calling packets R-Factor calculation. |
| Called R | Called packets R-Factor calculation. |
| Calling MOS | Calling packets Mean Opinion Score (MOS) calculation. |
| Called MOS | Called packets Mean Opinion Score (MOS) calculation. |
| Ingress Src Port | Source port of the incoming call or media event. |
| Object ID | ID number of the object in a row. Use to aid troubleshooting. |
SIP Registrations Summary
The SIP Registrations Summary displays a summary of all logged SIP registrations sessions on the Oracle® Enterprise Session Border Controller (ESBC). The columns that display on the Registrations Summary page depend on the columns you selected in the "Customizing the Page Display" procedure.
The following table describes the columns available on the Registrations Summary page.
| Start Time | Timestamp of the first SIP message in the call session. |
| Call ID | Identification of the call source. Includes the phone number and source IP address. |
| From URI | URI formatted string that identifies the call source information. |
| To URI | URI formatted string that identifies the call destination information. |
| Local Expires | The current setting for the expiration of a registration request sent from the Integrated Media Gateway (IMG) to a Remote SIP User Agent. Default: 3600 seconds. |
| Remote Expires | The current setting for the expiration of a registration request sent from the Remote SIP User Agent to the Integrated Media Gateway (IMG). Default: 3600 seconds. |
| Ingress Realm | Incoming realm name. |
| Egress Realm | Outgoing realm name. |
| Notable Event | Indicates a notable event that occurred on the call
session. Valid value:
local rejection - Sessions locally rejected at the E-SBC for any reason (for example, Session Agent (SA) unavailable, no route found, SIP signalling error, etc.); Session dialogue, capture media information and termination signalling; Any event flagged as a local rejection interesting event |
| Session ID | Identification assigned to the call session. |
| Ingress Src Addr | Source IP address of the incoming call or media event. |
| Egress Dest Addr | Destination IP address of the outgoing call or media event. |
| Request URI | Uniform Resource Identifier (URI) formatted string that identifies a resource with the protocol, name, location, and any other applicable characteristic. The SBC only sends the URI in REQUEST headers. |
| Object ID | ID number of the object in a row. Use to aid troubleshooting. |
SIP Subscriptions Summary
The SIP Subscriptions Report displays a summary of all logged SIP subscription sessions on the Oracle® Enterprise Session Border Controller (ESBC). The columns that display on the Subscription Report page depend on the columns you selected in the "Customizing the Page Display" procedure.
The following table describes the columns on the Subscriptions Report page.
| Start Time | Timestamps of the first SIP message in the call session. |
| Call ID | Identification of the call source. Includes the phone number and source IP address. |
| From URI | URI formatted string that identifies the call source information. |
| To URI | URI formatted string that identifies the call destination information. |
| Events | Specific subscribe event package that was sent from an endpoint to the
destination endpoint. Applicable event packages include the following:
Conference—Event package that allows users to subscribe to a conference Uniform Resource Identifier (URI). Consent—pending additions - Event package used by SIP relays to inform user agents about the consent-related status of the entries to be added to a resource list. Dialog—Event package that allows users to subscribe to another user, and receive notifications about the changes in the state of the INVITE-initiated dialogs in which the user is involved. Message—summary - Event package that carries message-waiting status and message summaries from a messaging system to an interested User Agent (UA). Presence—Event package that conveys the ability and willingness of a user to communicate across a set of devices. A presence protocol is a protocol for providing a presence service over the Internet or any IP network. Reg—Event package that provides a way to monitor the status of *all* the registrations for a particular Address of Record (AoR). Refer—Event package that provides a mechanism to allow the party sending the REFER to be notified of the outcome of a referenced request. Winfo—Event package for watcher information. It tracks the state of subscriptions to a resource in another package. Vvq-rtcpx—Event package that collects and reports the metrics that measure quality for RTP sessions. |
| Expires | The current setting for the expiration of a registration request. Default: 3600 sec. |
| Ingress Realm | Incoming realm name. |
| Egress Realm | Outgoing realm name. |
| Notable Event | Indicates that a notable event occurred on the call session. Valid value is:
local rejection - Sessions locally rejected at the ESBC for any reason (for example, Session Agent (SA) unavailable, no route found, SIP signaling error); Session dialogue, capture media information and termination signaling; Any event flagged as a local rejection interesting event |
| Session ID | Identification assigned to the call session. |
| State | Status of the call or media session. Valid values are:
INITIAL—Session for which an INVITE or SUBSCRIBE was forwarded. EARLY—Session that received the first provisional response (1xx other than 100). ESTABLISHED—Session for which a success (2xx) response was received. TERMINATED—Session that ended by receiving or sending a BYE for an “Established” session or forwarding an error response for an “Initial” or "Early" session. The session remains in the terminated state until all the resources for the session are freed up. FAILED—Session unsuccessful due to a 4xx or 5xx error code. |
| Ingress Src Addr | Source IP address of the incoming call or media event. |
| Egress Dest Addr | Destination IP address of the outgoing call or media event. |
| Request URI | Uniform Resource Identifier (URI) formatted string that identifies a resource by way of a protocol, name, location, and any other applicable characteristic, and is sent by the ESBC in REQUEST headers. |
| Object ID | ID number of the object in a row. Use to aid troubleshooting. |
SIP Notable Events Summary
The SIP Notable Events Summary contains all logged sessions that have a notable event on the Oracle® Enterprise Session Border Controller (ESBC) associated with the session. The columns that display on the Notable Events Summary page depend on the columns that you selected in the "Customizing the Page Display" procedure.
The following table describes the columns that Notable Events Summary page can display.
| Start Time | Timestamp of the first SIP message in the call session. |
| State | Status of the call or media event session. Valid
values:
INITIAL—Session for which an INVITE or SUBSCRIBE was forwarded. EARLY—Session received the first provisional response (1xx other than 100). ESTABLISHED—Session for which a success (2xx) response was received. TERMINATED—Session that has ended by receiving or sending a BYE for an “Established” session or forwarding an error response for an “Initial” or Early session. The session remains in the terminated state until all the resources for the session are freed up. FAILED Session that has failed due to a 4xx or 5xx error code. |
| Call ID | Identification of the call source. Includes the phone number and source IP address. |
| Request URI | Uniform Resource Identifier (URI) formatted string that identifies a resource through a protocol, name, location, and any other applicable characteristic, and is sent by the ESBC in REQUEST headers. |
| From URI | URI formatted string that identifies the call source information. |
| To URI | URI formatted string that identifies the call destination information. |
| Ingress Realm | Name of the inbound realm. |
| Egress Realm | Name of the outbound realm. |
| Notable Event | Indicates if a notable event has occurred on the
call session. Valid values:
short session—Sessions that don’t meet a minimum configurable duration threshold; Session dialogue, captured media information and termination signalling; Any event flagged as a short session interesting event. local rejection—Sessions locally rejected at the ESBC for any reason (for example, Session Agent (SA) unavailable, no route found, SIP signalling error, etc.); Session dialogue, capture media information and termination signaling; Any event flagged as a local rejection interesting event. |
| Session ID | Identification assigned to the call session. |
| Ingress Src Addr | Source IP address of the incoming call or media event. |
| Ingress Src Port | Source port of the incoming call or media event. |
| Egress Dest Addr | Destination IP address of the outgoing call or media event. |
| Object ID | ID number of the object in a row. Use to aid troubleshooting. |
Ladder Diagrams and Display Controls
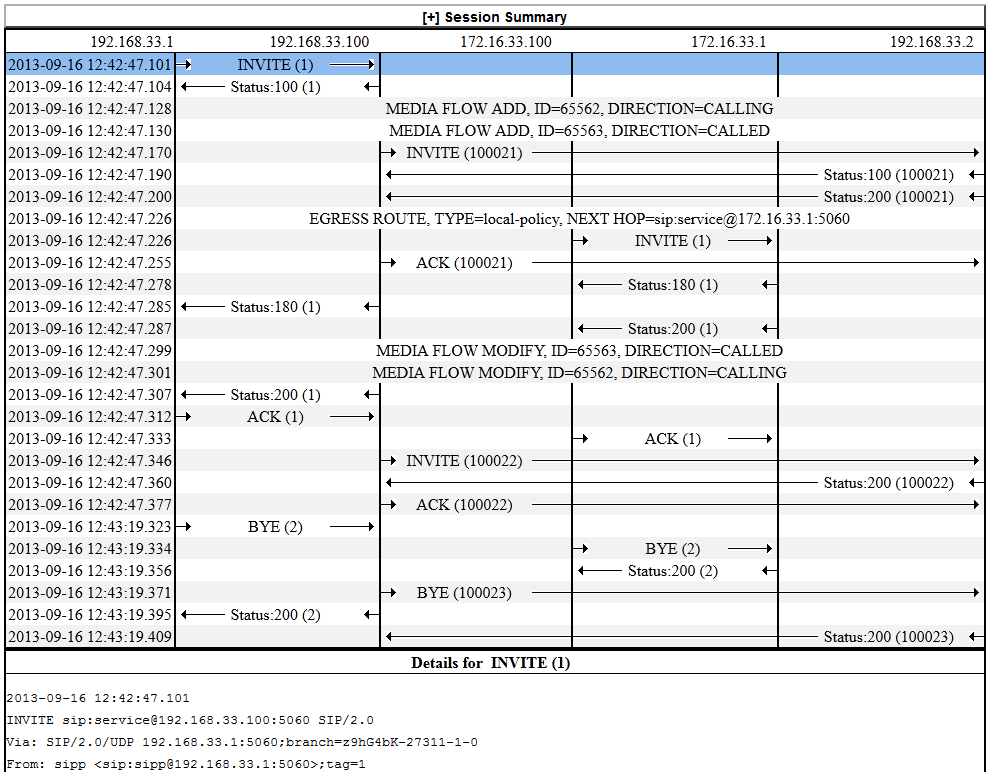
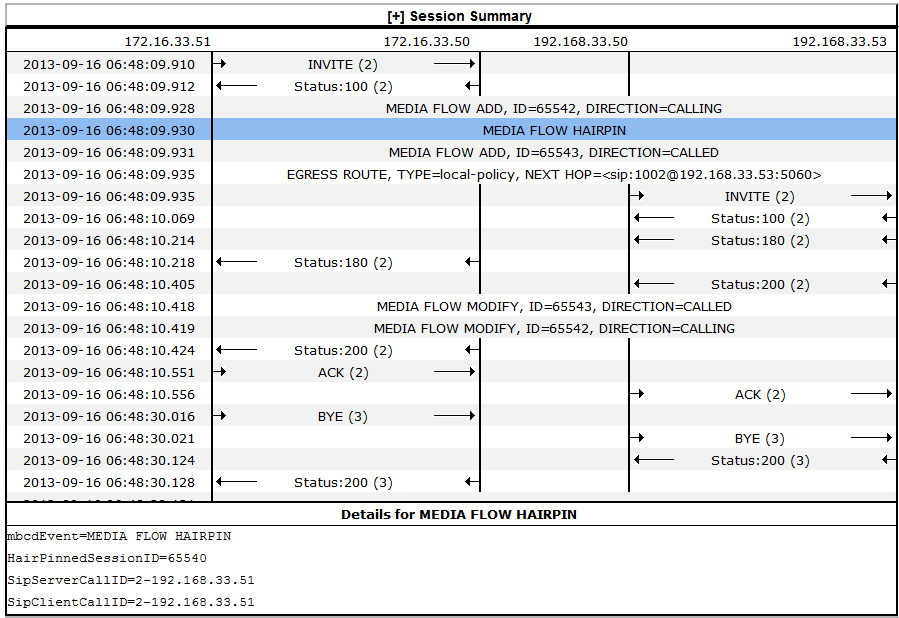
A ladder diagram is a graphical representation of the flow of call and media packets on ingress and egress routes through the Oracle® Enterprise Session Border Controller (ESBC). Viewing ladder diagrams can help you with troubleshooting and system monitoring. The Web GUI can display ladder diagrams for each of the summary reports available through Monitor and Trace.
The ESBC can store up to 4,000 calls on a system with more than 4GB of memory and up to 2,000 calls on a system with less than 4GB of memory. A ladder diagram can display an unlimited number of rows, but the relationship of calls to rows is inverse. The more rows you see per call, the fewer calls the ESBC can display. You cannot set the number of rows displayed.
Note:
You can also right-click a row and click Ladder Diagram on the pop-up menu or click the ellipses at the beginning of a row and click Ladder Diagram on the pop-up menu.The following illustration shows a sample ladder diagram with notations about the controls for viewing and exporting.
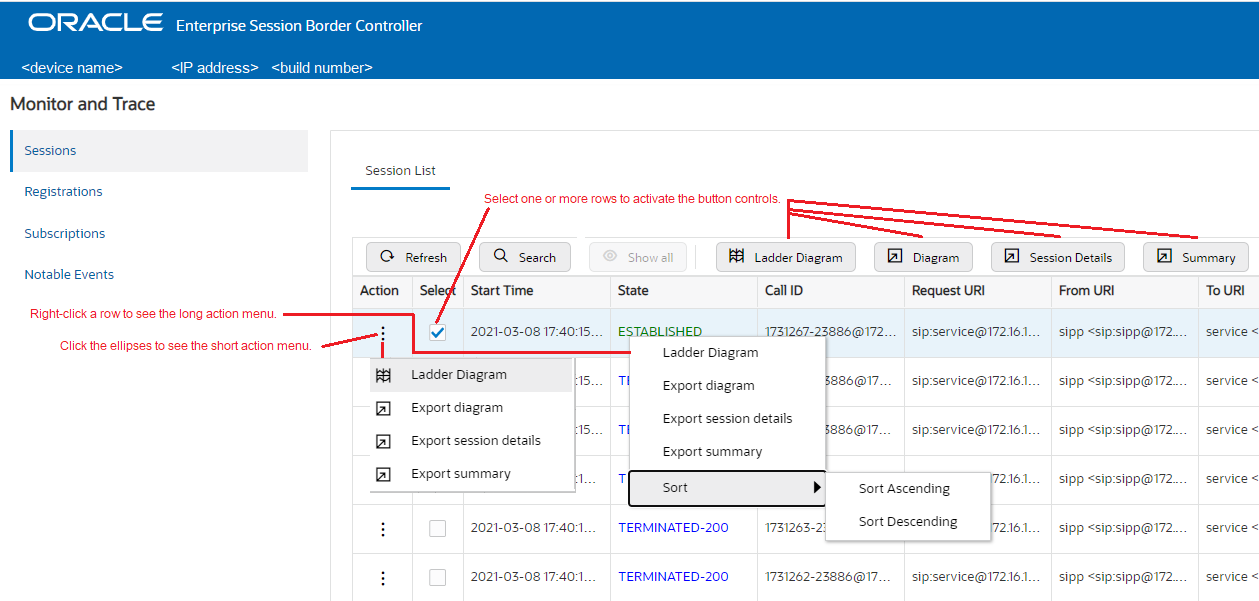
Ladder diagrams contain the following sections.
Session Summary—Displays session data. Use the [+] and [-] controls to toggle between show and hide. The default is hide.
Ladder Diagram—Displays SIP message and call flow information. Hover over a line in the ladder diagram to see more information about the highlighted flow.
QoS Stats—Displays Quality of Service (QoS) information. Use the [+] and [-] controls to toggle between show and hide. The default is hide. You must enable Quality of Service (QoS) on your system to see the QoS Statistics information.
The following screen capture shows an example of a ladder diagram as initially displayed with the Session Summary and QoS Stats sections hidden.

The following screen capture shows an example of an ESBC ladder diagram with the Session Summary and QoS sections expanded. This screen capture also shows an example of the pop-up that displays detailed SIP Message Details when you hover over a row in the diagram.
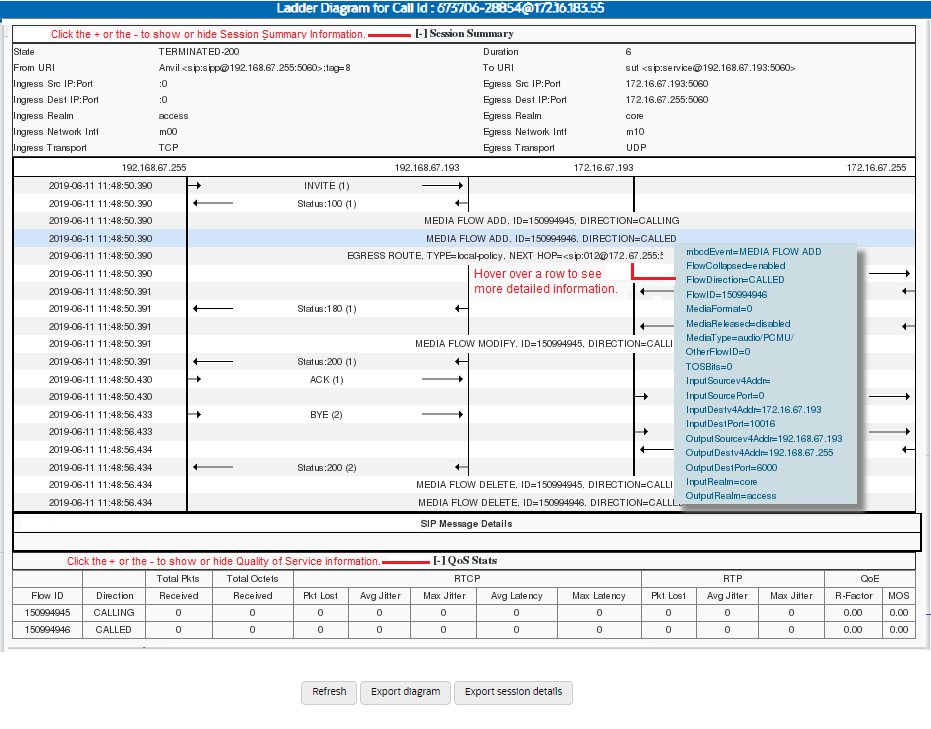
Note:
The ESBC captures SIP messages, applies the Header Manipulation Rules (HMR) that you configured on the ESBC, and applies the Session Plug-in Language (SPL) to that message. When the ESBC sends the message, it applies the SPL, the HMR, and sends the captured SIP message. When viewing the session detail on a Ladder Diagram, the HMR and SPL information may be present.Ladder Diagram Controls
Ladder diagrams display the following controls at the bottom of the page.
Refresh—Use to refresh the data in the ladder diagram.
Export diagram—Use to export the ladder diagram to an HTML file.
Export session details—Use to export the session details to a text file.
Close and Remove Ladder Diagram Tabs
To remove an individual tab you can either click the X on the tab or right-click and click Remove on the pop-up menu.
To remove all tabs, right-click a tab and click Close All on the pop-up menu.
Display a Ladder Diagram
You can display a ladder diagram of call and media flow data from the Sessions, Registrations, Subscriptions, and Notable events lists in Monitor and Trace. Each list page displays a table, where each row represents one session. You can view a ladder diagram for each session with the following procedure.
Session Summary
To see a Session Summary, open a ladder diagram from a record in a Summary report and click the [+] control that precedes "Session Summary" at the top of the page. Monitor and Trace displays the session data and statistics.

| State | Status of the call or media session. Valid values
are:
INITIAL—Session for which an INVITE or SUBSCRIBE was forwarded. EARLY—Session received the first provisional response (1xx other than 100). ESTABLISHED—Session for which a success (2xx) response was received. TERMINATED—Session that has ended by receiving or sending a BYE for an “Established” session or forwarding an error response for an “Initial” or Early session. The session remains in the terminated state until all the resources for the session are freed up. FAILED—Session that has failed due to a 4xx or 5xx error code. |
| Duration | Amount of time, in seconds, that the call or media session was active. |
| From URI | URI formatted string that identifies the call source information. |
| To URI | URI formatted string that identifies the call destination information. |
| Ingress Src IP:Port | Source IP address and port number of the incoming call or media session. |
| Egress Src IP: Port | Source IP address and port number of the outgoing call or media session. |
| Ingress Dest IP:Port | Destination IP address and port number of the incoming call or media session. |
| Egress Dest IP: Port | Destination IP address and port number of the outgoing call or media session. |
| Ingress Realm | Incoming realm name. |
| Egress Realm | Outgoing realm name. |
| Ingress Network Intf | Name of the incoming network interface on the Oracle® Enterprise Session Border Controller (ESBC). |
| Egress Network Intf | Name of the outgoing network interface on the ESBC. |
| Ingress Transport | Protocol type used on the incoming call or media session. Valid values are User Datagram Protocol (UDP) or Transport Control Protocol (TCP). |
| Egress Transport | Protocol type used on the outgoing call or media session. Valid values are User Datagram Protocol (UDP) or Transport Control Protocol (TCP). |
Display a Session Summary
You can view data and statistics about a call or media session by displaying the Session Summary from a ladder diagram.
- Under the Monitor and Trace
tab, select one of the following summaries:
- Sessions
- Registrations
- Subscriptions
- Notable Events
- On the Summary page, select a row in the table and right-click.
- On the pop-up menu, click Ladder Diagram.
- (Optional)—On the ladder diagram, click the [+] to expand the Session Summary section.
QoS Statistics
The Quality of Service (QoS) Stats section of the Session Summary displays information about the quality of the service for a selected call session or media event. To see the QoS statistics, open a ladder diagram from a record in a Summary report and click the [+] control that precedes "QoS Statistics" at the bottom of the page.
Expand QoS Stats section with the [+} control.

The following table describes each column in the QoS Stats report.
| Flow ID | ID number assigned to the call session or media event flow of data. |
| Direction | The direction of the call or media event flow.
CALLING—egress direction CALLED—ingress direction |
| Total Pkts Received | Total number of data packets received on the interface during the active call session or media event. |
| Total Octets Received | Total number of octets received on the interface during the active call session or media event. |
| RTCP | Real-time Transport Control Protocol—used to send control packets to participants in a call. |
| Pkts Lost | Number of RTCP data packets lost on the interface during the active call session or media event. |
| Avg Jitter | Average measure of the variability, called jitter, over time of the RTCP packet latency across a network. A network with constant latency has no jitter. Jitter is referred to as Packet Delay Variation (PDV). It is the difference in the one-way end-to-end delay values for packets of a flow. Jitter is measured in terms of a time deviation from the nominal packet inter-arrival times for successive packets. |
| Max Jitter | Maximum measure of the variability, called jitter, over time of the RTCP packet latency across a network. A network with constant latency has no variation jitter. |
| Avg Latency | Average observed one-way signaling latency during the active window period. This is the average amount of time the signaling travels in one direction. |
| Max Latency | Maximum observed one-way signaling latency during the sliding window period. This is the maximum amount of time the signaling travels in one direction. |
| RTP | Real-Time Transport Protocol—a standard packet format for delivering audio and video over the internet. |
| Pkts Lost | Number of RTP data packets lost on the interface during the active call session or media event. |
| Avg Jitter | Average measure of the variability, called jitter, over time of the RTP packet latency across a network. A network with constant latency has no jitter. Jitter is referred to as Packet Delay Variation (PDV). It is the difference in the one-way end-to-end delay values for packets of a flow. Jitter is measured in terms of a time deviation from the nominal packet inter-arrival times for successive packets. |
| Max Jitter | Maximum measure of the variability, called jitter, over the time of the RTP packet latency across a network. A network with constant latency has no jitter. |
| QoE | Quality of Experience—measurement used to determine how well the network is satisfying the end user's requirements. |
| R-Factor | Rating Factor—An average Quality of Service (QoS) factor observed during the active window period. QoS shapes traffic to provide different priority and level of performance to different data flows. R-Factors are metrics in VoIP that use a formula to take into account both user perceptions and the cumulative effect of equipment impairments to arrive at a numeric expression of voice quality. This statistic defines the call or transmission quality, which is expressed as an R factor. |
| MOS | Mean Opinion Score (MOS) score—MOS is a measure of voice quality. MOS provides a numerical indication of the perceived quality of the media received after being transmitted and eventually compressed using Codecs. |
Display QoS Statistics
- Under the Monitor and Trace
tab, select one of the following summaries:
- Sessions
- Registrations
- Subscriptions
- Notable Events
- On the Summary page, select a row in the table and right-click.
- On the pop-up menu, click Ladder Diagram.
- On the ladder diagram, click the [+] to expand the QoS Stats section.
Configure SIP Monitoring
You must enable SIP Monitoring and configure the options for displaying session data and notable event data on the Monitor and Trace page.
- Configure any filters that you want, if you don't want to monitor all SIP traffic. See "Filter Configuration."
The only required setting is State, which enables SIP Monitoring. You can optionally monitor all filters and you can specify one or more filters to monitor. You can specify a time for short session duration monitoring and you can configure interesting events to monitor.
- View the SIP Session Summary and SIP Notable Event Summary on the Monitoring tab.
Search for a Report Record
Use the Search button located above the report table to help you find a specific record in an Oracle® Enterprise Session Border Controller (ESBC) Monitor and Trace report. When you click Search, the Web GUI displays a dialog where you specify criteria for the search.
- If you specify the “*” character in a search string, the search is performed on that exact string. For example, if you search for “123*45”, the search shows results for all strings containing “123*45”.
- You can use quotes (“ “) to specify a search. For example, you can enter Smith and the search finds all of the records that match Smith, such as: John Smith field<sip:sipp@192.168.1.70:5070>;tag=12260SIPpTag001.
- When you enter a space before or after a quotation mark, (for example, “Smith “), the search returns no data.
Export Monitor and Trace Information to a Text File
Monitor and Trace allows you to export Monitor and Trace information to a text file from the Sessions, Registrations, Subscriptions, and Notable Events Reports.
- Select a row and click one of the export buttons displayed above the report list.
- Select a row, right click, and click an export operation on the menu.
- Click the ellipses on a row and click an export operation on the menu.
The following list describes the export commands.
| Diagram | Exports all of the information in the Ladder Diagram (Session Summary, SIP Message Details, and QoS statistics), to an HTML file format. |
| Session Details | Exports detailed information about the SIP messages and media events in the Ladder Diagram associated with the selected session, to a file in text format. |
| Summary | Exports all logged session summary records to a file in text format. |
