1 About MSS Operational Reports
Oracle Communications MetaSolv Solution (MSS) Operational Reports provides the vital business intelligence you need by giving you immediate access to critical information maintained within MetaSolv Solution through reports.
Each kit contains a set of reports for a specific area within the application.
MSS Operational Reports gives you the ability to customize data models and the reports. You can add new reports quickly using the supplied objects and filters, and a simple drag-and-drop interface makes it easy to create, modify, and filter reports. In addition, you can add calculations and queries to customize the data.
Oracle Communications Metasolv Solution (MSS) supports Oracle Business Intelligence Publisher (BI Publisher), which is the reporting standard for MSS. Through a separate, downloadable patch, MSS provides sample reports that you can run and customize within BI Publisher.
Support and Maintenance
MSS Operational Reports may be enhanced when new versions of the MetaSolv Solution data model are released. These enhancements are available to MetaSolv Solution users who have signed maintenance agreements. The enhancements may include any additional objects, filters, and reports for new data structures and new requirements.
Your MSS maintenance contract covers support for MSS Operational Reports, but you are required to license Business Intelligence Publisher (BI Publisher) separately.
Installing and Configuring BI Publisher
The following sections provide information on installing and configuring BI Publisher.
This document assumes you are familiar with BI Publisher and its documentation, which is available on the Oracle documentation website:
Installing BI Publisher
BI Publisher is not part of MSS Installer. To use BI Publisher for MSS reporting, you must install it manually.
BI Publisher is installed as part of Oracle Business Intelligence. So, to install BI Publisher, install Business Intelligence by following the instructions in Installing and Configuring Oracle Business Intelligence, located here:
https://docs.oracle.com/middleware/bi12214/lcm/BIEIG/toc.htm
Configuring BI Publisher
After you have successfully installed BI Publisher, you need to configure it by performing the tasks described in this section.
Getting Started
To get started with configuring BI Publisher, do the following:
-
Start the BI Publisher WebLogic server by following the instructions in Fusion Middleware User's Guide for Oracle Business Intelligence Publisher, located here:
https://docs.oracle.com/middleware/bi12214/bip/BIPUG/toc.htm -
Ensure you have privileges to log in to BI Publisher as an administrator.
Adding a Data Source and Establishing a Database Connection
To run reports against MSS data using BI Publisher, you must add MSS as a data source to BI Publisher and establish a database connection to MSS.
To add a data source and establish a database connection:
-
Log in to BI Publisher as an Administrator.
-
Follow the instructions for creating data sources in chapter Setting Up Data Sources of the Fusion Middleware Administrator's Guide for Oracle Business Intelligence Publisher, located here:
https://docs.oracle.com/middleware/bi12214/bip/BIPAD/toc.htm
Adding Users
To provide users with view access, BI Publisher offers several security options to provide access.
To add a user and a role, and assign the role to the user:
-
Log into BI Publisher as Administrator.
-
Determine the security model option to use from the administrator's overview. Follow the instructions for granting permissions in the Fusion Middleware Administrator's Guide for Oracle Business Intelligence Publisher, located here:
https://docs.oracle.com/middleware/bi12214/bip/BIPAD/toc.htm
Downloading and Installing the Sample Reports
This section provides information on downloading and installing the MSS sample reports, which are described later in this document.
Downloading the Sample Reports
The MSS sample reports are delivered in a separate ZIP file (MSSBIPubReports.zip), which you can download from My Oracle Support at:
Installing the Sample Reports
You can install the sample reports by using one of the following methods:
Copying the ZIP file to the BI Publisher Repository
To install the sample reports by copying the ZIP file to the BI Publisher Repository:
-
If you have not already done so, download the sample reports.
See "Downloading the Sample Reports" for more information.
-
Open the tempDir/MSSBIPubReports.zip file.
There are two kits:
- Service_RequestKit.zip
- Work_ManagementKit.zip
-
Extract the BIPubReports folder to the BIPublisher_HOME/repository/Reports directory.
-
Log in to BI Publisher.
-
In the upper right corner of the Home page, click the Catalog link.
The Catalog appears.
-
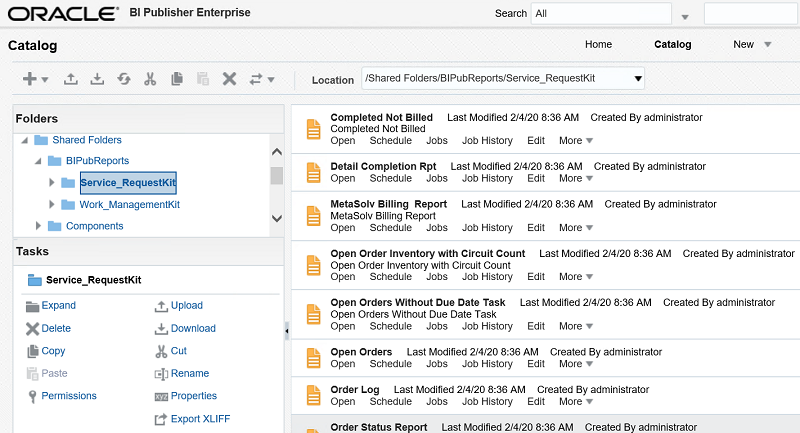
Expand Shared Folders, and select the BIPubReports folder.
The sample reports are located in the BIPubReports/Service_RequestKit and BIPubReports/Work_ManagementKit folder, as shown in Figure 1-1.
-
Change the data model file to point it to the data source you created earlier.
See "Changing the Data Model Source" for instructions.
Figure 1-1 Sample Reports in the BI Publisher Catalog
Description of "Figure 1-1 Sample Reports in the BI Publisher Catalog"
Note:
Regarding the BI Publisher Catalog, files in Shared Folders are accessible to other users, while files in My Folder are user-specific and are not accessible to other users.
Uploading the Sample Reports from within BI Publisher
To install the sample reports by uploading them from within BI Publisher:
-
Log in to BI Publisher.
-
In the upper right corner of the Home page, click the Catalog link.
The Catalog appears.
-
Select Shared Folder.
-
Create a new folder named BIPubReports/Service_RequestKit under Shared Folder.
-
Select the BIPubReports/Service_RequestKit folder.
-
Create a new folder named Data Models under BIPubReports/Service_RequestKit.
-
Select the BIPubReports/Service_RequestKit folder.
-
Click the Upload Resource icon.
The Upload dialog box appears.
-
Click Browse.
The Choose File to Upload window appears.
-
Navigate to tempDir/BIPubReports/Service_RequestKit.
-
Select an XDOZ file and click Open. (These are the report files.)
The Upload dialog box appears.
-
Click Upload.
-
Select the Data Models folder.
-
Click the Upload Resource icon.
The Upload dialog box appears.
-
Click Browse.
The Choose File to Upload window appears.
-
Navigate to tempDir/BIPubReports/Service_RequestKit/Data Models.
-
Select an XDMZ file and click Open. (These are the data model files.)
The Upload dialog box appears.
-
Click Upload.
-
The sample reports are located in the BIPubReports/Service_RequestKit folder, as shown in Figure 1-1.
-
Change the data model file to point it to the data source you created earlier.
See Changing the Data Model Source for instructions.
- Repeat the same steps for Work_ManagementKit.
Understanding the Sample Reports
This section describes the following sample reports:
Service Request Reporting Kit
This kit contains reports that are specific to service requests. The report is generated at the order level, and not at the detail level.
Table 1-1 lists the reports contained within this kit.
Table 1-1 Service Request Reporting Kit: Report Definitions and Potential Uses
| Report Name | Description | Potential Uses |
|---|---|---|
|
Completed Orders Not Billed |
Lists all the service requests that are complete but have not been sent to the billing system. |
Prevent revenue leakage by identifying unbilled service requests. |
|
Detail Circuit Completion |
Provides a summary of statistics, dates, and other details about service requests for a particular organization. This report includes all service request types. |
Track service requests by circuit IDs. |
|
MetaSolv Solution Billing Report |
Lists the service requests that have been modified. |
Identify items that may require a change in billing. This report is efficiently utilized in the batch mode by querying for service requests that have changed in the last 24 hours. However, you can run this report in the on-line mode. |
|
Open Order Inventory with Circuit Count |
Lists all the open service requests that are not due date complete. This report is grouped by receipt date and sectioned by month. A list of open service requests is displayed with all other open service requests received in the same month. The number of circuits on the service request is also included in this report. |
Track order inventory. Use this report as a starting point for tracking potential customer relations problems. |
|
Open Orders By Date |
Lists the open service requests for a given date range. This report is first sorted by work group, and then by task scheduled completion date. The report also generates counts for total service requests, service requests in a work group, and service requests in a work queue. |
Generate a work log or view past due or upcoming service requests. |
|
Open Orders without a Due Date Task |
Lists all the incomplete service requests that do not have a due date task. This report includes information about the service request and its associated tasks. |
Audit service requests that do not contain due date tasks. |
|
Order Log |
Provides a summary list of service requests, including ISR, LSR, and PSR data, and columns for organization, service type group, order number, and type of service request. The report also gives service request date information, including the received date, the due date, and the completion date. There is also a column that indicates if the due date was met. |
Based on user criteria/selection of Service Request Type, Circuit Status, and Task Actual Completion Date Range, view a summary of service requests and identify potential problem areas. |
|
Order Status |
Lists all the service requests that have a late DLRD or RID task. This report includes high-level order information and a list of circuits accompanying the service requests. |
Resolve potential customer complaints due to delays in circuit design. |
|
PON & RPON Mismatch |
Compares the purchase order number (PON) and the related purchase order number (RPON) and reports any differences found between the two values. |
Identify service requests that have differences between the PON and the RPON. |
|
Service Order Tracking |
Provides a tool for tracking the progress of service requests. This report includes information about ISR, LSR, and PSR. It includes columns for organization, service type group, order number, and the type of service request. |
Based on user criteria/selection of Service Request Type, identify problem areas with service requests. |
|
Service Request Tracking Summary Report |
Calculates the completion time for a service request that has been due date completed. |
Calculates the average process time for a service request. |
Work Management Reporting Kit
This kit contains reports that concentrate on the Work Management module in MetaSolv Solution.
Table 1-2 lists the reports contained within this kit.
Table 1-2 Work Management Reporting Kit: Report Definitions and Potential Uses
| Report Name | Description | Potential Uses |
|---|---|---|
|
Closed Jeopardy Report |
Lists all the jeopardy items closed within a specified date range. |
Analyze the use of jeopardy. It allows you to determine if the codes are being used accurately by identifying the jeopardy code as it relates to late and potentially late service requests. |
|
Jeopardy Report By Code and Task |
Lists all service requests based on solicited task information. You can specify the task type, task status, and jeopardy code type. Based on the information you specify, this report returns a list of service requests and any associated child service requests. |
Determines how jeopardy and why missed codes are used across different task types. |
|
Non-Work Day List |
Generates a list of non-work days for a specific organization or group of organizations. Non-work days include both weekends and holidays. |
Review your work calendar and view the days that are not available for task scheduling. |
|
On Time Task Analysis by Work Group |
Calculates the number of tasks completed on time by considering the task actual completion date. This report also displays an on-time percentage of tasks completed by work group, provides a graphical view, and drill-down capabilities. |
Evaluate the efficiency of each work group in an organization. |
|
Open Jeopardy With Escalation Information |
Lists all the open service requests with a jeopardy code. |
Identify open late tasks. This report enables you to view late tasks and the associated escalation information. |
|
Provisioning Plan Assignment List |
Lists provisioning plans, the tasks associated with the provisioning plans, and the default work queue for each task. |
Evaluate your provisioning plans and the tasks associated with those plans. It may be useful when associating new products with provisioning plans. |
|
Work Queue Assignment |
Lists task assignments for a selected work queue. |
Identify the workload for each work queue. |
|
Work Queue Interval |
Analyzes task completion using interval days. Expected intervals are compared against actual completion intervals and an average interval in days is calculated. |
Determines if the expected completion intervals on provisioning plans need to be adjusted to meet actual results. |
|
Work Queue Ownership |
Provides details on which employees own each work queue. |
Level resources. |
|
Work Queue Unavailability |
Indicates the period of time during which an employee is unavailable. |
Schedule or identify production downtime by analyzing the time period when employees are out of the office. |
Running the Sample Reports
To run the sample reports:
-
Log into BI Publisher.
-
In the upper right corner of the Home page, click the Catalog link.
The Catalog appears.
-
If this is the first time you are running the sample reports, edit the data model to point to a data source. For instructions on how to do this, see "Changing the Data Model Source".
-
Expand Shared Folders, and select the BIPubReports folder.
-
Click the Open link for the report you want to run.
Depending on the report you opened, a list or lists from which to select data appears.
-
Select data from the list or lists that are present for the report you are running.
-
Click Apply to apply your data selections and run the report.
The report appears.
Modifying Existing Sample Reports
You can modify the existing sample reports by:
-
"Editing Existing Sample Reports" to alter the report format
-
"Changing the Data Model Source" to alter the data that appears in existing sample reports
-
"Setting Default Parameter Values" to alter the data that appears in the report
Any reports you create by modifying the existing sample reports can be run in the same manner as the sample reports. See "Running the Sample Reports" for more information.
Editing Existing Sample Reports
To edit an existing sample report:
-
Log into BI Publisher.
-
In the upper right corner of the Home page, click the Catalog link.
The Catalog appears.
-
Expand Shared Folders, and select the BIPubReports folder.
-
Click the Edit link for the report you want to edit.
-
Edit the report format.
For detailed information on editing the report format, click the Help icon on this page.
-
Click the Save icon.
Changing the Data Model Source
To change the Data Model Source:
-
Log into BI Publisher.
-
In the upper right corner of the Home page, click the Catalog link.
The Catalog appears.
-
Expand Shared Folders.
-
Expand BIPubReports, and select the Data Models folder.
-
Click the Edit link for the data model you want to edit.
-
Click Data Model.
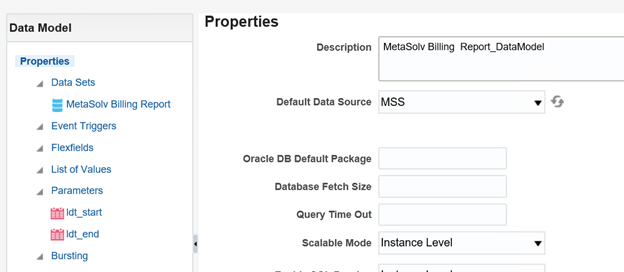
The Properties page for the selected data model appears.
-
From the Default Data Source list, select a different data source, as shown in Figure 1-2.
-
Expand Data Model, and select Data Sets.
-
Select a data set.
The Diagram tab for the selected data set appears.
-
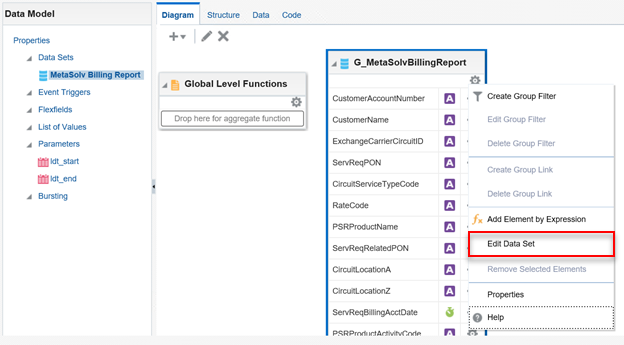
Click the View Actions list menu located in right corner of the data set.
-
From the View Actions menu, select Edit Data Set, as shown in Figure 1-3.
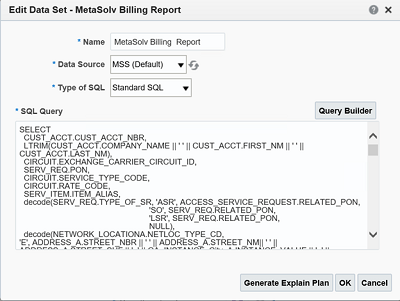
The Edit Data Set dialog box appears, as shown in Figure 1-4.
-
Change Data Source.
-
Close the Edit Data Set dialog box.
-
Click the Save icon.
Setting Default Parameter Values
To set default parameter values:
-
Log into BI Publisher.
-
In the upper right corner of the Home page, click the Catalog link.
The Catalog appears.
-
Expand Shared Folders.
-
Expand BIPubReports, and select the Data Models folder.
-
Click the Edit link for the data model you want to edit.
-
Expand Data Model, and select Parameters.
-
Select a parameter.
The Parameters page for the selected parameter appears, as shown in Figure 1-5.
-
Set or change the value in the Default Value field.
-
Click the Save icon.
Creating New Reports
You can create a new data model to create a new report. To view example queries when creating new reports, see "Viewing Example Queries".
To create a new report:
-
Understand the data model entities you intend to use in your custom report.
-
In the upper right corner of the Home page, click the New icon, and select Data Model.
The Properties page for the new data model appears.
-
From the Default Data Source list, select a data source.
-
Expand Data Model and select Data Sets.
The Diagram tab for the selected data set appears.
-
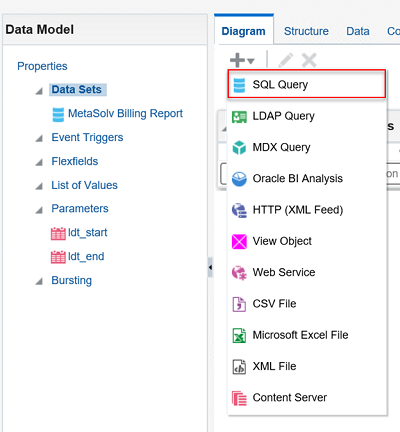
Click the New Data Set list menu and select SQL Query, as shown in Figure 1-6.
The Create Data Set - SQL dialog box opens.
-
Do one of the following:
-
Click Query Builder, select the appropriate tables, and build the query to populate the SQL Query field.
-
Copy and paste a pre-written query directly into the SQL Query field.
-
-
Click OK to close the Create Data Set - SQL dialog box.
-
Click the Save icon to save the data set.
-
Click the Get XML Output icon located next to the Save icon.
-
From the Number of rows to return list, select the number of rows to return.
-
Click Run.
-
Open the list menu located in the upper right corner of the page, and select Save as Sample Data to save the data.
The Diagram tab for the new data set appears.
-
In the upper right corner of the page, click the New icon, then select Report, then select the Using Existing Data Model link.
The Create Report window appears.
-
Select the data model and click Next.
-
Choose Guide Me and click Next.
-
From the Available Columns on the left side, select the columns that you want to appear in your report.
-
Click Finish.
-
On the Insert tab, use the listed Components to create data tables, bar charts, and so forth.
-
On the Page Layout tab, format your report by specifying portrait/landscape, headers/footers, and so forth.
-
Click the Save icon.
Any custom reports you create can be run in the same manner as the sample reports. See "Running the Sample Reports" for more information.
Viewing Example Queries
You can view the queries from any of the sample reports to use an example to follow when creating custom reports.
To view example queries:
-
Log into BI Publisher.
-
In the upper right corner of the Home page, click the Catalog link.
The Catalog appears.
-
Expand Shared Folders.
-
Expand BIPubReports, and select the Data Models folder.
-
Click the Edit link for the applicable data model.
-
Expand Data Model, and select Data Sets.
-
Select a data set.
The Diagram tab for the selected data set appears.
-
Click the View Actions list menu located in right corner of the data set.
-
From the View Actions menu, select Edit Data Set, as shown in Figure 1-7.
The Edit Data Set dialog box appears, as shown in Figure 1-8.
Here, you can view the query.
Frequently Asked Questions
This section provides answers to frequently asked questions regarding the use and functionality of Oracle Communications MetaSolv Solution (MSS) Operational Reports.
Does Oracle support running MSS Operational Reports against the production database?
Oracle recommends that you not run reports on the production database, because this may cause network problems and performance issues.
