2 ATS Framework Features
This chapter describes the ATS Framework features:
Table 2-1 ATS Framework Features Compliance Matrix
| Features | NWDAF | OCNADD |
|---|---|---|
| Application Log Collection | Yes | No |
| ATS API | No | No |
| ATS Health Check | No | No |
| ATS Jenkins Job Queue | Yes | Yes |
| ATS Maintenance Scripts | Yes | Yes |
| ATS System Name and Version Display on Jenkins GUI | Yes | Yes |
| Custom Folder Implementation | Yes | No |
| Single Click Job Creation | Yes | Yes |
| Final Summary Report, Build Color, and Application Log | Yes | Partially compliant (Application Log is not supported.) |
| Lightweight Performance | Yes | No |
| Modifying Login Password | No | Yes |
| Parallel Test Execution | No | No |
| Parameterization | Yes | No |
| PCAP Log Collection | No | No |
| Persistent Volume | No | Optional |
| Test Result Analyzer | Yes | Yes |
| Test Case mapping and Count | Yes | No |
2.1 Application Log Collection
Application Log Collection helps with debugging if a test case fails by collecting the application logs for NF System Under Test (SUT). Application logs are collected for the duration the failing test case was executed.
Application Log Collection can be implemented by using either ElasticSearch or Kubernetes Logs. In both these implementations, logs are collected per scenario for the failed scenarios.
Application Log Collection Using ElasticSearch
User Options
- Fetch_Log_Upon_Failure: YES/NO to select whether the log collection is required for a particular run
- Log_Level: NF Log-Levels to set the different Log-Level available for microservice
Fetching Logs
- ElasticSearch api is used to access & fetch logs
- Logs are fetched from ElasticSearch for the failed scenarios
- Hooks (after scenario) within the cleanup file are used to trigger
- Duration of the failed scenario is calculated based on the time stamp and is passed as a parameter to fetch the logs from ElasticSearch
- Filtered query is used to fetch the records based on Pod name, Service name & timestamp (Failed Scenario Duration)
- No rollover or rotation of logs
Considerations
- Maximum records that ElasticSearch API can fetch per microservice for a failed scenario is limited to 10k.
Versions
- ElasticSearch: 7.8.0
- python-ElasticSearch: 7.12.1
Parameters
- ElasticSearch: Kubernetes latency duration is considered as External parameter which is configurable in Jenkins
- ElasticSearch: Host name and port
Application Log Collection Using Kubernetes Logs
User Options
- Fetch_Log_Upon_Failure: YES / NO to select whether Log Collection is required for a particular run
- Log_Level: NF Log-Levels to set the different Log-Level available for Micro-Service
Fetching Logs
- Kube API is used to access and fetch logs
- Logs are fetched from microservices directly for the failed scenarios
- Hooks (after scenario) within the cleanup file are used to trigger
- Duration of the failed scenario is calculated based on the time stamp and is passed as a parameter to fetch the logs from microservices
Considerations
- Logs roll over can happen while fetching the logs for a failed scenario; max loss of logs are confined to a single scenario only.
2.2 ATS API
- Start: To initiate one of the three test suites such as Regression, NewFeatures or Performance
- Monitor: To obtain the progress of a test suite's execution
- Stop: To cancel an active test suite
- Get Artifacts: To retrieve the JUNIT format XML test result files for a completed test suite
Prerequisites
- Create an apiuser and grant the required access
- Create an API token for authentication in API calls
Create an API User
Perform the following procedure to create an API user:
- Log in to the ATS application using admin credentials.
- Click Manage ATS in the left navigation pane of the ATS application.
- Scroll down and click Manage Users.
- Click Create User in the left navigation pane.
- Enter the username as
<nf>apiuser, for example,policyapiuser,udrapiuser, and a password. - The Full name field is optional. If left blank, it’s automatically assigned a value by Jenkins.
- Enter your email address as
<nf>apiuser@oracle.com. - Click Create User. The API user is created.
Grant Access to the API User
Perform the following procedure to grant access to the API user:
- Click Manage ATS in the left navigation pane.
- Scroll down and click Configure Global Security.
- Scroll down to Authorization and click Add User.
- Enter the username created in the prompt that appears.
- Check all the boxes in the Authorization matrix for apiuser that are
also checked for
<nf>user. - Click Save.
- Go to the ATS main page and choose each of your NFs' pipeline.
- Click Configure in the left navigation pane.
- Scroll down to Enable project-based security and click Add user.
- Enter the username created in the prompt that appears.
- Check all the boxes in the Authorization matrix for apiuser that are
also checked for
<nf>user. - Click Save. Now, apiuser can be used in API calls.
Generate an API Token for a User
Any API call requires the use of an API token for authentication. You can generate the API token and it works until it is revoked or deleted.
Perform the following procedure to generate an API token for a user:
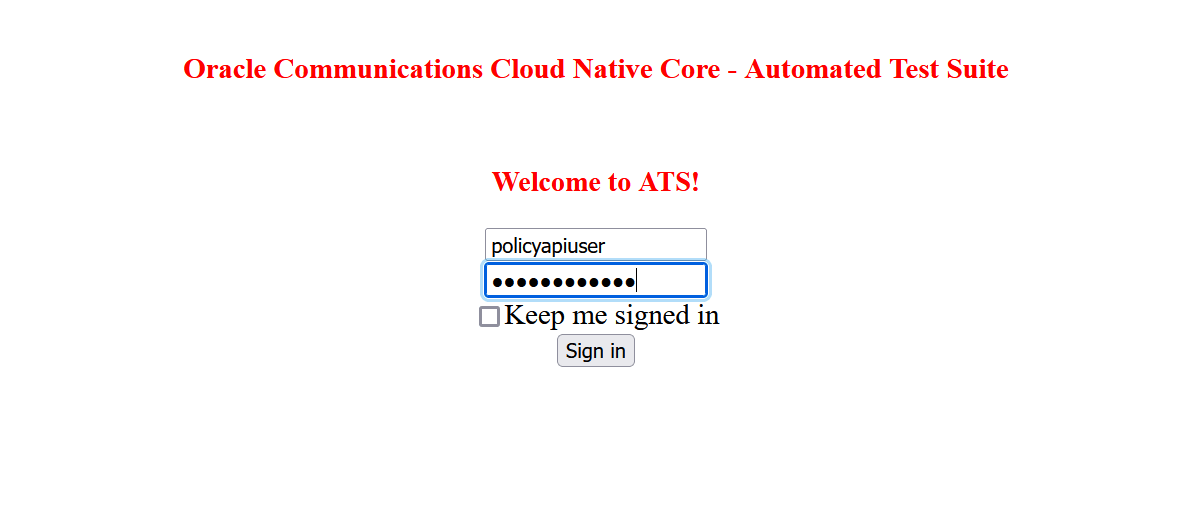
- Log in to Jenkins as an NF apiuser to generate an API token:
Figure 2-1 ATS Login Page
- Click on username from the drop-down list at the top right of
Jenkins GUI, then click Configure:
Figure 2-2 Configure to Add Token

- Under the API Token section, click Add New Token:
Figure 2-3 Add New Token

- Enter a suitable name for the token, such as policy, and then click
Generate:
Figure 2-4 Generate Token

- Copy the generated token that appears and save it. You will not be
able to retrieve the token once you close this prompt:
Figure 2-5 Save Generated Token

- Click Save. An API token is generated and can be used for starting, monitoring, and stopping a job using the REST API.
2.3 ATS Health Check
Deploying ATS Health Check in a Webscale Environment
Earlier, ATS used Helm test functionality to check the health of the System Under Test (SUT). With the implementation of the ATS Health Check pipeline, this process has now been automated.
On clicking Build Now, the user can run the health check on ATS and store its results in the console logs.
Deploy ATS health check with Webscale parameter set to 'true' and following parameters by encoding it with base64 in the ATS values.yaml file:
webscalejumpserverip: encrypted-data
webscalejumpserverusername: encrypted-data
webscalejumpserverpassword: encrypted-data
webscaleprojectname: encrypted-data
webscalelabserverFQDN: encrypted-data
webscalelabserverport: encrypted-data
webscalelabserverusername: encrypted-data
webscalelabserverpassword: encrypted-data
Example:
webscalejumpserverip=$(echo -n '10.75.217.42' | base64), Where Webscale Jump server ip needs to be provided
webscalejumpserverusername=$(echo -n 'cloud-user' | base64), Where Webscale Jump server Username needs to be provided
webscalejumpserverpassword=$(echo -n '****' | base64), Where Webscale Jump server Password needs to be provided
webscaleprojectname=$(echo -n '****' | base64), Where Webscale Project Name needs to be provided
webscalelabserverFQDN=$(echo -n '****' | base64), Where Webscale Lab Server FQDN needs to be provided
webscalelabserverport=$(echo -n '****' | base64), Where Webscale Lab Server Portneeds to be provided
webscalelabserverusername=$(echo -n '****' | base64), Where Webscale Lab Server Username needs to be provided
webscalelabserverpassword=$(echo -n '****' | base64), Where Webscale Lab Server Password needs to be provided
Running ATS Health Check Pipeline in a Webscale Environment
- Log in to ATS using respective <NF> login credentials.
- Click <NF>-HealthCheck pipeline and then, click
Configure.
Note:
<NF> denotes the network function. For example, in UDR it is called as UDR-HealthCheck pipeline. - Provide parameter a with Helm
release name deployed. If there are multiple releases, use comma to provide
all Helm release names.
Provide parameter c with Helm command name- helm or helm3, or helm2, whichever works.
//a = helm releases [Provide Release Name with
                                Comma Separated if more than 1 ]
//c = helm command name [helm or helm2 or helm3] - Save the changes and click Build Now. ATS runs the health check on respective network function.
Deploying ATS Health Check in a Non-Webscale Environment
Deploy ATS health check with Webscale parameter set to 'false' and following parameters by encoding it with base64 in the ATS values.yaml file:
occnehostip: encrypted-data
occnehostusername: encrypted-data
occnehostpassword: encrypted-data
Example:
occnehostip=$(echo -n '10.75.217.42' | base64) , Where occne host ip needs to be provided
occnehostusername=$(echo -n 'cloud-user' | base64), Where occne host username needs to be provided
occnehostpassword=$(echo -n '****' | base64), Where password of host needs to be provided
Running ATS Health Check Pipeline in a Non-Webscale Environment
- Log in to ATS using respective <NF> login credentials.
- Click <NF>-HealthCheck pipeline and then, click Configure.
- Provide parameter a with Helm
release name deployed. If there are multiple releases, use comma to provide
all Helm release names.
Provide parameter b with SUT deployed namespace name.
Provide parameter c with Helm command name- helm or helm3, or helm2, whichever works.
//a = helm releases [Provide Release Name with Comma Separated if more than 1 ] //b = Namespace, If not applicable to WEBSCALE environment then remove the argument //c = helm command name [helm or helm2 or helm3] - Save the changes and click Build Now. ATS runs the health check on respective network function.
2.4 ATS Jenkins Job Queue
The ATS Jenkins Job Queue feature is to queue the second job if the current job is already running, whether from the same pipelines or different pipelines.
- In Jenkins configuration, set the total number of executors
to 1.
This makes the jobs wait for resource allocation if the new pipeline is triggered.
Note:
This change can be done in the base image. - Change the agent type to none.
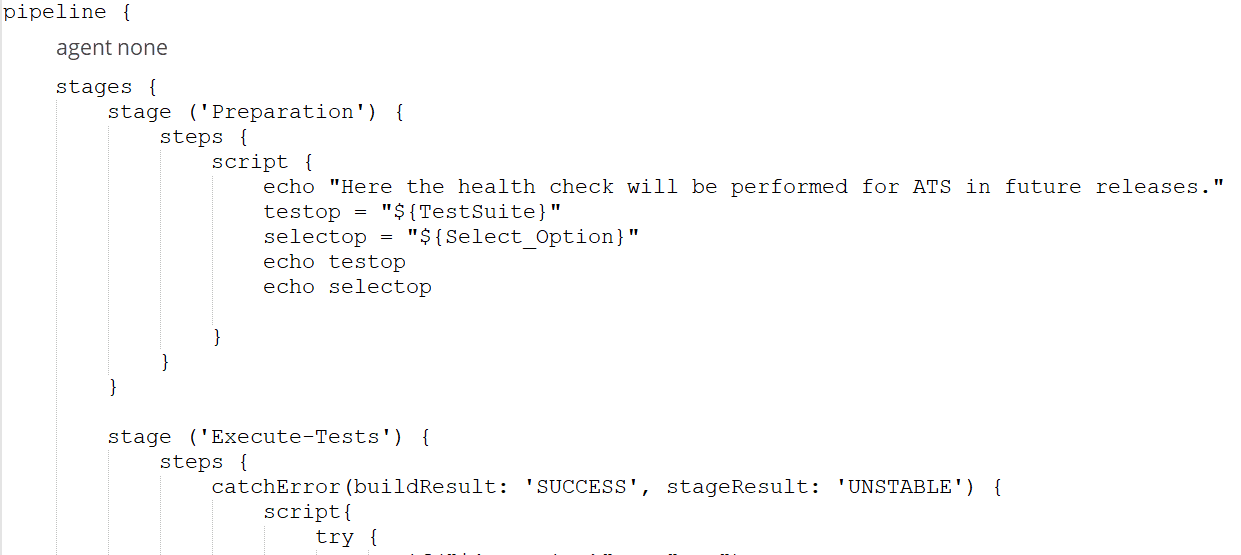
- Remove the new node allocation from the post-build action
within the Jenkins pipeline script.

2.5 ATS Maintenance Scripts
- Taking a backup of the ATS custom folders and Jenkins pipeline
- Viewing the configuration and restoring the Jenkins pipeline
- Viewing the configuration and installing or uninstalling ATS and stubs
ATS maintenance scripts are present in the ATS image at the
following path: /var/lib/jenkins/ocats_maint_scripts
kubectl cp <NAMESPACE>/<POD_NAME>:/var/lib/jenkins/ocats_maint_scripts <DESTINATION_PATH_ON_BASTION> podkubectl cp ocpcf/ocats-ocats-policy-694c589664-js267:/var/lib/Jenkins/ocats_maint_scripts /home/meta-user/ocats_maint_scriptsATS Scripts
- ats_backup.sh: This script
requires the user's inputs and takes a backup of the ATS custom folders, Jenkins jobs,
and user's folders on the user's system. The backup can be of just the Jenkins jobs and
user's folder or just the custom folders or both. The custom folders include
cust_regression, cust_newfeatures, cust_performance, cust_data, and custom_config. For a
Jenkins job or a user's folder, the script only takes a backup of the
config.xmlfile. Also, the script requires the user to store a backup on the user's system (the default path is the location from where the script is being run) and to create a backup folder on the system and take the backup of the chosen folder from the corresponding ATS into the backup folder. The backup folder name can be of the following notation:ats_<version>_backup_<date>_<time>. - ats_uninstall.sh: This script requires the user's inputs and uninstalls the corresponding ATS.
- ats_install.sh: This script
requires the user's inputs and installs a new ATS. If PVEnabled is set to true, the script
also reads the PVC name from
values.yamland creates thevalues.yamlbefore installation. Also, if needed, the script performs the postinstallation steps, such as copying tests and Jenkins jobs' folders from theats_datatar file to the ATS pod when PV is deployed, and then restarts the pod. - ats_restore.sh: This
script requires the user's inputs and restores the new release ATS pipeline and views
the configuration by referring to the last release ATS Jenkins jobs and user's
configuration. It depends on the user whether or not to use the backup folders from the
user's system to restore the ATS configuration. If the user instructs the script to use
the backup from the system, the script requires the path of the backup and uses the
backup to restore. Otherwise, the script requires the last ATS Helm release name to
refer to its Jenkins jobs and user's configuration to restore.
The script refers to the last release ATS Jenkins pipelines and sets the Discard Old builds property, provided that this property is set in the last release ATS for a pipeline but not in the current release. If this property is set in both the releases, the script just updates the values according to the last release. Also, the script restores the pipeline environment variables values as per the last release ATS. If any custom pipeline (created by the user) is present in the last release ATS, the script restores that as well. It also restores the extra views created by NF users, for example, policyuser, scpuser, and nrfuser. Moreover, the script displays messages about the pending configuration that the user needs to perform manually. For example, a new pipeline or a new environment variable (for a pipeline) introduced in the new release.
While deploying ATS without PV, Jenkins of ATS needs to be restarted for the restore process to complete. If the last release ATS contains the Configuration_Type parameter, the Configuration_Type script needs to be approved with the In Process Script Approval setting under Manage ATS of Jenkins for the restore process to complete.
2.6 ATS System Name and Version Display on Jenkins GUI
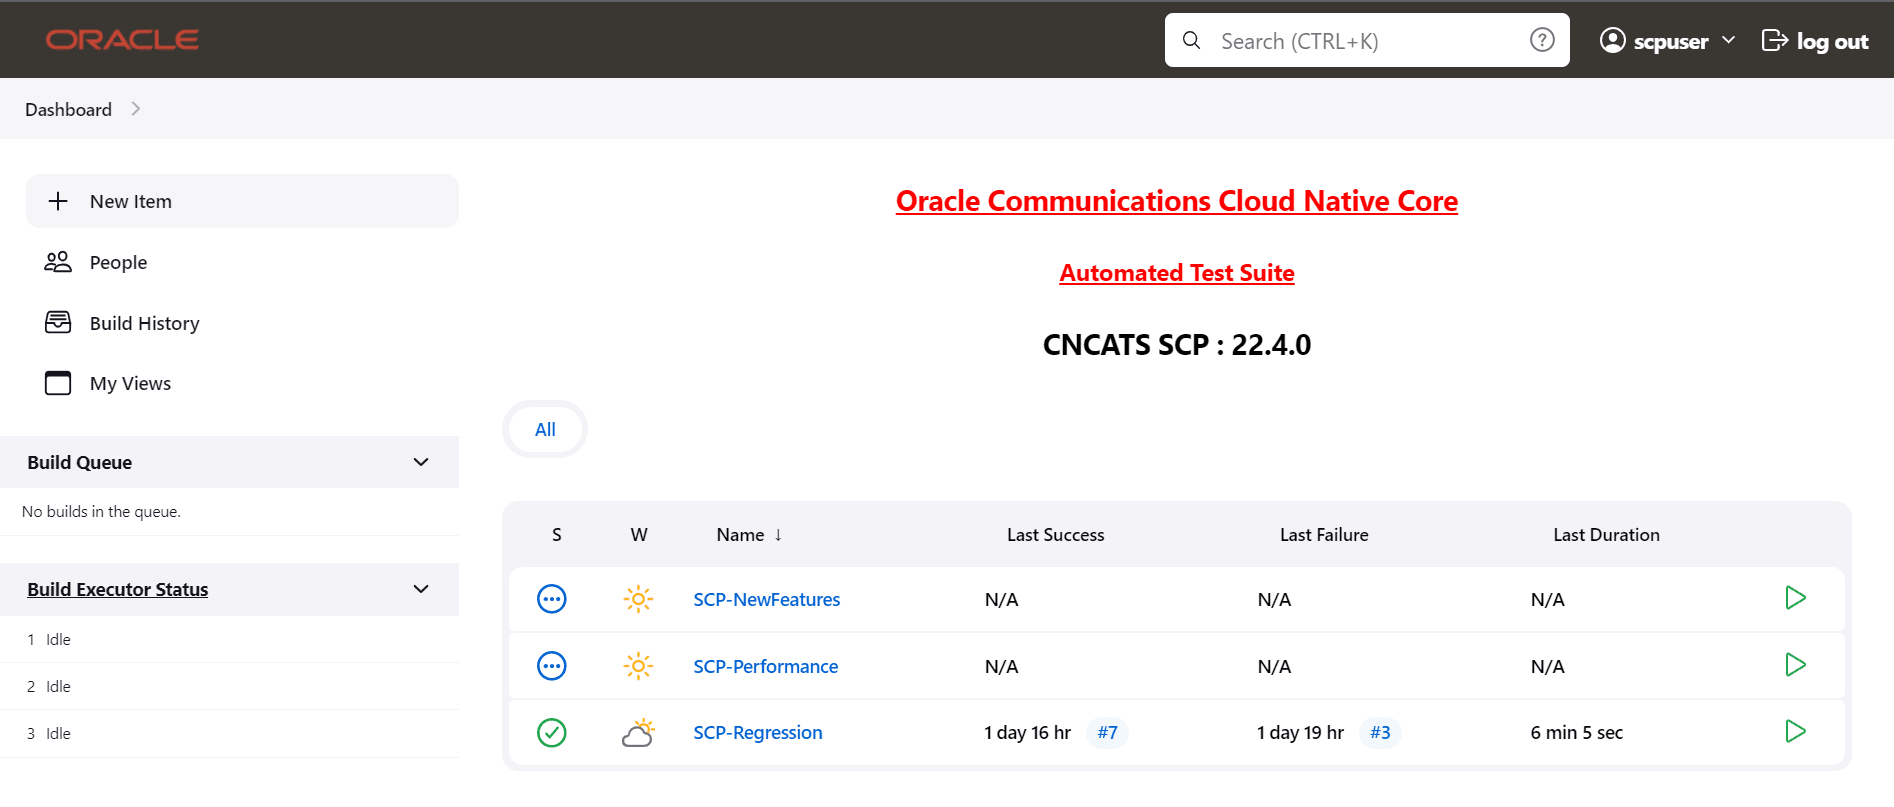
There is a init.groovy script present in the
.jenkins folder in the ATS pod. The script reads the system
name and version values from the ATS pod and displays them on the ATS GUI.
Figure 2-6 ATS System Name and Version
2.7 Custom Folder Implementation
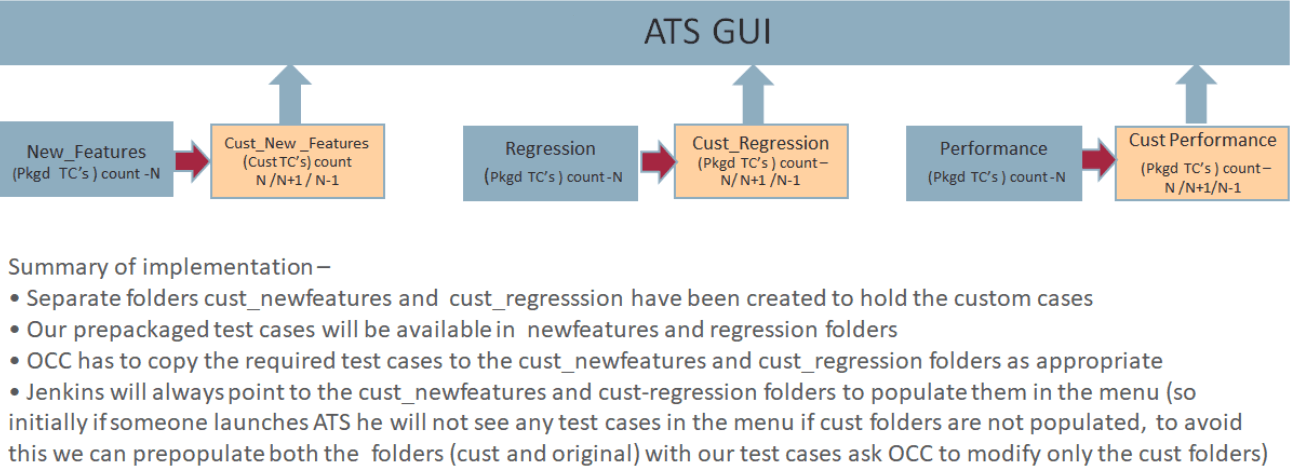
With the implementation of custom folders (cust_newfeatures, cust_regression, and cust_performance), users can customize test cases (update, add, or delete test cases) without disturbing the original product test cases in the newfeatures, regression, and performance folders. The new customized test cases are stored in the custom folders.
Figure 2-7 Summary of Custom Folder Implementation
2.8 Single Click Job Creation
This feature enables ATS users to create a job to run TestSuite with single click.
Prerequisite: The network function specific user should have the 'Create Job' access.
Configuring Single Click Job
- Log in to ATS using network function specific login credentials.
- Click New Item in the left navigation
pane of the ATS application. The following page appears:
Figure 2-8 New Item Window
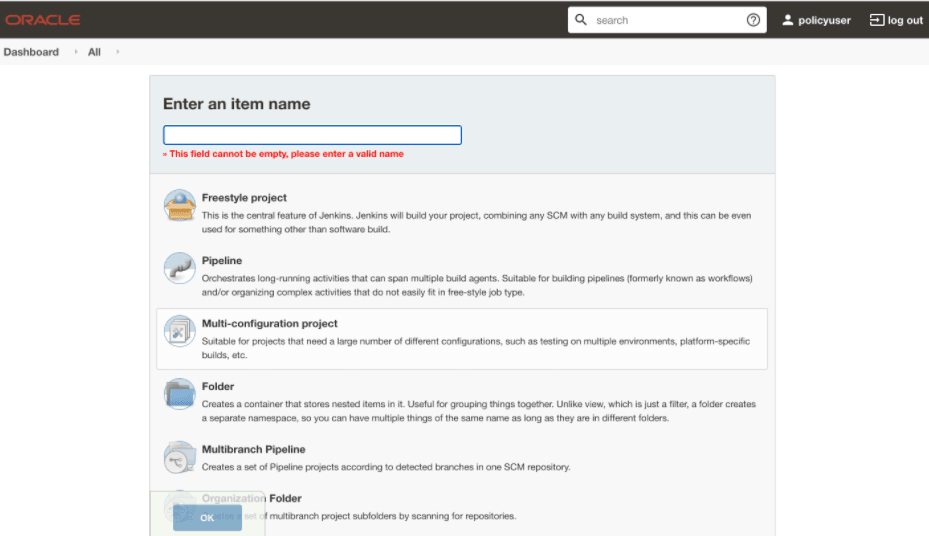
- In the Enter an item name text box, enter the job name. Example: <NF-Specific-name>-NewFeatures.
- In the Copy from text box, enter the actual job name for which you need single click execution functionality. Example: <NF-Specific-name>-NewFeatures.
- Click OK. You are automatically redirected to edit the newly created job's configuration.
- Under the General group, deselect the This Project is Parameterised option.
- Under the Pipeline group, make the corresponding changes to remove the 'Active Choice Parameters' dependency.
- Provide the default values for the
TestSuite, SUT,
Select_Option,
Configuration_Type, and other parameters, as
required, on the BuildWithParameters page.
Example: Pipeline without Active Choice Parameter Dependency
node ('built-in'){ //a = SELECTED_NF b = PCF_NAMESPACE c = PROMSVC_NAME d = GOSTUB_NAMESPACE //e = SECURITY f = PCF_NFINSTANCE_ID g = POD_RESTART_TIME h = POLICY_TIME //i = NF_NOTIF_TIME j = RERUN_COUNT k =INITIALIZE_TEST_SUITE l = STUB_RESPONSE_TO_BE_SET //m = POLICY_CONFIGURATION_ADDITION n = POLICY_ADDITION o = NEXT_MESSAGE //p = PROMSVCIP q = PROMSVCPORT r = TIME_INT_POD_DOWN s = POD_DOWN_RETRIES //t = TIME_INT_POD_UP u = POD_UP_RETRIES v = ELK_WAIT_TIME w = ELK_HOST //x = ELK_PORT y = STUB_LOG_COLLECTION z = LOG_METHOD A = enable_snapshot B = svc_cfg_to_be_read C = PCF_API_ROOT //Description of Variables: //SELECTED_NF : PCF //PCF_NAMESPACE : PCF Namespace //PROMSVC_NAME : Prometheus Server Service name //GOSTUB_NAMESPACE : Gostub namespace //SECURITY : secure or unsecure //PCF_NFINSTANCE_ID : nfInstanceId in PCF application-config config map //POD_RESTART_TIME : Greater or equal to 60 //POLICY_TIME : Greater or equal to 120 //NF_NOTIF_TIME : Greater or equal to 140 //RERUN_COUNT : Rerun failing scenario count //TIME_INT_POD_DOWN : The interval after which we check the POD status if its down //TIME_INT_POD_UP : The interval after which we check the POD status if its UP //POD_DOWN_RETRIES : Number of retry attempt in which will check the pod down status //POD_UP_RETRIES : Number of retry attempt in which will check the pod up status //ELK_WAIT_TIME : Wait time to connect to Elastic Search //ELK_HOST : Elastic Search HostName //ELK_PORT : Elastic Search Port //STUB_LOG_COLLECTION : To Enable/Disable Stub logs collection //LOG_METHOD : To select Log collection method either elasticsearch or kubernetes //enable_snapshot: Enable or disable snapshots that are created at the start and restored at the end of each test run //svc_cfg_to_be_read: Timer to wait for importing service configurations //PCF_API_ROOT: PCF_API_ROOT information to set Ingress gateway service name and port withEnv([ 'TestSuite=NewFeatures', 'SUT=PCF', 'Select_Option=All', 'Configuration_Type=Custom_Config' ]){ sh ''' sh /var/lib/jenkins/ocpcf_tests/preTestConfig-NewFeatures-PCF.sh \ -a PCF \ -b ocpcf \ -c occne-prometheus-server \ -d ocpcf \ -e unsecure \ -f fe7d992b-0541-4c7d-ab84-c6d70b1b0123 \ -g 60 \ -h 120 \ -i 140 \ -j 2 \ -k 0 \ -l 1 \ -m 1 \ -n 15 \ -o 1 \ -p occne-prometheus-server.occne-infra\ -q 80\ -r 30\ -s 5\ -t 30\ -u 5\ -v 0\ -w occne-elastic-elasticsearch-master.occne-infra\ -x 9200\ -y yes\ -z kubernetes\ -A no\ -B 15\ -C ocpcf-occnp-ingress-gateway:80\ ''' load "/var/lib/jenkins/ocpcf_tests/jenkinsData/Jenkinsfile-Policy-NewFeatures" } } - Click Save. The ATS application is ready to run TestSuite with 'SingleClick' using the newly created job.
2.9 Final Summary Report, Build Color, and Application Log
Supports Implementation of Total-Features
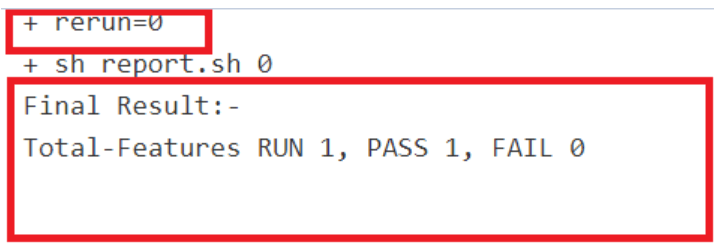
- If rerun is set as 0, the test result report shows the following
result:
Figure 2-9 Total Features = 1, and Rerun = 0
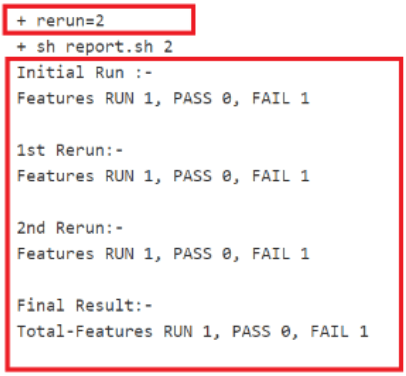
- If rerun is set as non-zero, the test result report shows the
following result:
Figure 2-10 Total Features = 1, and Rerun = 2
Final Summary Report Implementations
Figure 2-11 Group Wise Results
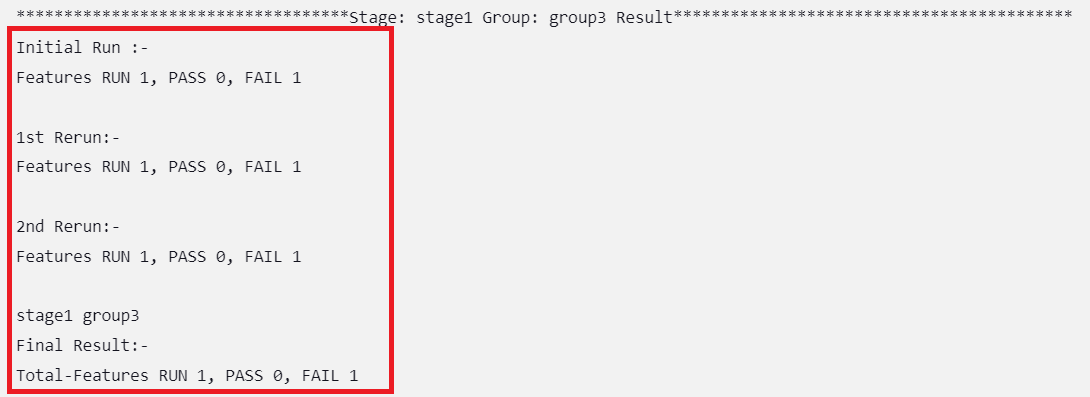
Figure 2-12 Result When Selected Features Pass

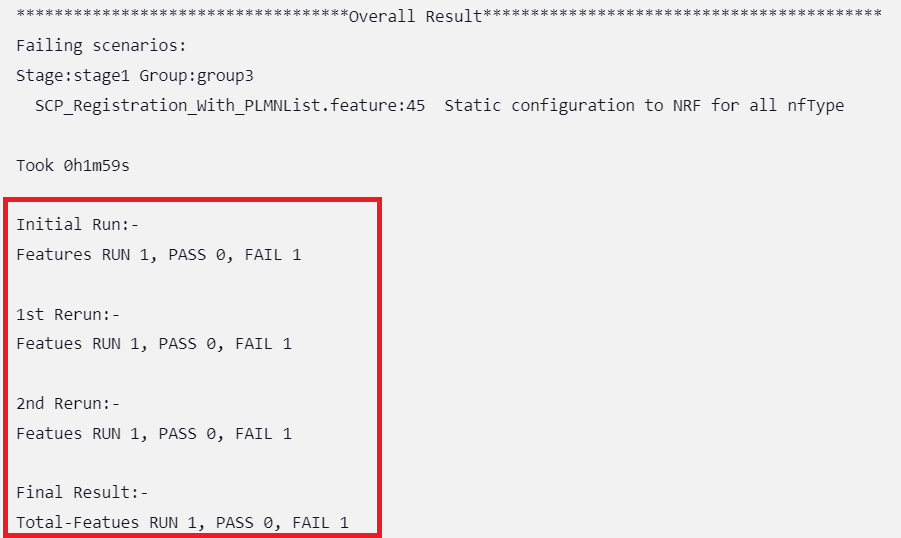
Figure 2-13 Result When Any of the Selected Features Fail
Implementing Build Colors
Table 2-2 Build Color Details
| Rerun Values | Rerun set to zero | Rerun set to non-zero | |||
|---|---|---|---|---|---|
| Status of Run | All Passed in Initial Run | Some Failed in Initial Run | All Passed in Initial Run | Some Passed in Initial Run, Rest Passed in Rerun | Some Passed in Initial Run, Some Failed Even After Rerun |
| Build Status | SUCCESS | FAILURE | SUCCESS | SUCCESS | FAILURE |
| Pipeline Color | GREEN | Execution Stage where test cases failed shows YELLOW color, rest of the successful stages are GREEN | GREEN | GREEN | Execution Stage where test cases failed shows YELLOW color, rest of the successful stages are GREEN |
| Status Color | BLUE | RED | BLUE | BLUE | RED |
In sequential execution, the build color or overall pipeline status of any run was mainly dependent on two parameters: the rerun count and the pass or fail status of test cases in the initial and final runs.
From the parallel test case execution, the pipeline status will also depend on
another parameter, "Fetch_Log_Upon_Failure," which is given in the build with
parameters page. If the parameter Fetch_Log_Upon_Failure is not
there, its default value will be considered "NO"."
Table 2-3 Pipeline Status When Fetch_Log_Upon_Failure = NO
| Rerun Values | Rerun set to zero | Rerun set to non-zero | |||
|---|---|---|---|---|---|
| Passed/Failed | All Passed in Initial Run | Some Failed in Initial Run | All Passed in Initial Run | Some Passed in Initial Run, Rest Passed in Rerun | Some Passed in Initial Run, Some Failed Even After Rerun |
| Status | SUCCESS | FAILURE | SUCCESS | SUCCESS | FAILURE |
Table 2-4 Pipeline Status When Fetch_Log_Upon_Failure = YES
| Rerun Values | Rerun set to zero | Rerun set to non-zero | ||||
|---|---|---|---|---|---|---|
| Passed/Failed | All Passed in Initial Run | Some Failed in Initial Run and Failed in Rerun | Some Failed in Initial Run and Passed in Rerun | All Passed in Initial Run | Some Passed in Initial Run, Rest Passed in Rerun | Some Passed in Initial Run, Some Failed Even After Rerun |
| Status | SUCCESS | FAILURE | SUCCESS | SUCCESS | SUCCESS | FAILURE |
rerun_count, Fetch_Log_Upon_Failure, and
pass/fail status of test cases in initial and final run and the
corresponding build colors are as follows:
- When
Fetch_Log_Upon_Failureis set to YES andrerun_countis set to 0, test cases pass in the initial run. The pipeline will be green, and its status will show as blue:Figure 2-14 Fetch_Log_Upon_Failure is set to YES and rerun_count is set to 0, test cases pass

- When
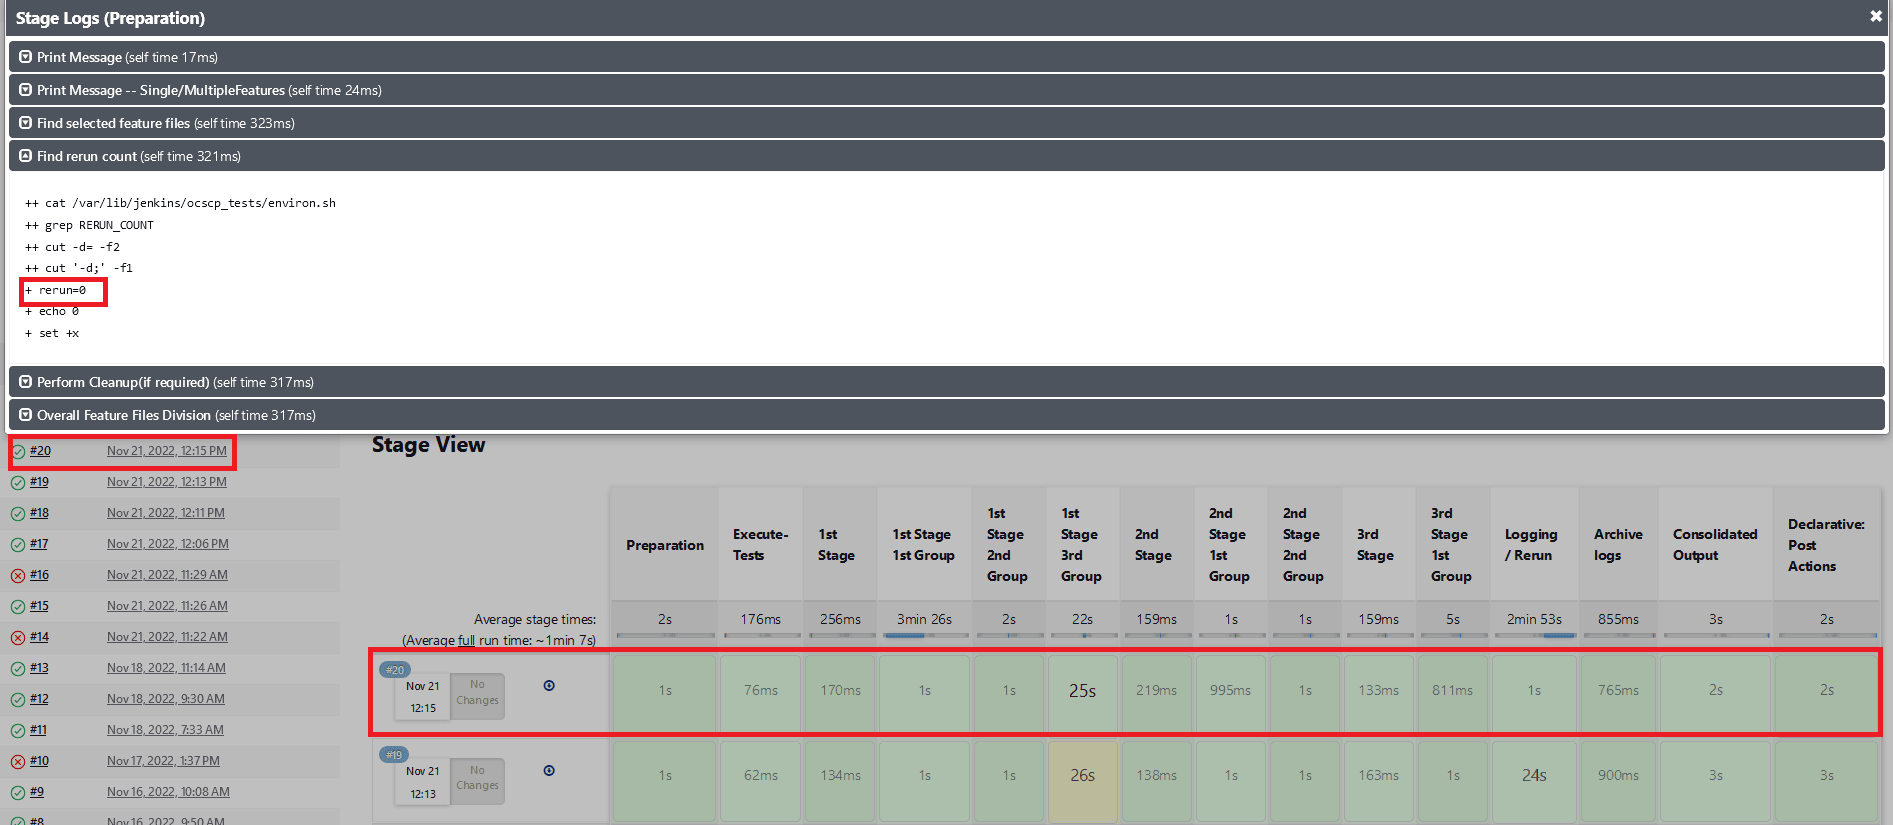
Fetch_Log_Upon_Failureis set to YES andrerun_countis set to 0, test cases fail on the initial run but pass on the extra run. The initial execution stage will be yellow, all subsequent successful stages will be green, and the status will be blue:Figure 2-15 Test Cases Fail on the Initial Run but Pass on the Extra Rerun
- When
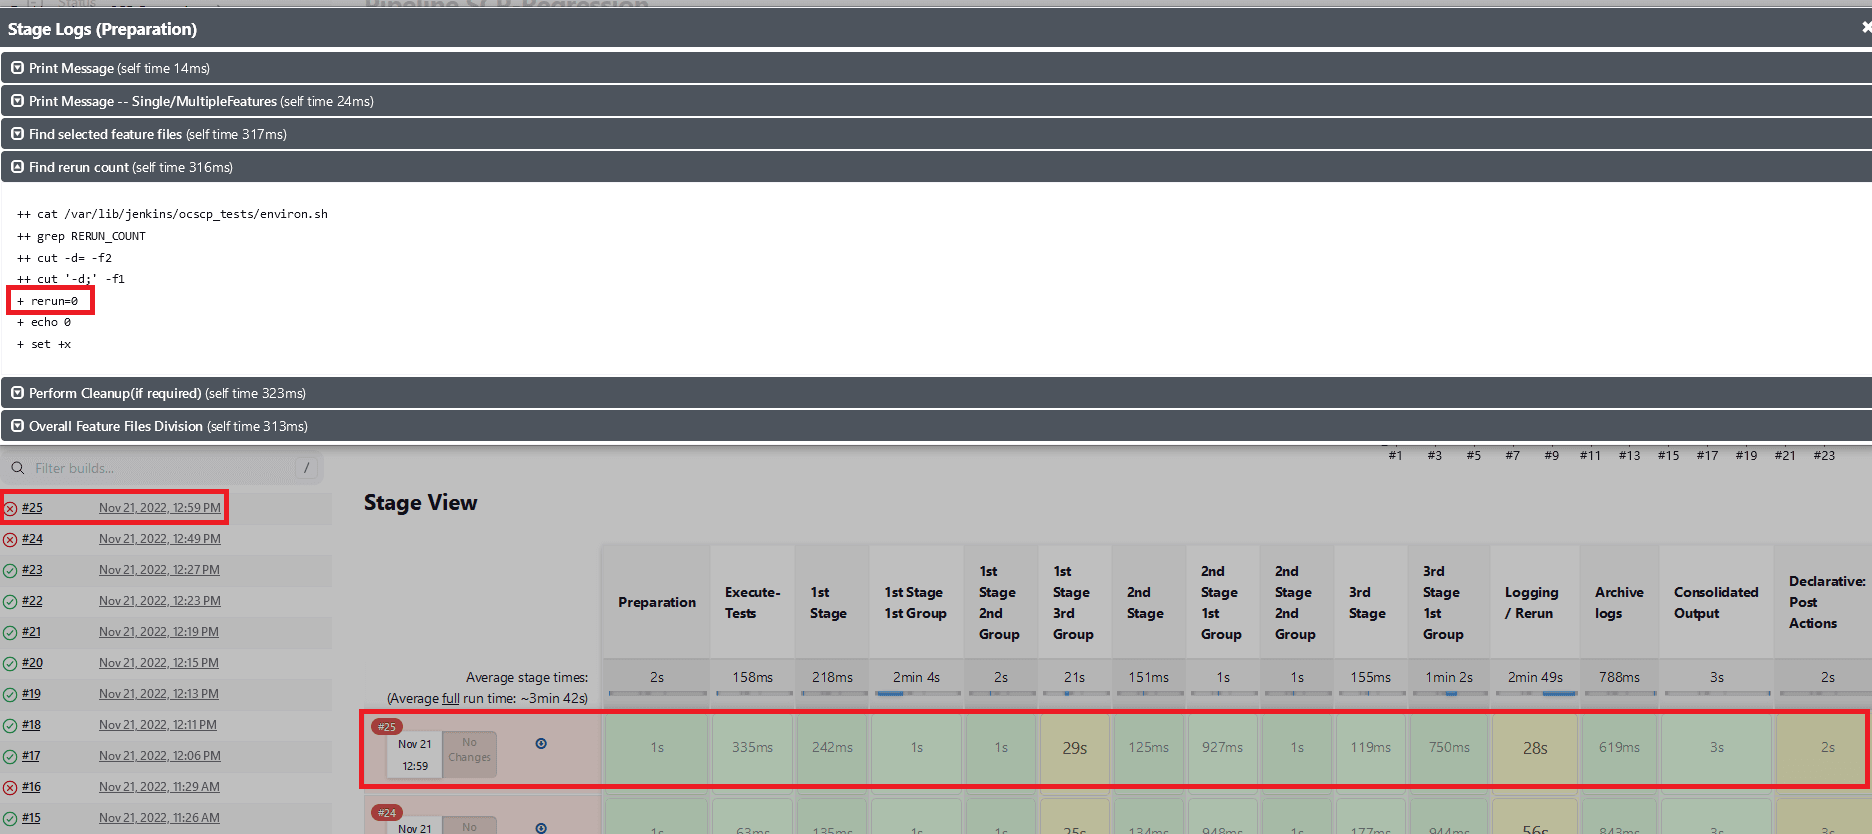
Fetch_Log_Upon_Failureis set to YES andrerun_countis set to 0, test cases fail in both the initial and the extra rerun. Execution stages will show as yellow, all other successful stages will be shown as green, and the overall pipeline status will be red:Figure 2-16 Test Cases Fail in Both the initial and the Extra Rerun
- When
Fetch_Log_Upon_Failureis set to YES and thererun countis set to non zero. If all of the test cases pass in the first run, no rerun will be initiated because the cases have already been passed. The pipeline will be green, and the status will be indicated in blue:Figure 2-17 All of the Test cases Pass in the Initial Run

- When
Fetch_Log_Upon_Failureis set to YES and thererun countis set to non zero. If some of the test cases fail in the initial run and the remaining ones pass in one of the remaining reruns, then the initial test case execution stages will show as yellow, the remaining stages as green, and the overall pipeline status as blue:Figure 2-18 Test Cases Fail in the Initial Run and the Remaining Ones Pass
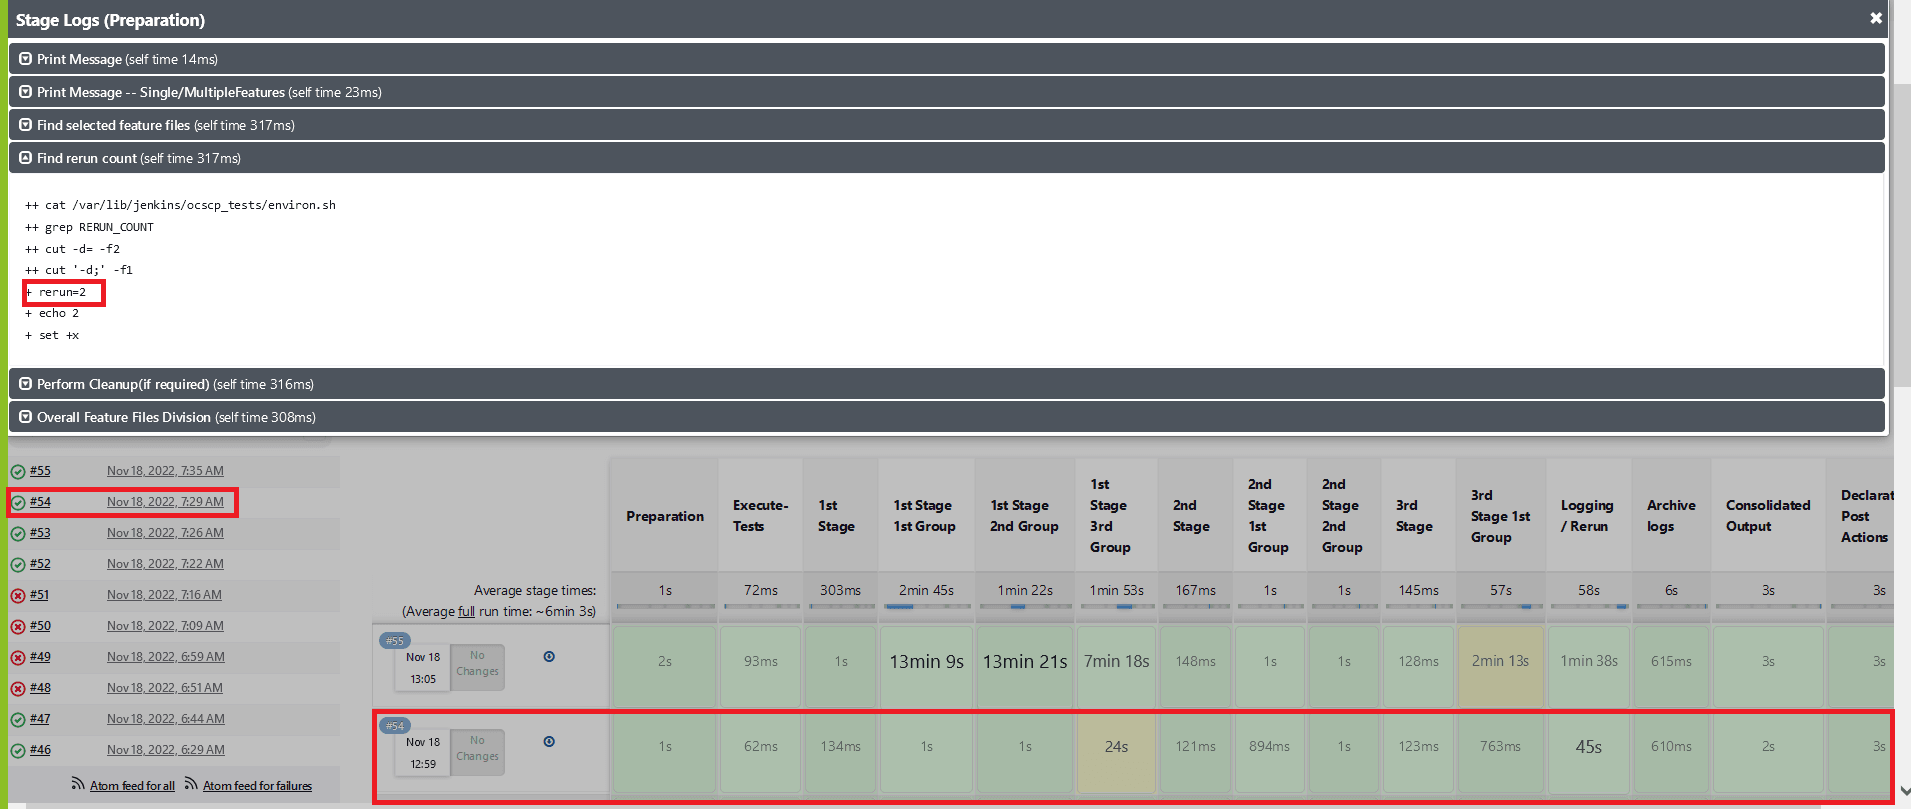
- When
Fetch_Log_Upon_Failureis set to YES and thererun countis set to non zero. If some of the test cases fail in the initial run and the remaining ones fail in all the remaining reruns. The stages of test case execution will be shown in yellow, the remaining stages in green, and the overall pipeline status in red:Figure 2-19 Test Cases Fail in the Initial and Remaining Reruns
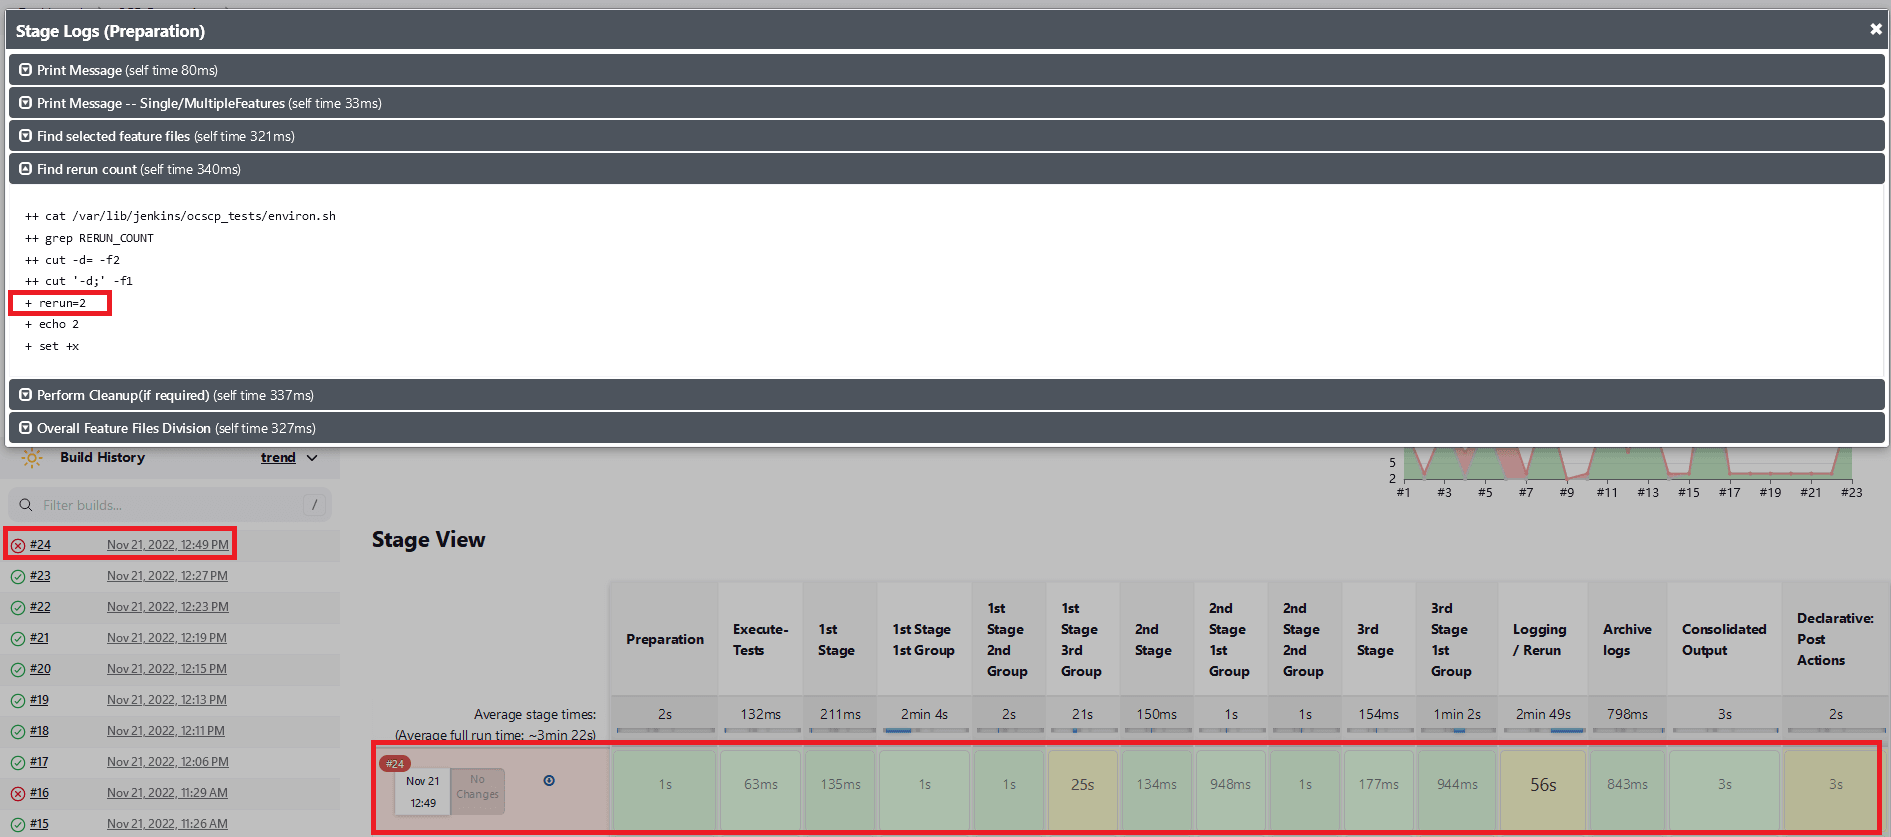
Implementing Application Log
ATS automatically fetches the SUT Debug logs during the rerun cycle if it encounters any failure and saves them in the same location as that of build console logs. The logs are fetched for the rerun time duration only using the timestamps. If for some microservices there are no log entries in that time duration, it does not capture them. Hence, the logs are fetched only for the microservices that has an impact or are associated with the failed test cases.
Location of SUT Logs:
/var/lib/jenkins/.jenkins/jobs/PARTICULAR-JOB-NAME/builds/BUILD-NUMBER/date-timestamp-BUILD-N.txt
Note:
The file name of SUT log is suffixed with date, timestamp, and the build number (for which the logs are fetched). These logs share the same retention period as that of build console logs, set in the ATS configuration. It is recommended to set the retention period to optimal owing of the Persistent Volume Claim (PVC) storage space availability.2.10 Lightweight Performance
With the implementation of Lightweight Performance feature in ATS, the ATS users can now run performance test cases. A new pipeline called <NF>-Performance (where, <NF> denotes the Network Function. For example, SLF-Performance is introduced in ATS.
Figure 2-20 Sample Screen: UDR Home Page
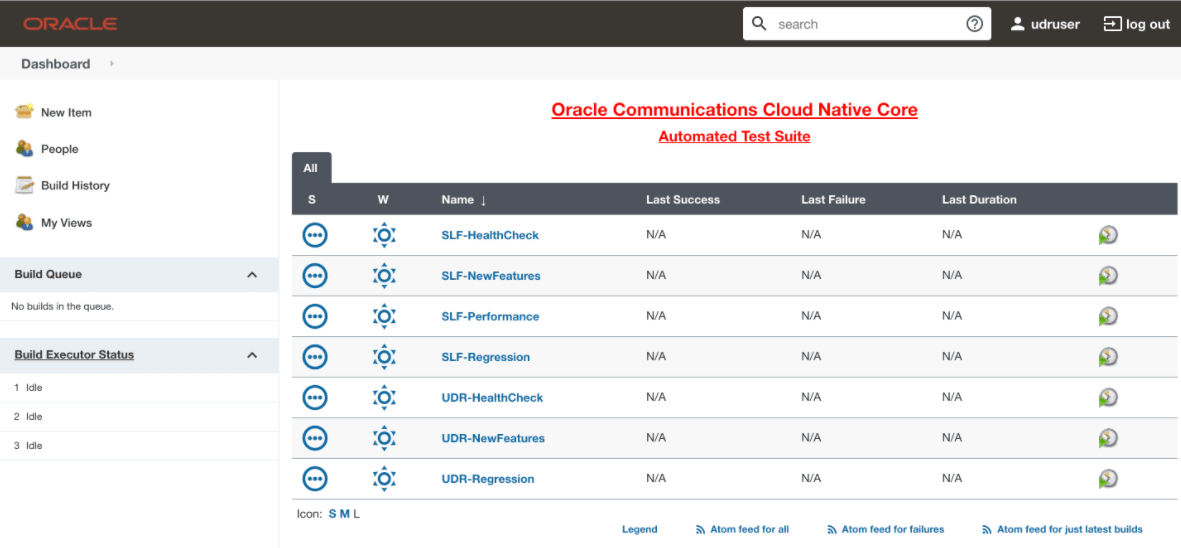
The <NF>-Performance pipeline verifies 500 - 1k TPS (Transactions per Second) of traffic using http-go tool (a tool used to run the traffic in backend). It also helps to monitor CPU and memory of microservices while running the lightweight traffic.
The duration of traffic run can be configured on the pipeline.
Configuring <NF>-Performance Pipeline
To configure <NF>-Performance:
- Click <NF>-Performance pipeline and then, click Configure.
- The General tab appears. The user must wait for the page to load completely.
- Click the Advanced Project Options tab. Scroll-down to reach the Pipeline configuration section.
- Update the configurations as per your NF requirements and click Save. The Pipeline <NF>-Performance page appears.
- Click Build Now. This triggers lightweight traffic for respective network function. For more information see, unresolvable-reference.html#GUID-2FB5D8DE-65BC-4E10-AA3A-D26DCF50BC65.
2.11 Modifying Login Password
You can log in to ATS application using default login credentials. The default login credentials are shared for each NF in the respective chapter of this guide.
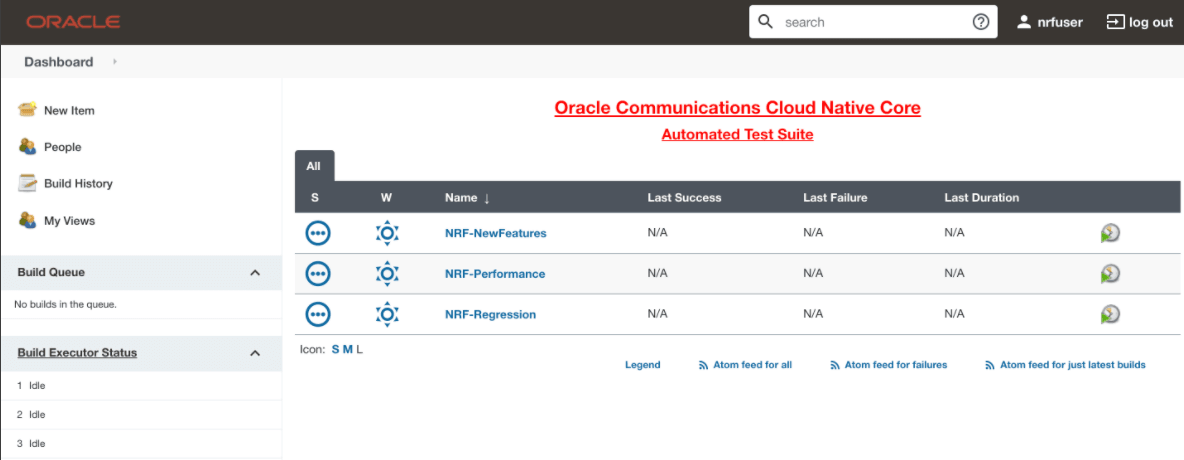
- Log in to ATS application using the default login credentials. The
home page of respective NF appears with its preconfigured pipelines as
follows:
Figure 2-21 Sample Screen: NRF Home Page
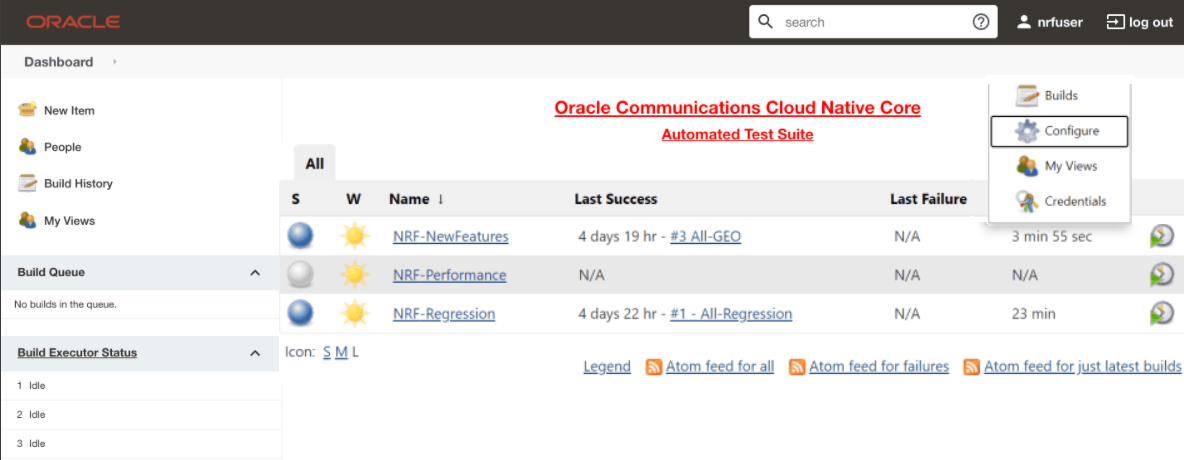
- Hover over the user name and click the down arrow. Click
Configure as follows:
Figure 2-22 Configure Option
- The following page appears.
Figure 2-23 Logged-in User Detail

- In the Password section, enter the new password in the Password and Confirm Password fields and click Save.
Thus, a new password is set for the user.
2.12 Parallel Test Execution
Parallel test execution enables you to perform multiple logically grouped tests simultaneously on the same System Under Test (SUT) to reduce the overall execution time of ATS.
ATS currently executes all its tests in a sequential manner, which is time-consuming. With parallel test execution, tests can be run concurrently rather than sequentially or one at a time. Test cases or feature files are now separated into different folders, such as stages and groups, for concurrent test execution. Different stages, such as stage 1, stage 2, and stage 3, run the test cases in a sequential order, and each stage has its own set of groups. Test cases or feature files available in different groups operate in parallel. When all the groups within one stage have completed their execution, then only the next stage will start the execution.
Pipeline Stage View
The pipeline stage view appears as follows:
Figure 2-24 Pipeline Stage View

Pipeline Blue Ocean View
Figure 2-25 Pipeline Blue Ocean View

Impact on Other Framework Features
2.12.1 Downloading or Viewing Individual Group Logs
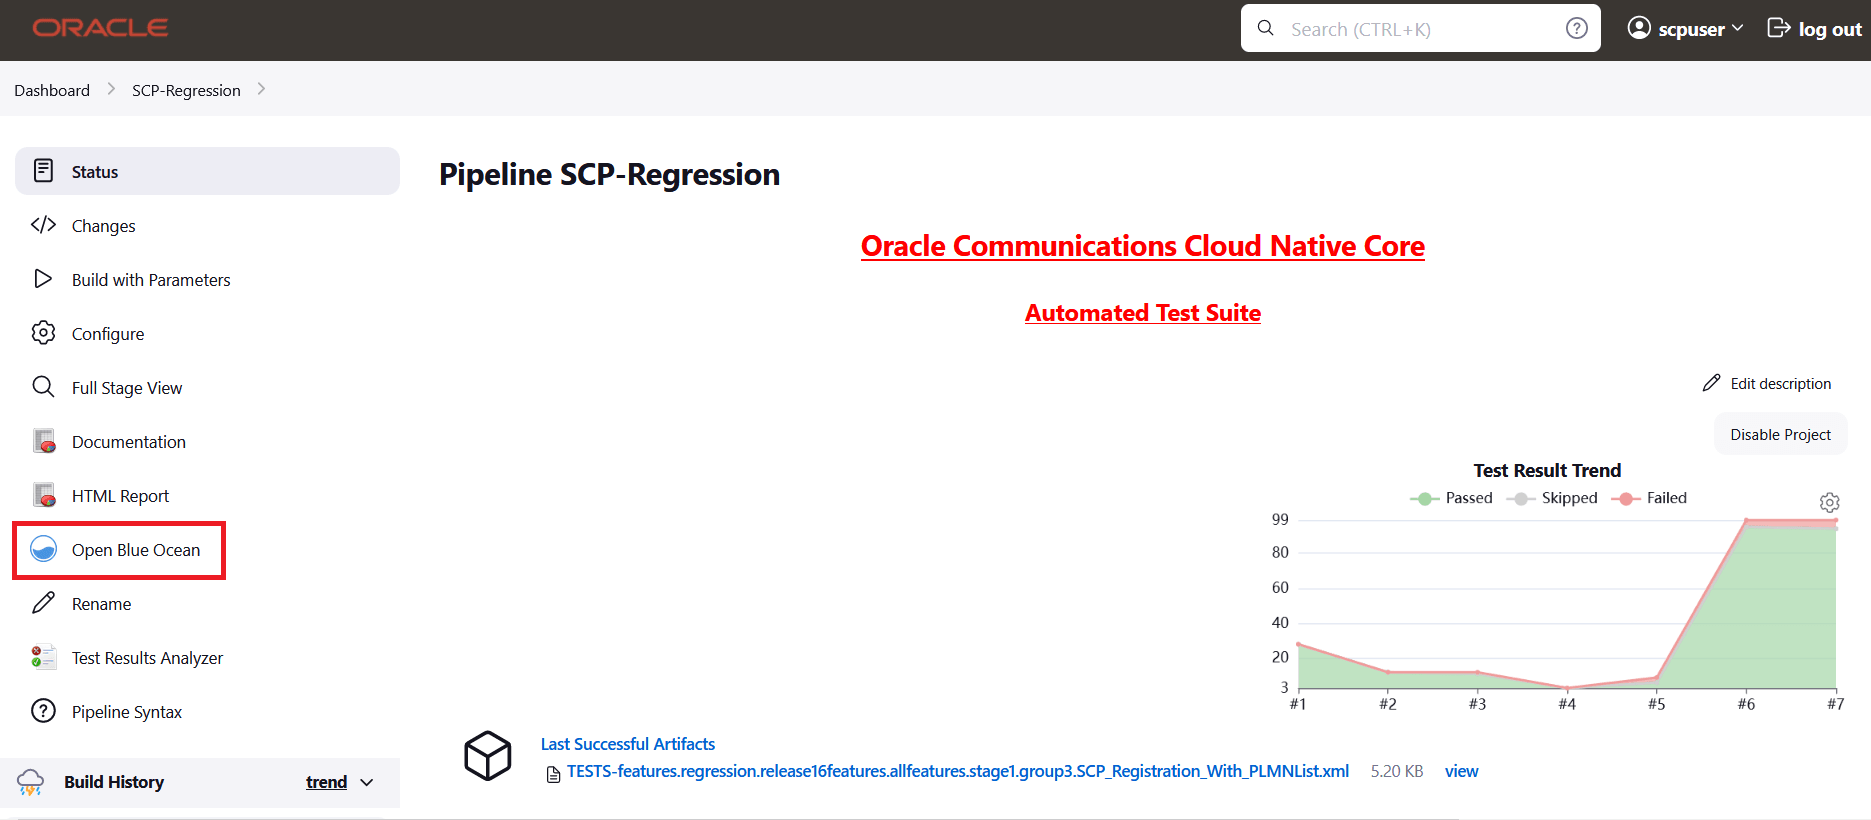
- On the Jenkins pipeline page, click Open Blue Ocean in the left
navigation pane.
Figure 2-26 Jenkins Pipeline Page
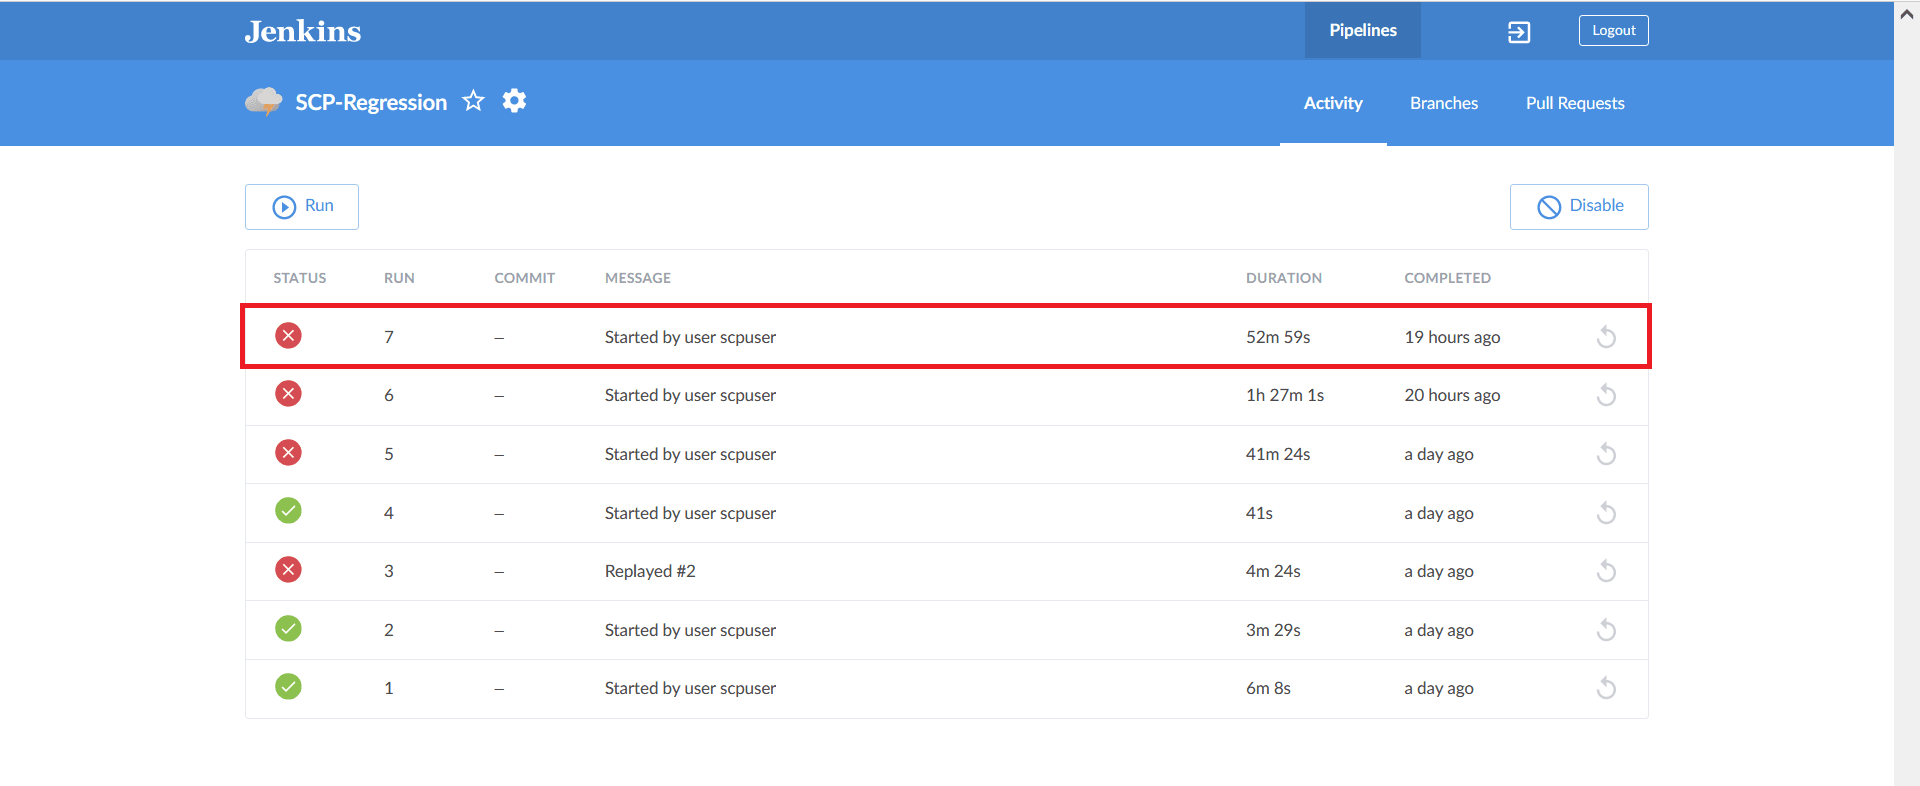
- Click the desired build row on the Blue Ocean page.
Figure 2-27 Run the Build
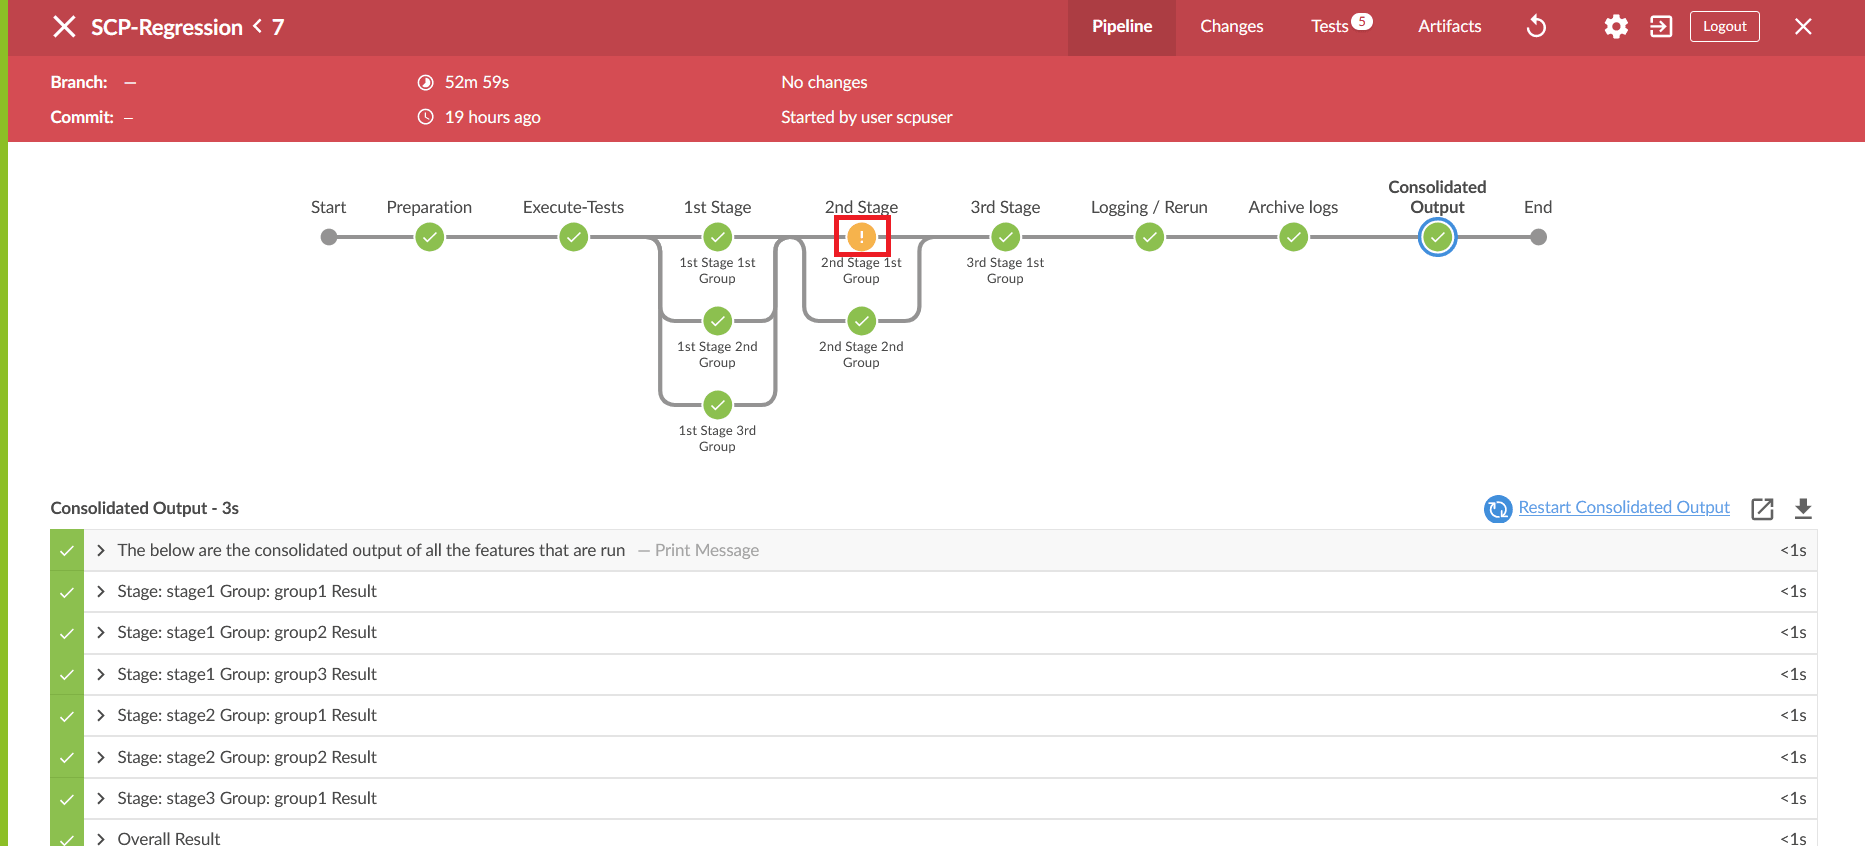
- The selected build appears. The diagram displays the order in which the
different stages, or groups, are executed.
Figure 2-28 Stage Execution

- Click the desired group to download the logs.
Figure 2-29 Executed Groups
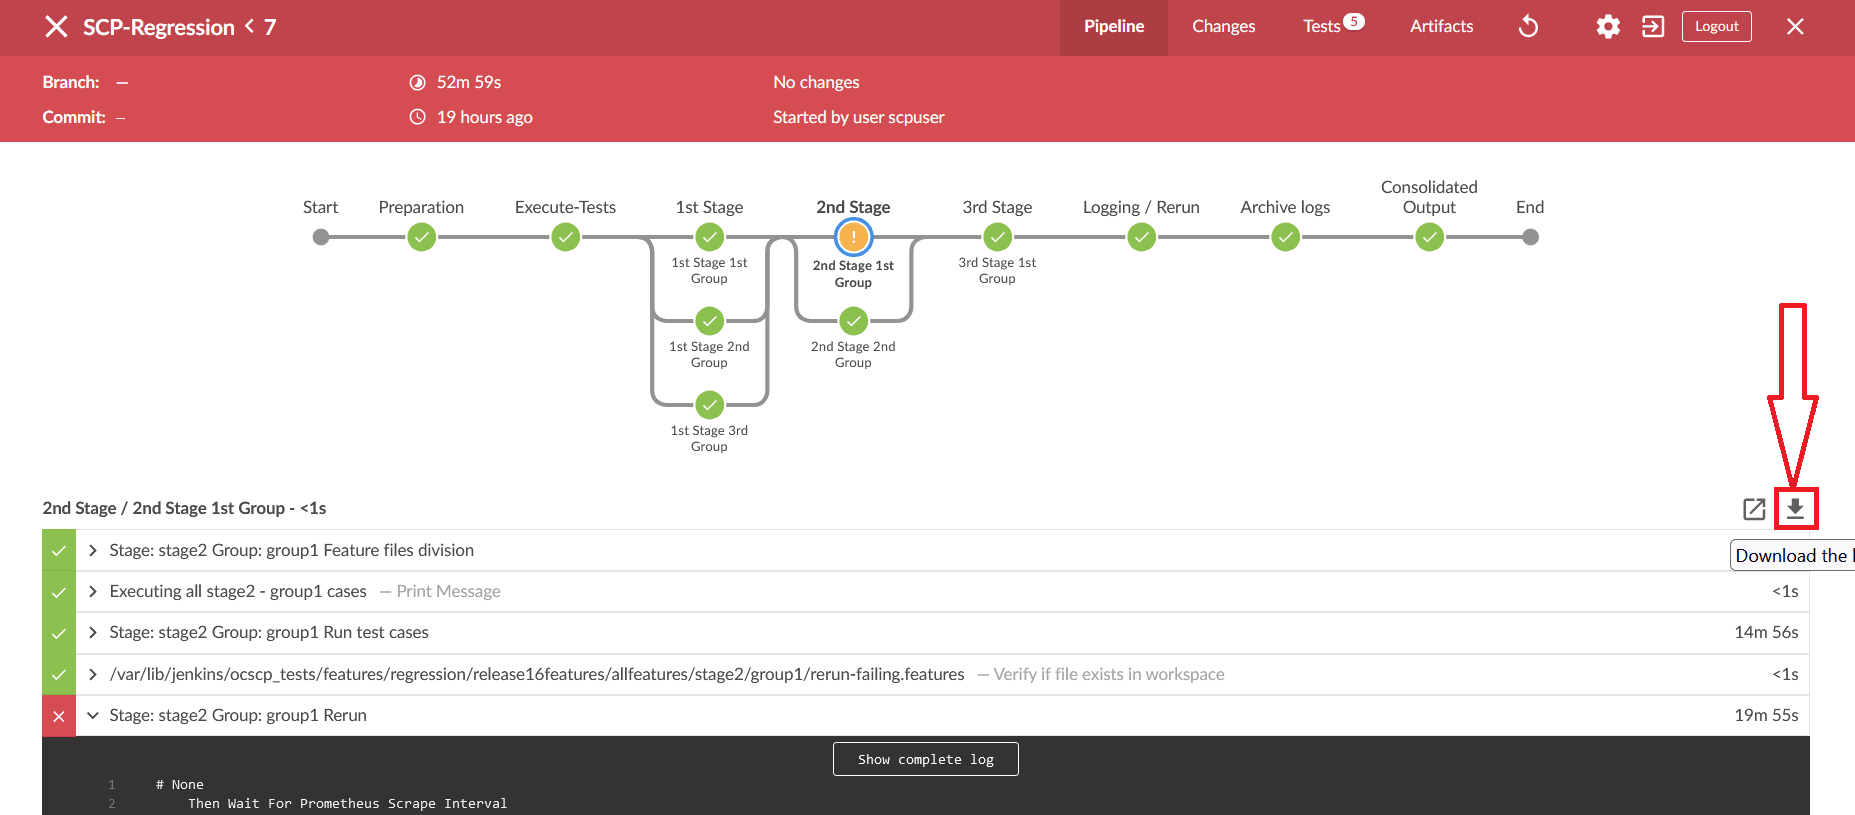
- Click the Download icon on the bottom right of the pipeline. The log for
the selected group is downloaded to the local system.
Figure 2-30 Download Logs
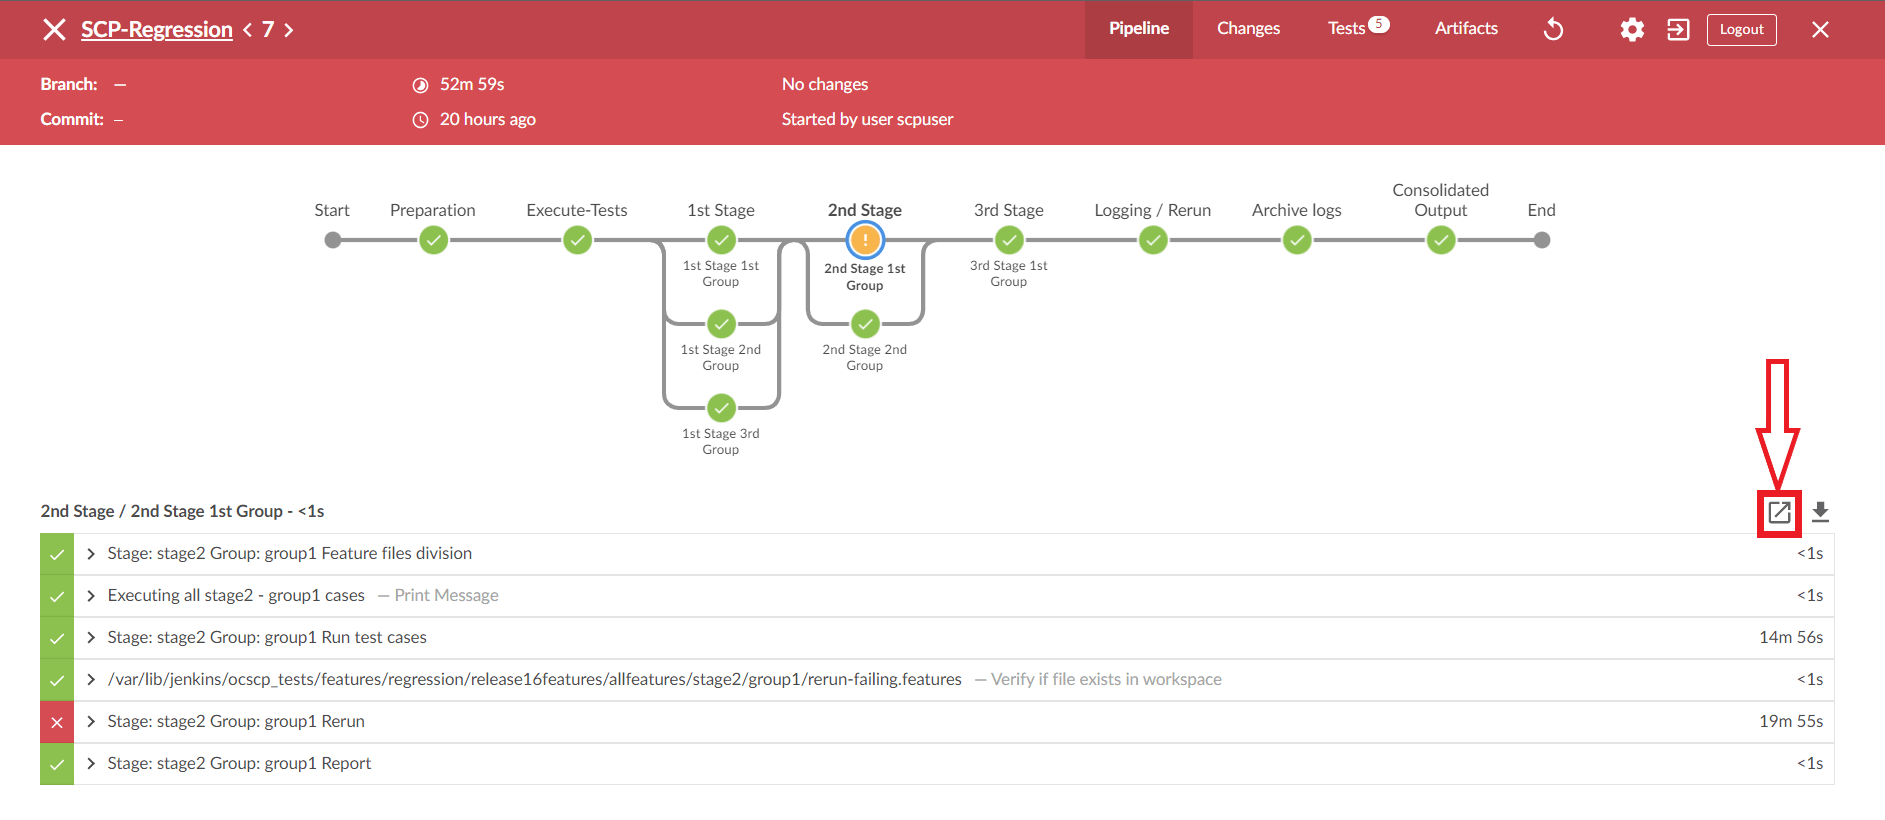
- To view the log, click the Display Log icon. The logs are displayed in a
new window.
Figure 2-31 Display Logs
Viewing Individual Group Logs without using Blue Ocean
- Using Stage View
- On the Jenkins pipeline page, hover the cursor over the group in stage view to view the logs.
- A pop-up with the label "Logs" will appear. Click on it.
- There will be a new pop-up window.It contains many rows, where each row corresponds to the execution of one Jenkins step.
- Click on the row labelled Stage: stage_name>."Group: <group_name> Run test cases to view the log for this group's execution.
- Click on the row labelled Stage: stage_name>." "group_name> Rerun to display the re-run logs.
- Using Pipeline Steps Page
- On the Jenkins pipeline page, under the Build History dropdown, click on the desired build number.
- Click the Pipeline Steps button on the left pane.
- A table with columns for step, arguments, and status appears.
- Under the Arguments column, find the label for the desired stage and group.
- Click on the step with the label Stage: <stage_name> Group: <group_name> Run test cases under it or click the Console output icon near the status to view the log for this group execution.
- To see rerun logs, find the step with the label Stage: <stage_name> Group: <group_name> Rerun under it.
2.13 Parameterization
This feature enables users to provide or adjust values for the input and output parameters needed for the test cases to be compatible with SUT configuration. Users can update or adjust the key-value pair values in the global.yaml and feature.yaml files for each of the feature files so that it is compatible with SUT configuration. In-addition to the existing custom test case folders (Cust New Features, Cust Regression, and Cust Performance), this feature enables folders to accommodate custom data, default product configuration, and custom configuration. Users can maintain multiple versions or copies for the custom data folder to suite to varied or custom SUT configurations. With this feature ATS GUI has an option to either execute test cases with default product configuration or with custom configuration.
- Provides ability to define parameters and assign/adjust values to them so as to be compatible with SUT configuration.
- Provides ability to execute test cases either with default product configuration or custom configuration(s) - multiple custom configurations to match with varied SUT configurations.
- Simplified way to assign or adjust values (for input / output parameters) thru custom or default configuration yaml files (key-value pair files).
- Each feature file having its corresponding configuration file where-in the values for its input or output parameters can be defined or adjusted.
- Ability to create and maintain multiple configuration files to match multiple SUT configurations.
Figure 2-32 SUT Design Summary

The Parameterization feature enables users to provide or adjust values for the input and output parameters needed for the test cases to be compatible with SUT configuration. Users can update or adjust the key-value pair values in the global.yaml and feature.yaml files for each of the feature files so that it is compatible with SUT configuration. In addition to custom test case folders, this feature enables custom data, default product configuration, and custom configuration folders. Users can maintain multiple versions or copies of the custom data folder to suite to varied custom SUT configurations. With this feature ATS GUI has an option to either run test cases with default product configuration or with custom configuration.
Figure 2-33 Folder Structure

- The Product Config folder contains default product configuration files (feature wise yaml per key-value pair), which are compatible with default product configuration
- New features, Regression and Performance, Data folder, and Product Config folders are replicated or copied into custom folders and delivered as part of ATS package in every release
- The user can customize custom folders by:
- Removing test cases not needed or as appropriate for users use
- Adding new test cases as needed or as appropriate for users use
- Removing or adding data files in the cust data folder or as appropriate for users use
- Adjusting the parameters or values in the Key-value pair per yaml files in the custom config folder for test cases to run or pass with custom configured SUT
- The Product folders are always in-tact (unchanged) and the user can update the Custom folders
- The user can maintain multiple copies of Custom Configurations and can bring them to use needed or as appropriate for the SUT configuration
To Enable
For ATS to run the test cases with a particular custom configuration, rename or copy the Cust Config [1/2/3/N] folder to Cust Config folder. It always point to the Cust Config folder when selected to run test cases with custom configuration.
To Run ATS Test Cases
- If custom configuration is selected, then test cases from custom folders are populated on ATS UI and custom configuration is applied to them through the key-value pair per yaml files defined or present in the "Cust Config" folder.
- If product configuration is selected, then the test cases from product folders are populated on ATS UI and product configuration is applied to them through key-value pair per yaml files defined or present in the Product Config folder.
Figure 2-34 ATS Execution Flow
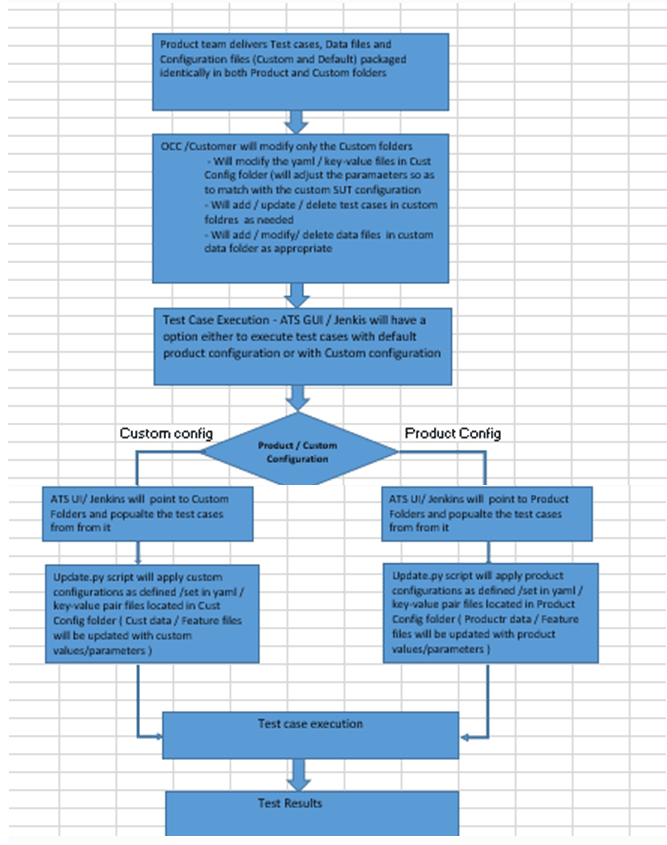
Figure 2-35 Sample: Configuration_Type

2.14 PCAP Log Collection
PCAP Log Collection allows collecting the NF, SUT, or PCAP logs from the debug tool side car container. This feature can be integrated and delivered as standalone or can be delivered along with the Application Log Collection feature. For information on Application Log Collection, see Application Log Collection.
Figure 2-36 PCAP Logs Selection Option

- The Debug tool should be enabled on SUT Pods while deploying the NF. The current name of the container is Tools.
- Enable the pods/exec API group within the ATS service-account. Following are the ATS
mandatory resource requirements:
CPU: 3
memory: 3GI
- Once ATS is deployed, refer the
pre-TestConfig.shscript to have the Jenkins variables. - Refer the framework related changes in the development branch
cleanup.py. - Incorporate the
copyremotefile.javaand theabortclean.pyscripts in the NF specific folder. - Have the
pcaplogsfolder cleanup in the archive log stage as below:stage ('Archive logs') { steps { sh ''' cd $JENKINS_HOME/jobs/$JOB_NAME/builds/$BUILD_NUMBER/ [ -d $JENKINS_HOME/jobs/$JOB_NAME/builds/$BUILD_NUMBER/pcaplogs ] && zip -r pcaplogs.zip pcaplogs/ rm -rf /var/lib/jenkins/.jenkins/jobs/$JOB_NAME/builds/$BUILD_NUMBER/pcaplogs ''' } } post { aborted { script{ sh '/env/bin/python3 /var/lib/jenkins/<NF-FOLDER>/abortclean.py' } } always { /* Existing Code */ } } - Add the new Active choice Reference parameter for the pipeline jobs (single
select).
return [
"YES:selected",
"NO"
]
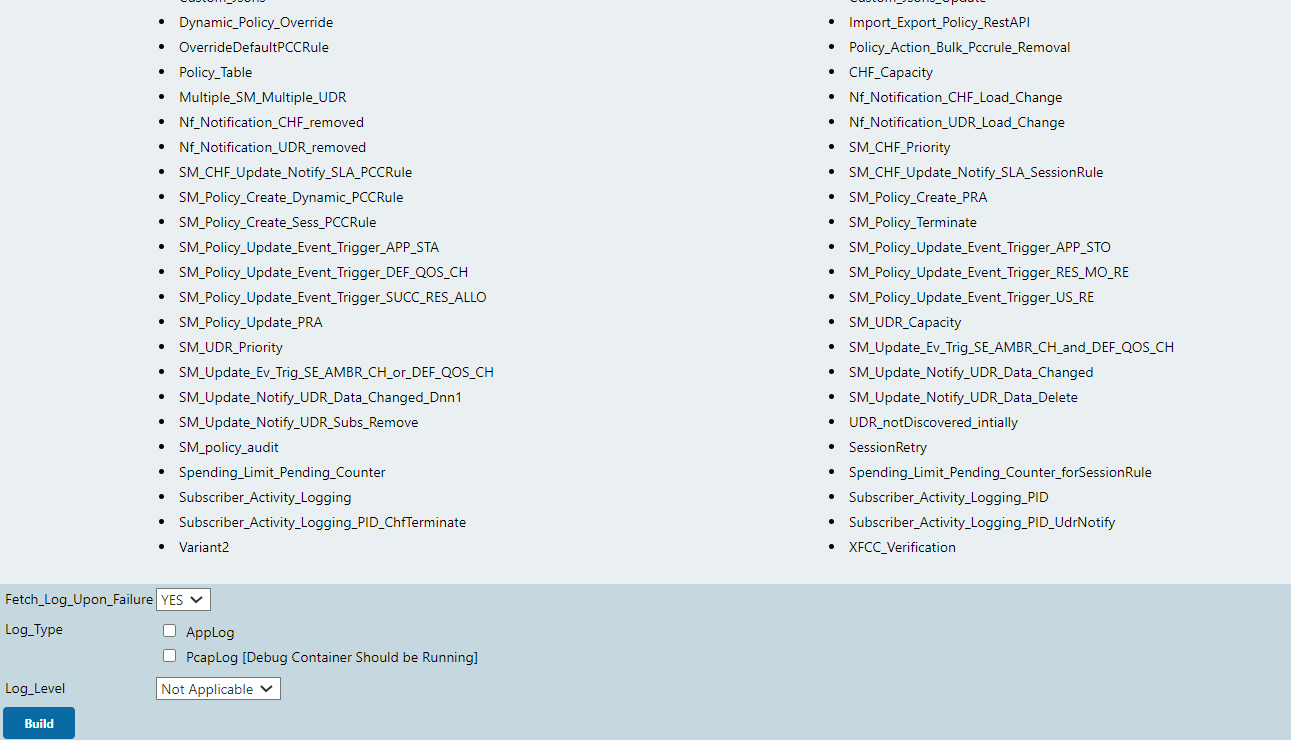
Figure 2-37 Application Logs and PCAP Logs Selection
- The Debug tool should be enabled on SUT Pods while deploying the NF. The current name of the container is Tools.
- Enable the pods/exec API group within ATS service-account. Following are the ATS
mandatory resource requirements:
CPU: 3
memory: 3GI
- Once ATS is deployed, refer the
preTestConfig.shscript to have the Jenkins variables. - Refer the framework related changes in the development branch
cleanup.py. - Incorporate the
copyremotefile.javaandabortclean.pyscripts in the NF specific folder. - Have the
pcaplogs applogfolder cleanup in the archive log stage as below:stage ('Archive logs') { steps { sh ''' cd $JENKINS_HOME/jobs/$JOB_NAME/builds/$BUILD_NUMBER/ [ -d $JENKINS_HOME/jobs/$JOB_NAME/builds/$BUILD_NUMBER/pcaplogs ] && zip -r pcaplogs.zip pcaplogs/ rm -rf /var/lib/jenkins/.jenkins/jobs/$JOB_NAME/builds/$BUILD_NUMBER/pcaplogs [ -d $JENKINS_HOME/jobs/$JOB_NAME/builds/$BUILD_NUMBER/applog ] && zip -r applogs.zip applog/ rm -rf /var/lib/jenkins/.jenkins/jobs/$JOB_NAME/builds/$BUILD_NUMBER/applog ''' } } post { aborted { script{ sh '/env/bin/python3 /var/lib/jenkins/<NF-FOLDER>/abortclean.py' } } always { /* Existing Code */ } } - Add the three new Active choice Reference parameter for the pipeline jobs:
- Fetch_Log_Upon_Failure
return [ "YES:selected", "NO" ] - Log_Type
if(Fetch_Log_Upon_Failure.equals("NO")) { return ["Not Applicable:selected"] } else { return [ "AppLog", "PcapLog [Debug Container Should be Running]" ] } - Log_Level
if(Fetch_Log_Upon_Failure.equals("NO"))
{
return ["Not Applicable:selected"]
}
else
{
return [
"WARN:selected",
"INFO",
"DEBUG",
"ERROR",
"TRACE"
]
}
- Fetch_Log_Upon_Failure
2.15 Persistent Volume for 5G ATS
With the introduction of Persistent Volume, 5G ATS can retain historical build execution data, test cases, and ATS environment configurations.
ATS Packaging When Using Persistent Volume
- Without Persistent Volume option: ATS package includes ATS Image with test cases.
- With Persistent Volume option: ATS package includes ATS image
and test cases separately. The new test cases are provided between the
releases.
To support both with and without Persistent Volume options, test cases and execution jobs data are packaged in the ATS image as well as tar file.
Process Flow
First Time Deployment
Initially when you deploy ATS (Example: PI-A ATS pod), you use PVC-A, which is provisioned and mounted to PI-A ATS pod. By default, the PVC-A is empty. So, you have to copy the data (ocslf_tests and jobs folder) from the PI-A tar file to the pod after the pod is up and running. Then, restart the PI-A pod. At this point, you can change the number of build logs to maintain in the ATS GUI.
Subsequent Deployments
When you deploy ATS for the subsequent time (Example: PI-B ATS pod), you use PVC-B, which is provisioned and mounted to PI-B ATS pod. By default, the PVC-B is empty and you have to copy the data (ocslf_tests and jobs folder) from the PI-B tar file to the pod after the pod is up and running. At this point, copy all the necessary changes to the PI-B pod from the PI-A pod and restart the PI-B pod. You can change the number of build logs to maintain in the ATS GUI. After updating the number of builds, you can delete the PI-A pod and can continue to retain the PVC-A. If you do not want backward porting, you can delete PVC-A.
Deploying Persistent Volume
Pre-installation Steps
- Before deploying Persistent Volume, create a PVC in the same
namespace where you have deployed ATS. You have to provide value for the
following parameters to create a PVC:
- PVC Name
- Namespace
- Storage Class Name
- Size of the PV
- Run the following command to create a
PVC:
kubectl apply -f - <<EOF

apiVersion: v1
kind: PersistentVolumeClaim
metadata:
  name: <Please Provide the PVC Name>
  namespace: <Please Provide the namespace>
  annotations:
spec:
  storageClassName: <Please Provide the Storage Class Name>
  accessModes:
    - ReadWriteOnce
  resources:
    requests:
      storage: <Please Provide the size of the PV>
EOF
Note:
It is recommended to suffix the PVC name with the release version to avoid confusion during the subsequent releases. Example: ocats-slf-pvc-1.9.0 - The output of the above command with parameters is as
follows:
[cloud-user@atscne-bastion-1 templates]$ kubectl apply -f - <<EOF > > apiVersion: v1 > kind: PersistentVolumeClaim > metadata: > name: ocats-slf-1.9.0-pvc > namespace: ocslf > annotations: > spec: > storageClassName: standard > accessModes: > - ReadWriteOnce > resources: > requests: > storage: 1Gi > EOF persistentvolumeclaim/ocats-slf-1.9.0-pvc created - To verify whether PVC is bound to PV and is available for use, run the following
command:
kubectl get pvc -n <namespace used for
                            pvc creation>
The output of the above command is as follows:Figure 2-38 Verifying PVC
 In the above screenshot, verify that the STATUS is 'Bound' and rest of the parameters like NAME, CAPACITY, ACCESS MODES, STORAGECLASS etc are same as mentioned in the PVC creation command.
Note:
Do not proceed further if there is any issue with PV creation. Contact your administrator to create a PV. - After creating persistent volume, change the following parameters
in the values.yaml file (at ocats-udr location) to deploy persistent volume.
- Set the PVEnabled parameter to "true".
- Provide the value for PVClaimName parameter. The PVClaimName value should be same as used to create a PVC.
Post-Installation Steps
- After deploying ATS, copy the <nf_main_folder> and <jenkins jobs>
folders from the tar file to their ATS pod and then, restart the pod as one time
activity.
- Run the following command to extract the tar file:
ocats-<nf_name>-data-<release-number>.tgzNote:
The ats_data.tar file is the name of the tar file containing <nf_main_folder> and jobs folder. It can be different for different NFs. - Run the following set of commands to copy the required
folders:
kubectl cp ats_data/jobs
                                    <namespace>/<pod-name>:/var/lib/jenkins/.jenkins/
kubectl cp ats_data/<nf_main_folder> <namespace>/<pod-name>:/var/lib/jenkins/ -
Run the following command to restart the pods as one time activity.
Note:
Before running the following command, copy the changes done on the new release pod from the old release pod using kubectl cp command. [Applicable in case of subsequent deployment only]kubectl delete po <pod-name> -n <namespace>
- Run the following command to extract the tar file:
- Once the pod is up and running, log in to the ATS GUI and go to your
NF specific pipeline. Click Configure in the left navigation pane. The
General tab appears. Configure the Discard old Builds option.
This option allows you to configure the number of builds you want to retain in
the persistent volume.
Figure 2-39 Discard Old Builds

Note:
It is recommended to configure this option. If you do not enter any value for this option, then the application considers all the builds, which can be a huge number leading to complete consumption of Persistent Volume.
Backward Porting (deployment procedure for old release PVC supported ATS Pod)
Note:
This procedure is for backward porting purpose only and should not be considered as the subsequent release of POD deployment procedure.- Change the PVEnabled parameter to "true"
- Provide the name of the old PVC as the value for parameter PVClaimName
2.16 Test Results Analyzer
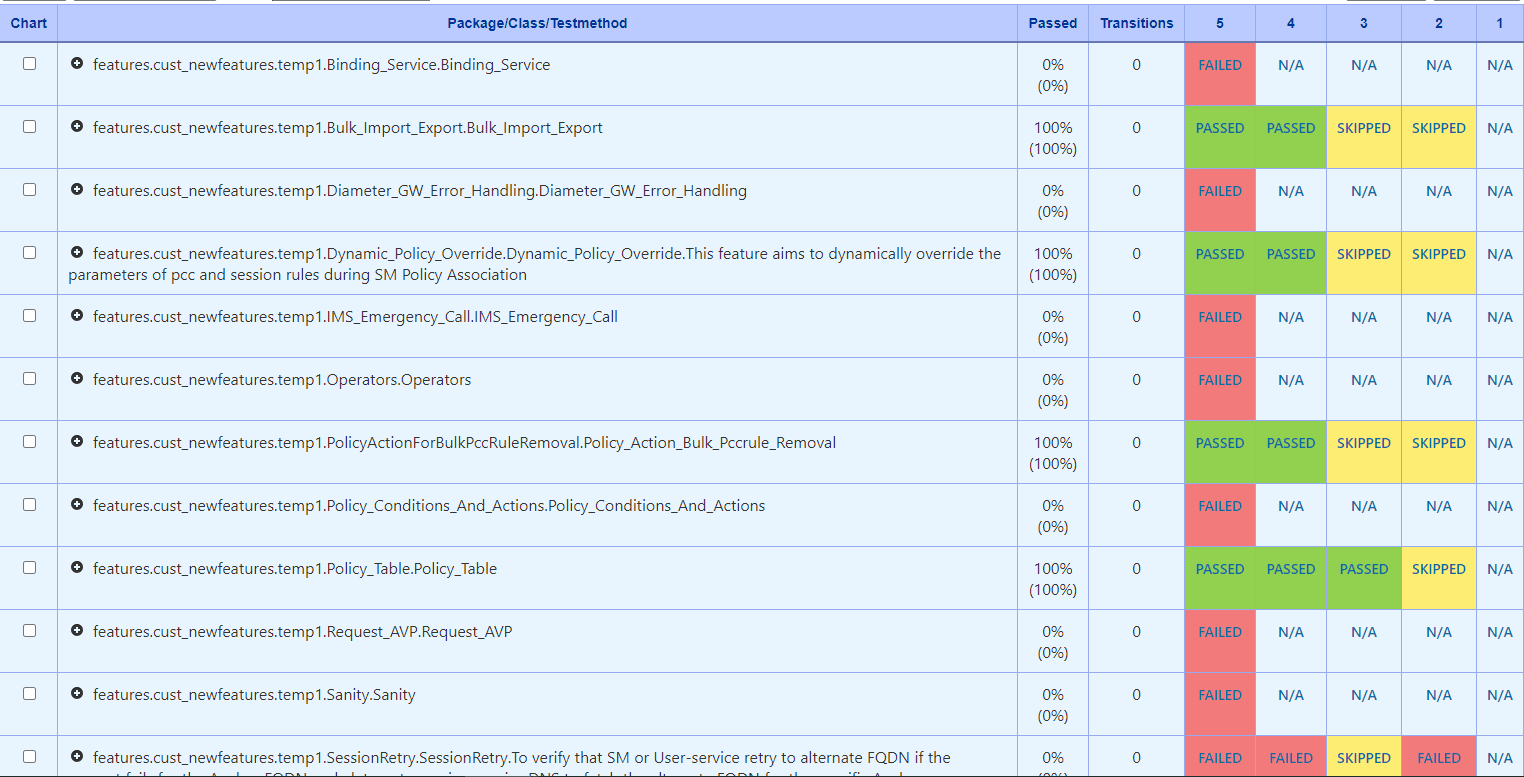
The Test Results Analyzer is a plugin available in ATS to view the Pipeline test results based on XML reports. It provides the test results report in a graphical format, which includes consolidated and detailed stack trace results in case of any failures. It allows you to navigate to each and every test.
- PASSED: If the test case passes
- FAILED: If the test case fails
- SKIPPED: If the test case is skipped
- N/A: If the test cases is not executed in the current build
Accessing Test Results Analyzer Feature
- From the NF home page, click any new feature pipeline or regression pipeline where, you want to run this plugin.
- In the left navigation pane, click Test Results
Analyzer.
When the build completes, the test result report appears. A sample test result report is shown below:
Figure 2-40 Test Results Analyzer Option
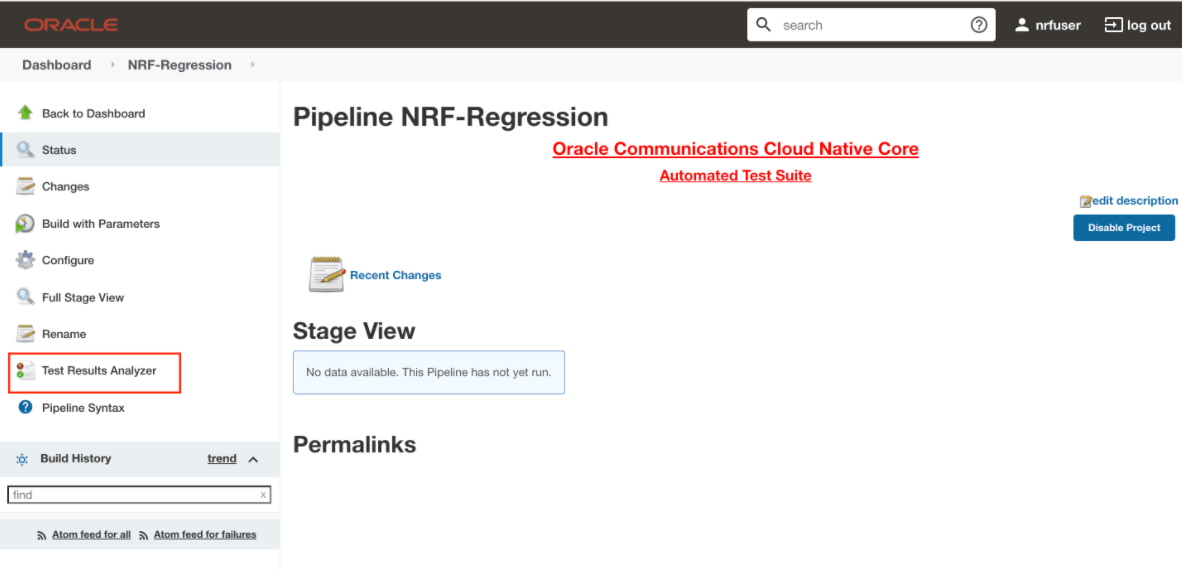
Figure 2-41 Sample Test Result Report
- Click any one of the statuses (PASSED, FAILED, SKIPPED) to view
respective feature detail status report.
Note:
For N/A status, detailed status report is not available.Figure 2-42 Test Result

Figure 2-43 Test Result

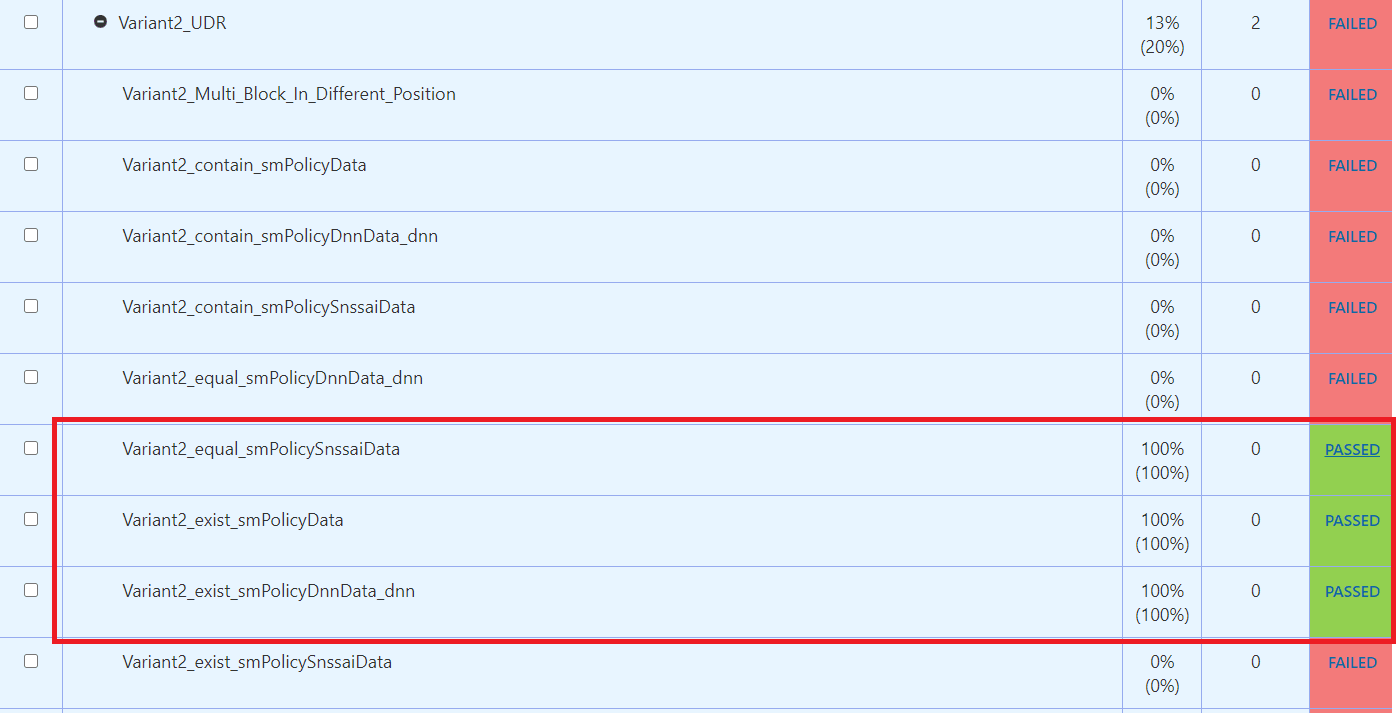
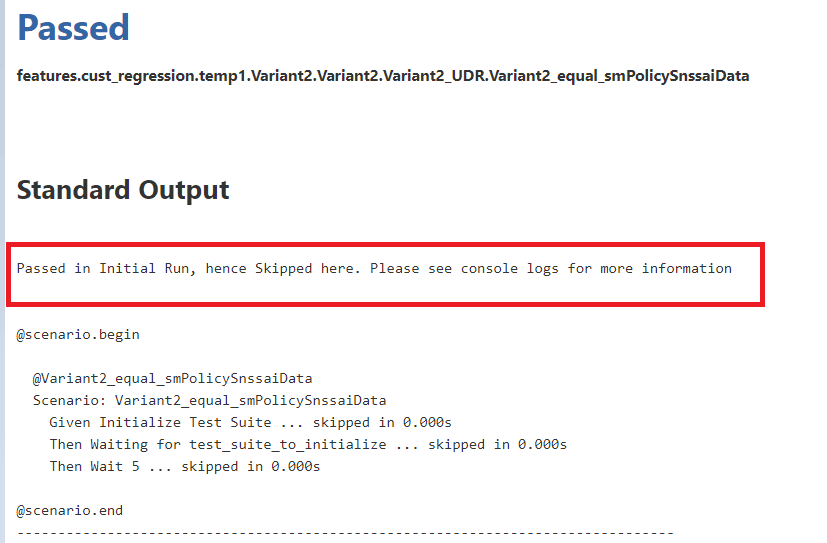
- In case of rerun, the test cases passed in main run but skipped
in rerun are considered as 'Passed' in the Test Result Analyzer Report. The
following screenshot depicts the Scenario,
"Variant2_equal_smPolicySnssaiData,Variant2_exist_smPolicyData,Variant2_exist_smPolicyDnnData_dnn"
where the test cases passed in main run but skipped in rerun are considered
as 'PASSED' in general.
Figure 2-44 Test Results
 Click 'Passed'. The following highlighted message means the test case is passed in the main run but skipped in rerun.
Figure 2-45 Test Result Info
2.17 Supports Test Case Mapping and Count
The 'Test Case Mapping and Count' feature displays total number of features, test cases or scenarios and its mapping to each feature in the ATS GUI.
Accessing Test Case Mapping and Count Feature
- On the NF home page, click any new feature or regression pipeline, where you want to use this feature.
- In the left navigation pane, click Build with
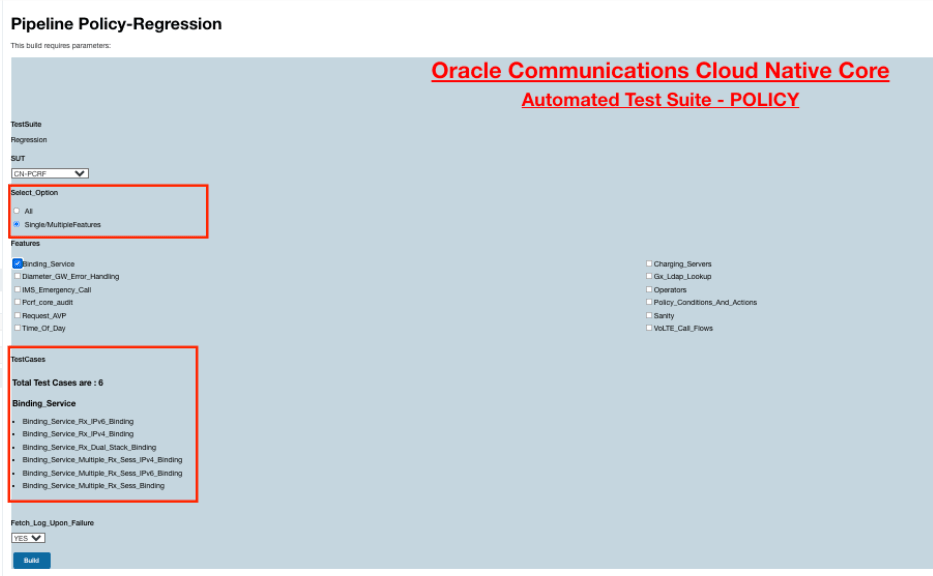
Parameters. The following image appears:
Figure 2-46 Test Case Mapping
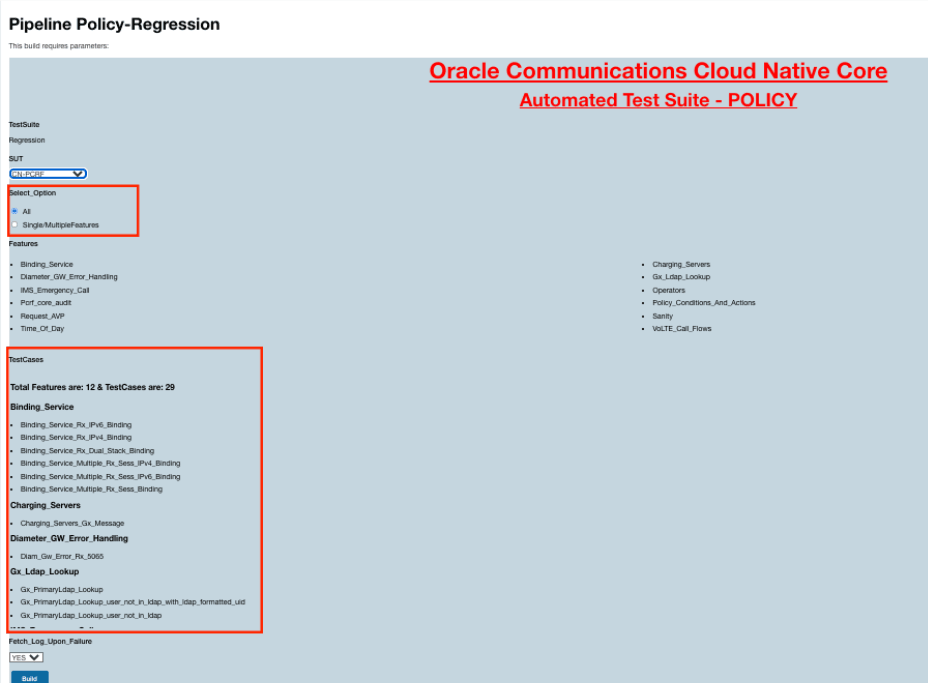
In the above image, when Select_Option is selected as 'All', the TestCases details mapped to each feature appears.
If you select the Select_Option as 'Single/MultipleFeatures', the test cases details appear as follows:Figure 2-47 Test Cases Details When Select_Option is Single/MultipleFeatures
