8 Configuring OCNWDAF Using CNC Console
This chapter describes how to access OCNWDAF GUI using Oracle Communications Cloud Native Configuration Console (CNC Console).
This chapter describes how to configure different global and service parameters in Oracle Communications Networks Data Analytics Function (OCNWDAF) using the CNC Console application. OCNWDAF provides a console interface using the highly secure GUI service, which allows you to use an interactive interface for interacting with the other OCNWDAF services.
8.1 OCNWDAF GUI Login
The OCNWDAF Graphical User Interface (GUI) can be accessed only after logging into the CNC Console application. To log in successfully into CNC Console, ensure that the CNC Console is installed. For more information see "Installing OCNWDAF GUI" section of Oracle Communications Networks Data Analytics Function Installation and Fault Recovery Guide.
Before logging in to the CNC Console application, create a user name and password. For more information on user name creation see, Cloud Native Configuration Console User Guide, "Configuring CNC Console IAM" section.
Using these login credentials, you can log in to the CNC Console.
- Open a web browser and enter the URL:
http://cncc-core-ingressgateway. cncc.svc.cluster.local:port number/and press Enter.Note:
port number is thecncc-iam-ingress-portnumber.The login page opens.
Figure 8-1 CNC Console Login
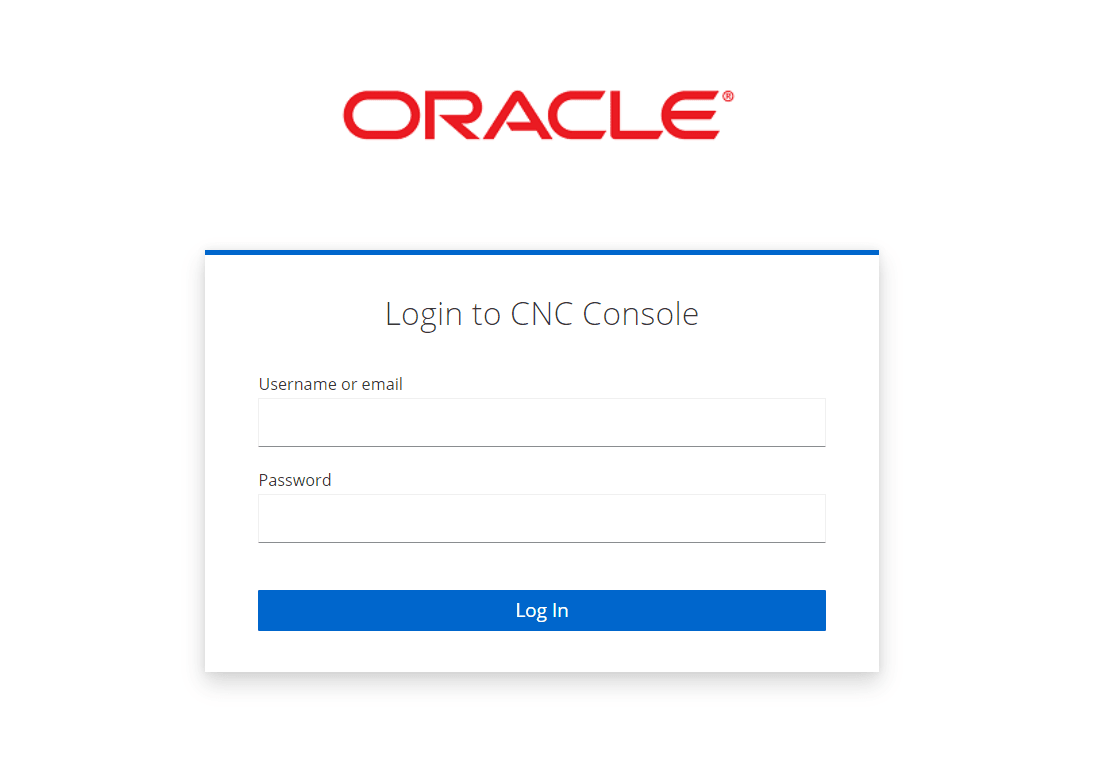
- Enter the Username and Password.
- Click Log In.
- On the Console home page, select OCNWDAF instance from the Please Select Instance drop-down field.
On a new browser tab, the Network Overview page appears.
8.2 Network Overview Screen
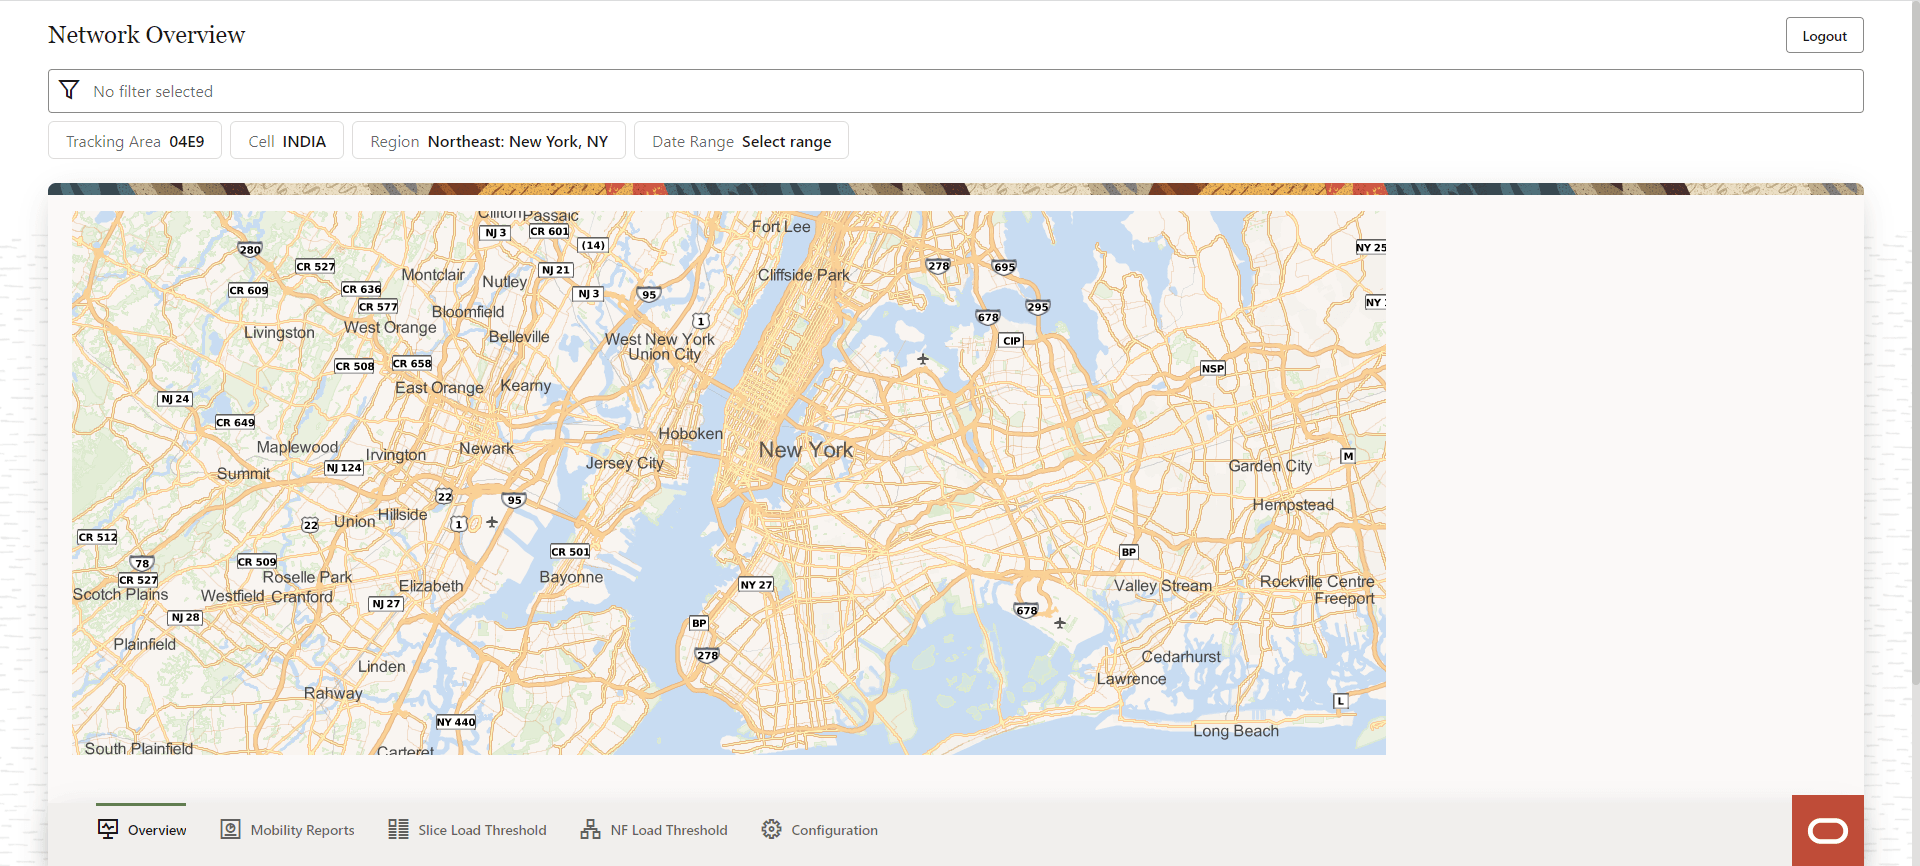
The Network Overview displays the overview of the network and allows the user to perform the following actions:
- Search: A search bar is available with option to select the following filters:
- Tracking Area
- Cell
- Region
- Date Range
- Logout
- Generate Mobility Reports
- Obtain Slice Load Threshold analytics
- Obtain NF Load Threshold analytics
- Access the Configuration screen (only if the user has NWDAF_WRITE access).
The following Network Overview screen is visible to the Network Operator:
Figure 8-2 Network Overview Screen
8.3 OCNWDAF Configuration Page
To open the Configuration page, click Configuration button at the bottom of the Network Overview page.
Note:
Access to the Configuration button in the Network Overview page is available only when the user has NWDAF_WRITE access.Figure 8-3 Configuration Page
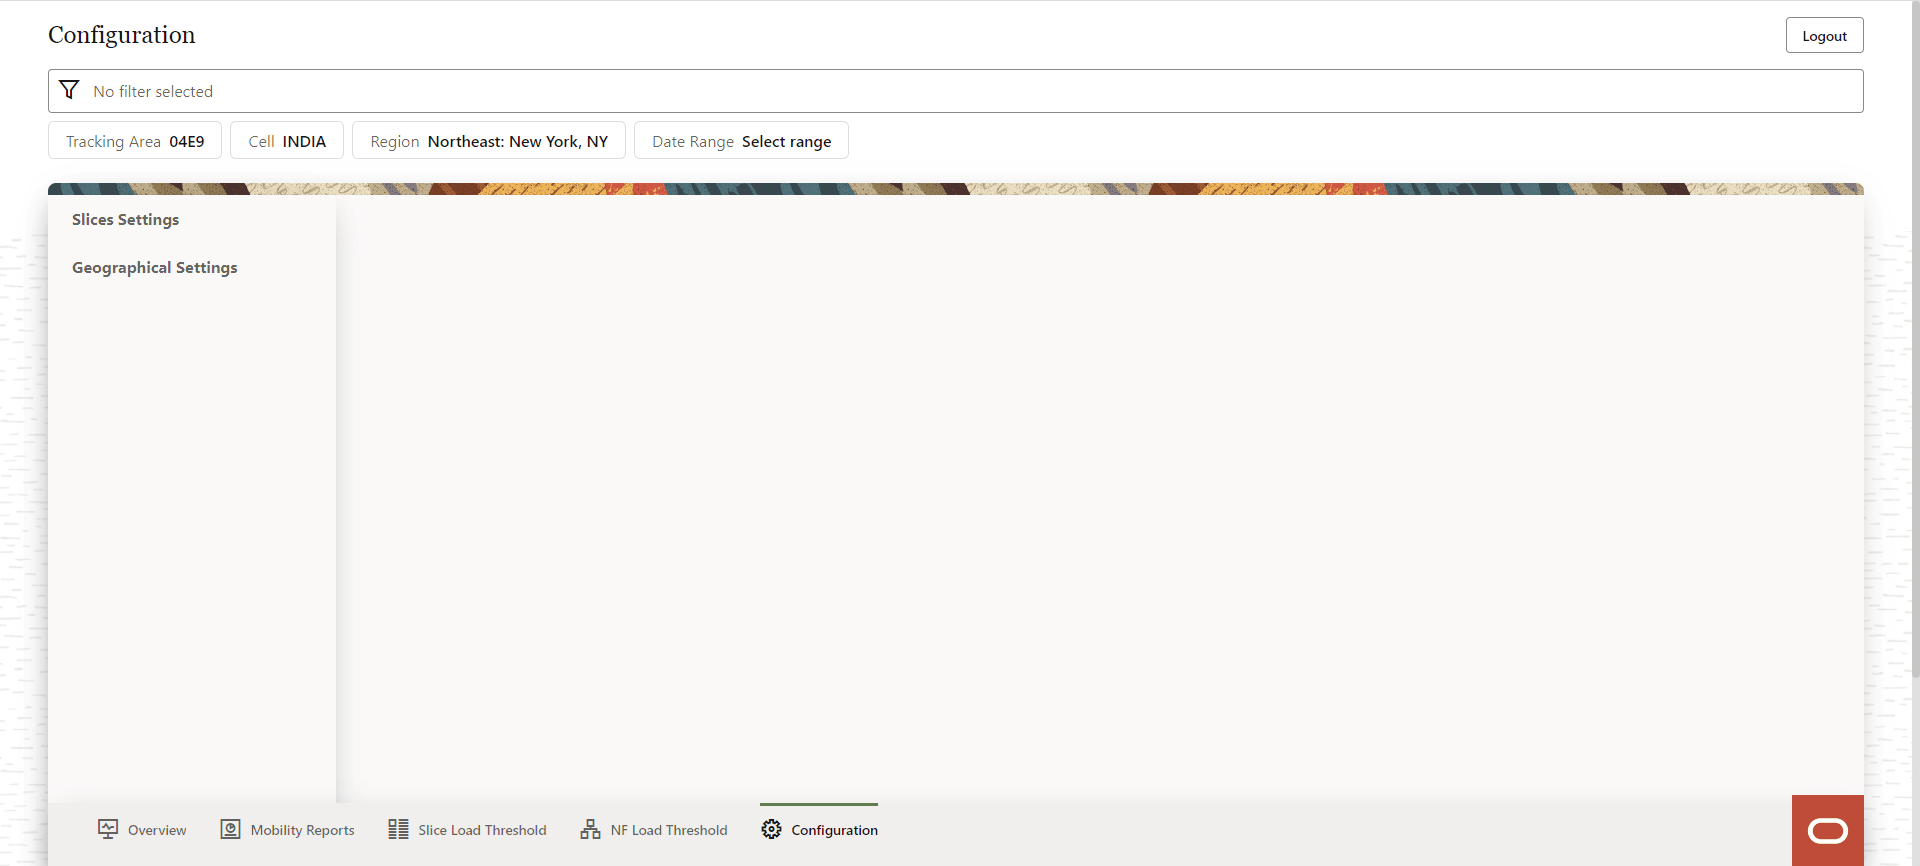
The user can perform the following actions through the Configuration page:
- Access the Slice Settings
- Access the Geographical Settings
- Logout
- Perform a search using the Search bar, by applying the following filters:
- Tracking Area
- Cell
- Region
- Date Range
8.3.1 Slices Setting Screen
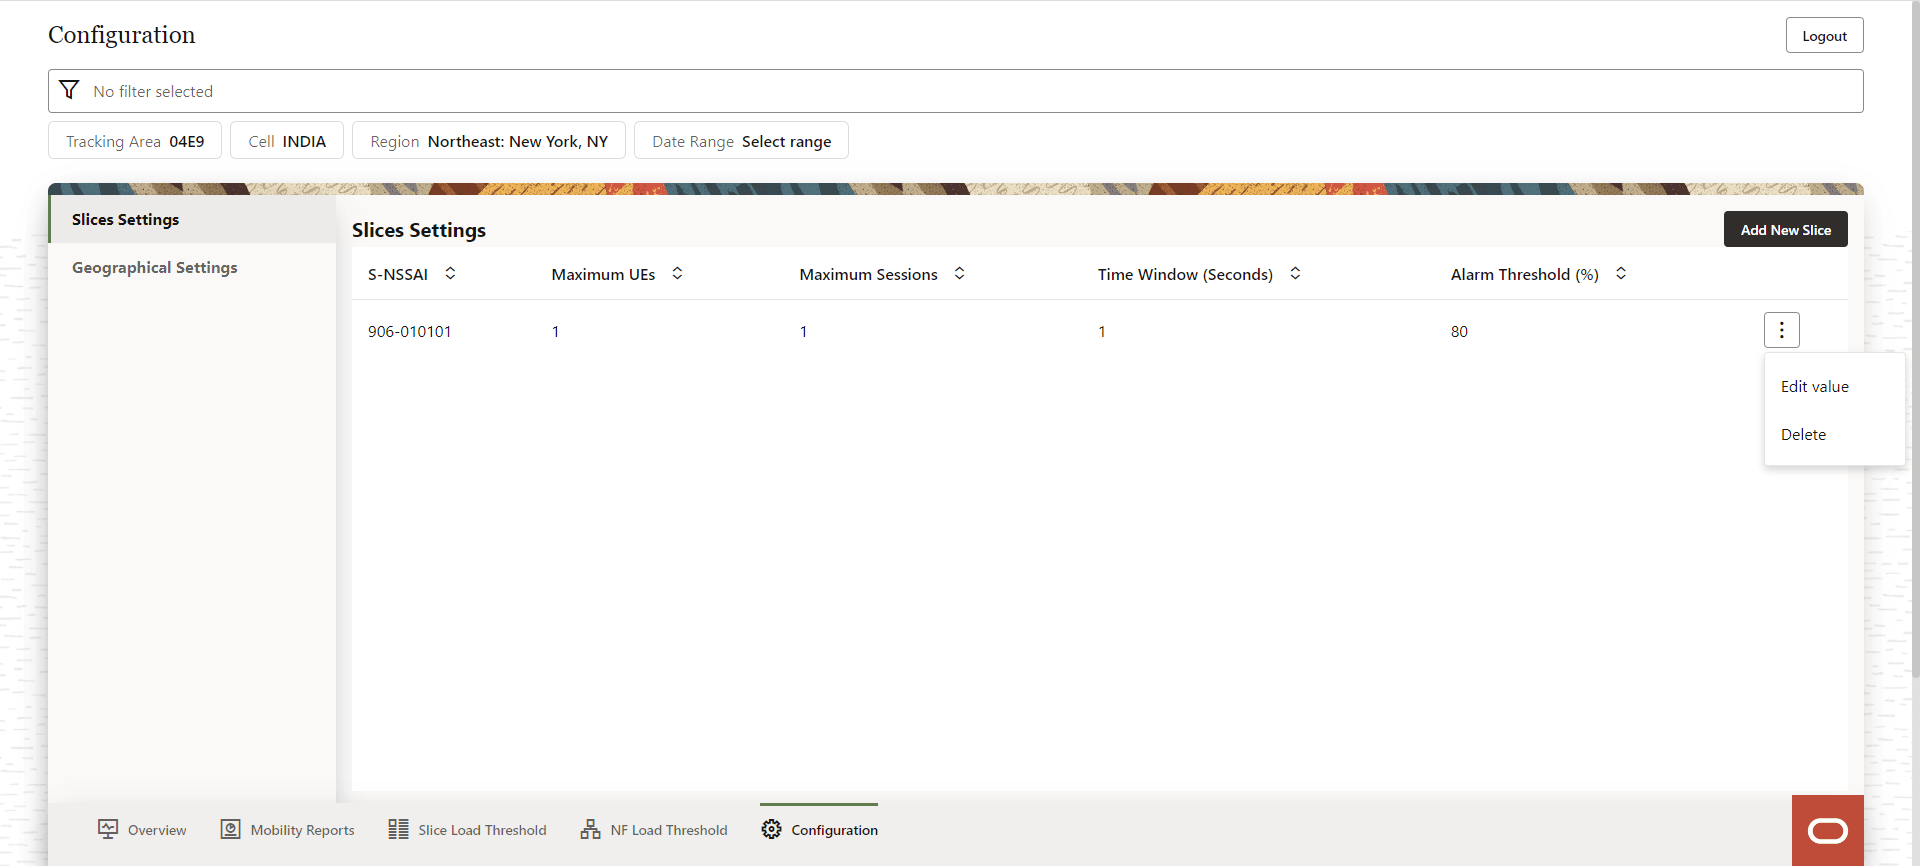
The Configuration screen displays the Slices Settings option. The user can perform the following actions on the Slices Settings screen:
- Add New Slice
- View the configured slices and the following slice parameters:
- S-NSSAI
- Maximum UEs
- Maximum Sessions
- Time Window (Seconds)
- Alarm Threshold (%)
- Modify existing slice information using the Edit Value button. This button appears as a pop up on clicking the three dot menu option on the right side of each configured slice listed on the screen.
- Delete an existing slice, using the Delete button. This button appears as a pop up on clicking the three dot menu option on the right side of each configured slice listed on the screen.
The Slices Settings screen is displayed below:
Figure 8-4 Slices Settings
8.3.1.1 Add a New Slice
To add a new slice, click Add New Slice button in the Slices Settings screen. A form with the fields to add a new slice "Add Slice", appears on the right side of the screen:
Figure 8-5 Add Slice
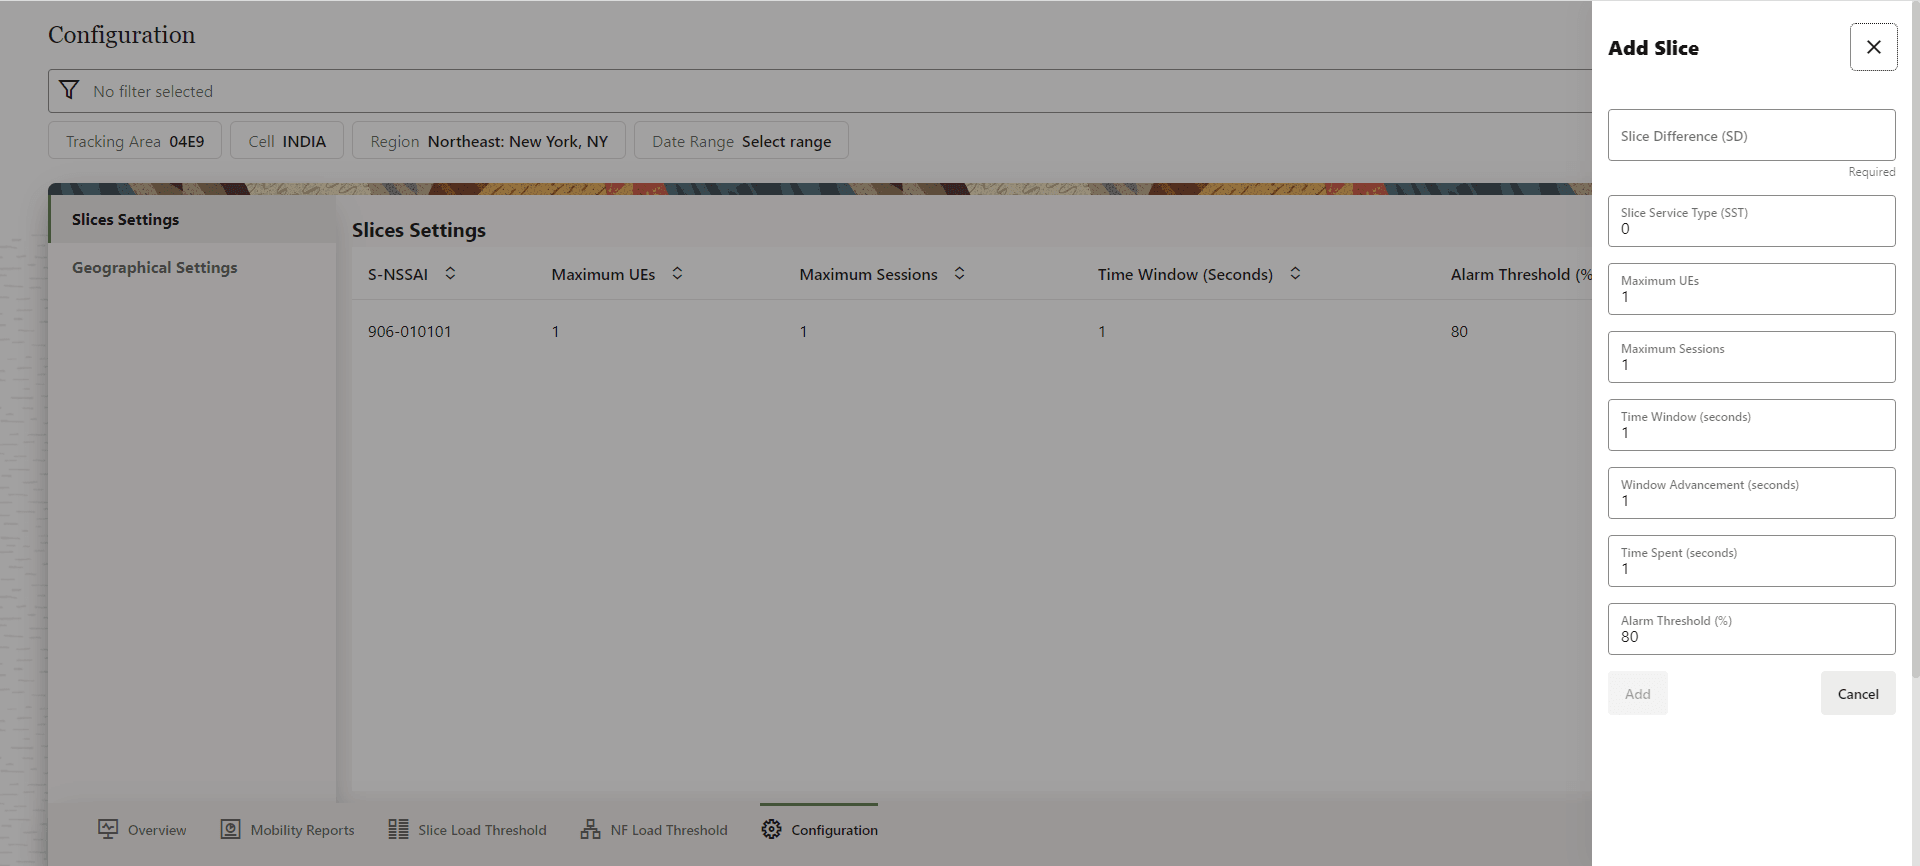
Provide the following information to create a new slice:
Table 8-1 New Slice
| Parameter | Type | Description |
|---|---|---|
| Slice Difference (SD) | String | Is a 3-octet hexadecimal number to identify different slices of the same type. |
| Slice Service Type (SST) | Unsigned integer | Value: 0 up to 127 is standardized, and 128 up to 255 is operator specific. |
| Maximum UEs | Integer | The maximum number of user equipments allowed in the slice. |
| Maximum Sessions | Integer | The maximum number of sessions allowed in the slice. |
| Time Window | Seconds | Threshold detection window time. Default: 5 minutes. |
| Window Advancement | Seconds | Threshold detection window advancement. Default: 15 seconds. |
| Time Spent | Seconds | Time spent in window opposite accepted state. Default: 80% . |
| Alarm Threshold | Percentage | Indicates the value of the Alarm Threshold. |
Click the Add button after entering all the fields to create a new slice. The new slice will be listed in the Slices Settings screen.
8.3.1.2 Delete a Slice
To delete a slice, click the three dot menu button on the right side of the slice to be deleted. A pop up appears which has an option to Delete slice.
Figure 8-6 Delete Slice

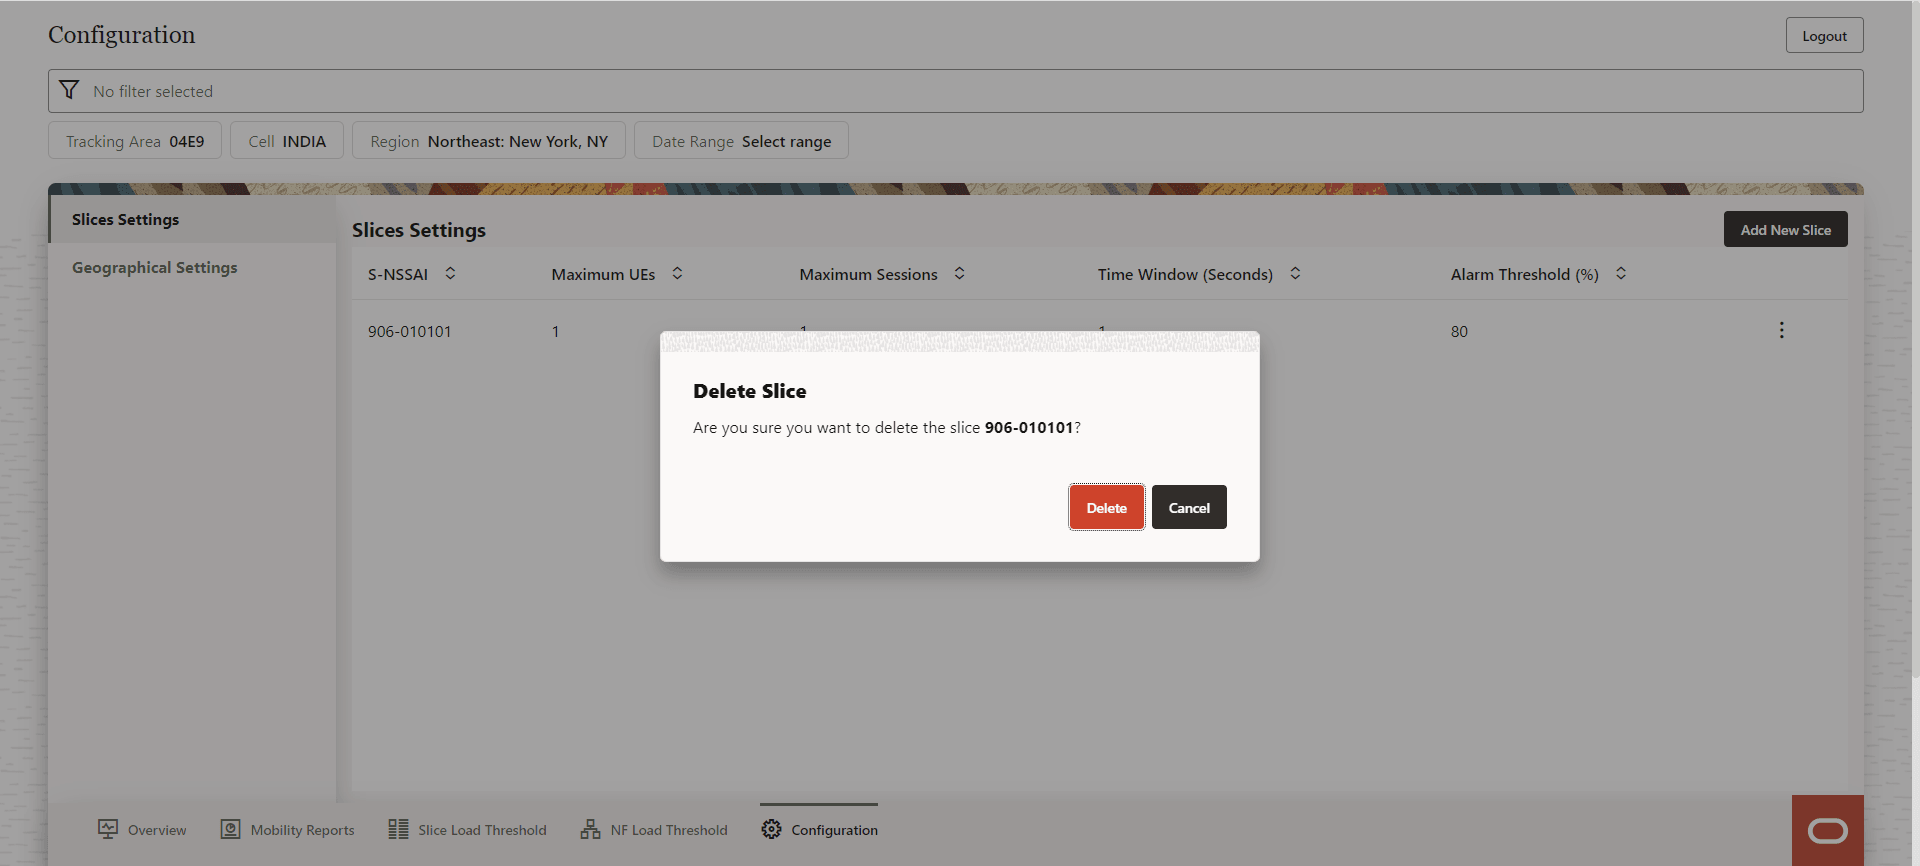
Click Delete, a Delete Slice confirmation dialog box appears on the screen. Click Delete to confirm deletion or Cancel to cancel slice deletion.
Figure 8-7 Confirm Delete
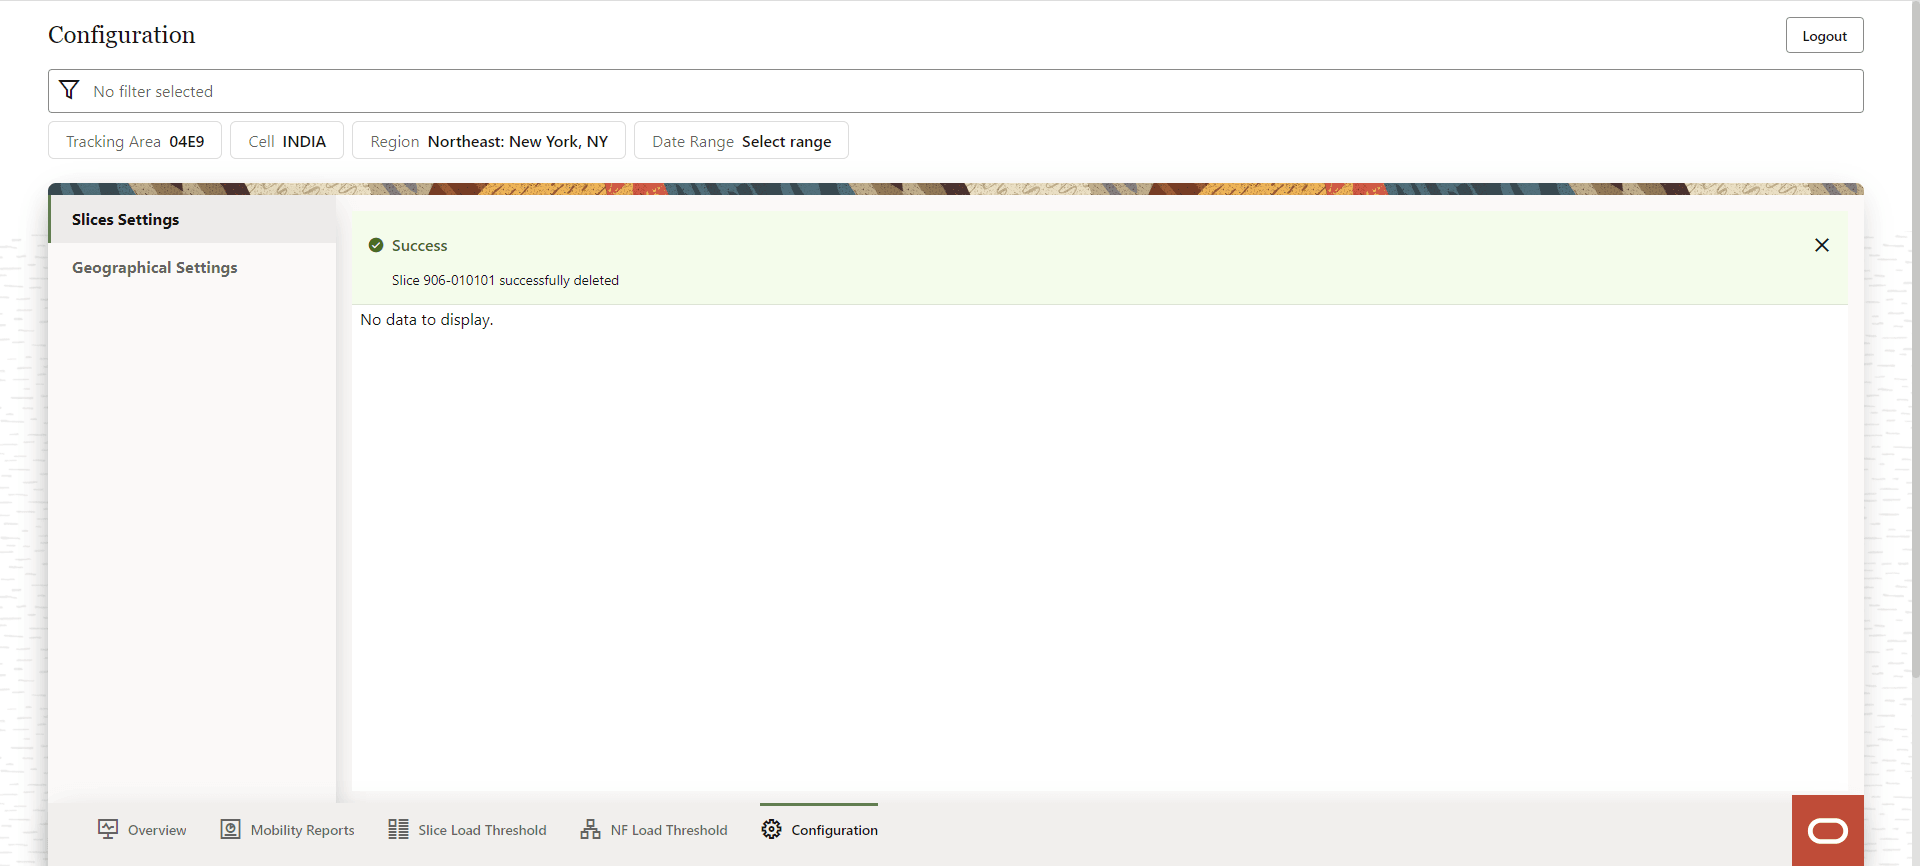
After the slice is successfully deleted, a Success message appears on the screen.
Figure 8-8 Successful Deletion
8.3.1.3 Edit an Existing Slice
To edit a slice, click dotted menu button on the right side of the slice to be edited. Click the Edit value option that appears as a pop up on the screen.
Figure 8-9 Edit Value

The Edit Slice form appears on the right side of the screen.
Figure 8-10 Edit Slice
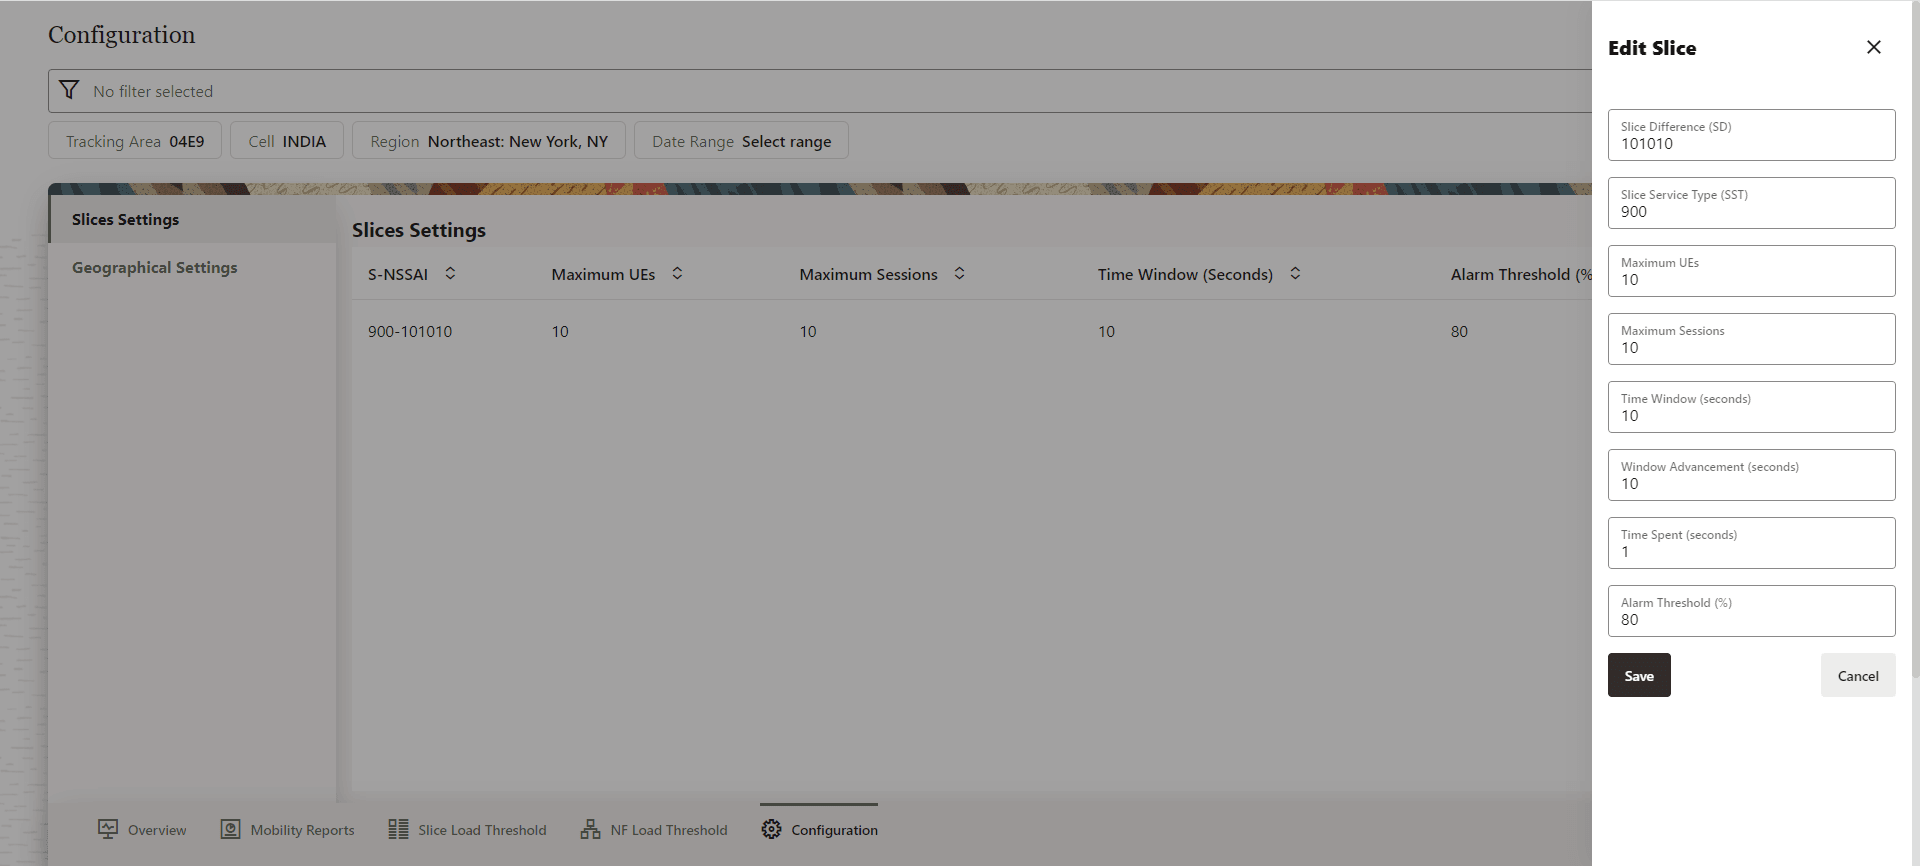
Modify the required fields to edit the slice. Click Save to apply the changes to the slice.
8.3.2 Geographical Settings
The Configuration screen displays the Geographical Settings option. Click on the Geographical Settings option on the left side of the screen. The Geographical Settings screen appears.
Figure 8-11 Geographical Settings
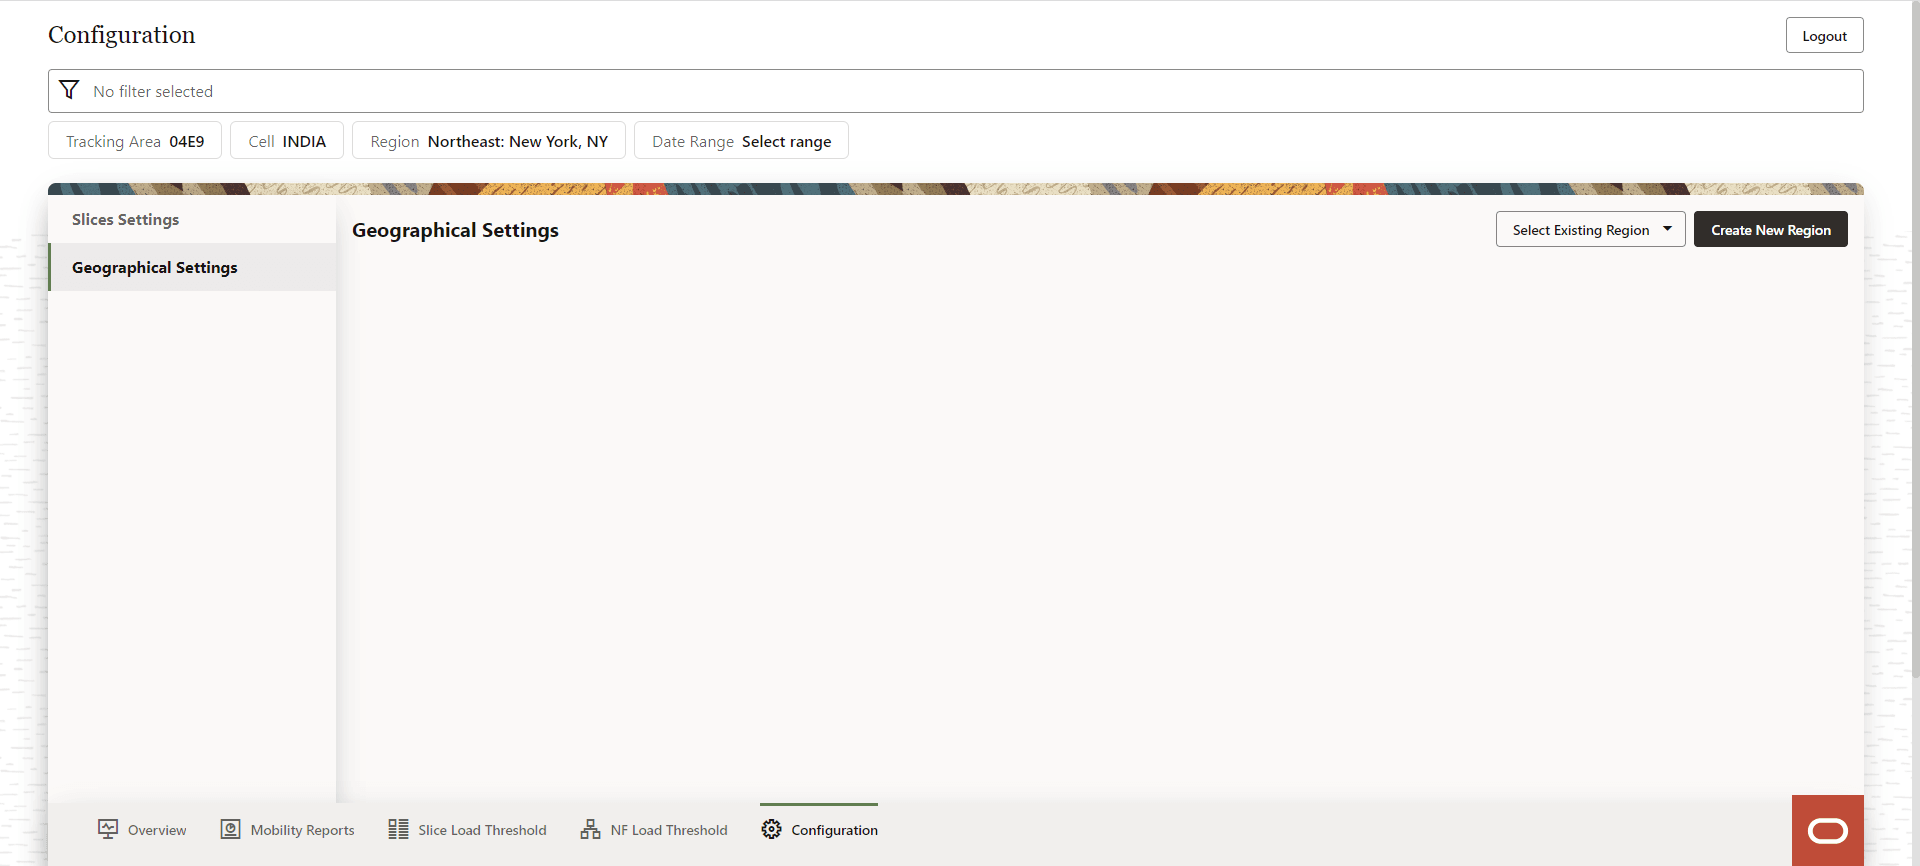
Use this screen to Select Existing Region or Create New Region.
8.3.2.1 Create New Region
Click Create New Region to create a new region.
Figure 8-12 Create New Region
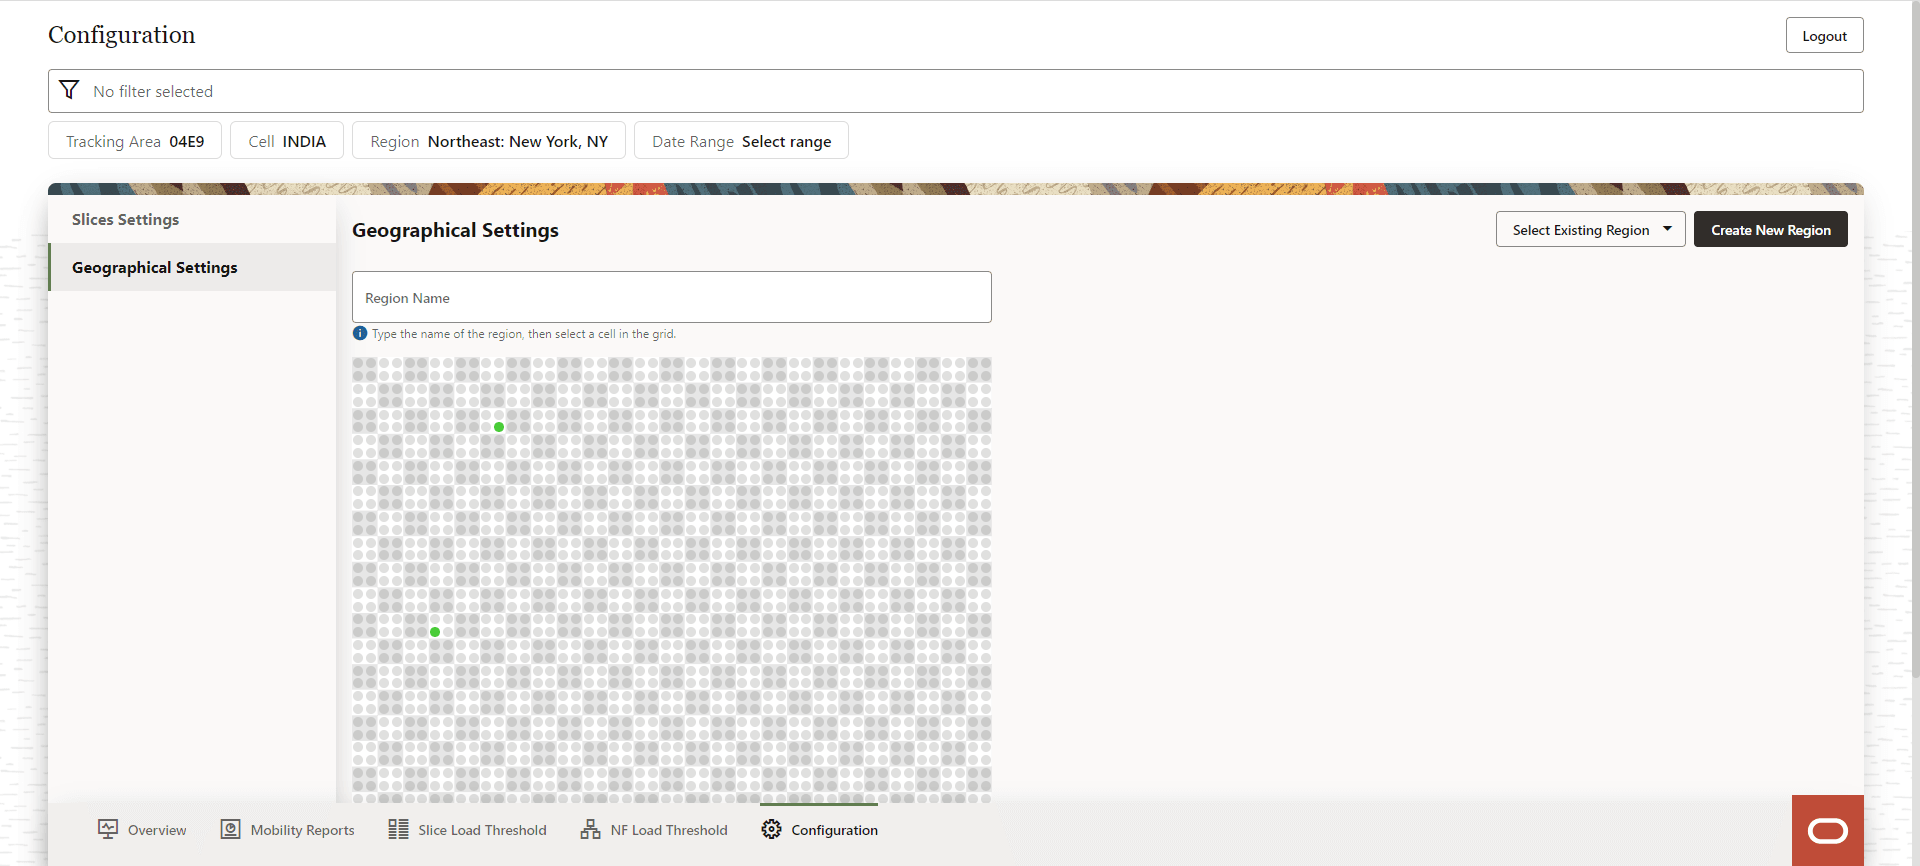
- Provide a Region Name, and then select the cell in the grid.
- The Editing Cell screen displays on the right side of the screen to update the region information. Provide the following details:
- Slice
- Cell Name
- Tracking Area Name
- Longitude
- Latitude
- Geo Longitude
- Geo Latitude
- Click Save to save the changes.
- Click Cancel to discard the changes.
Figure 8-13 New Region Parameters
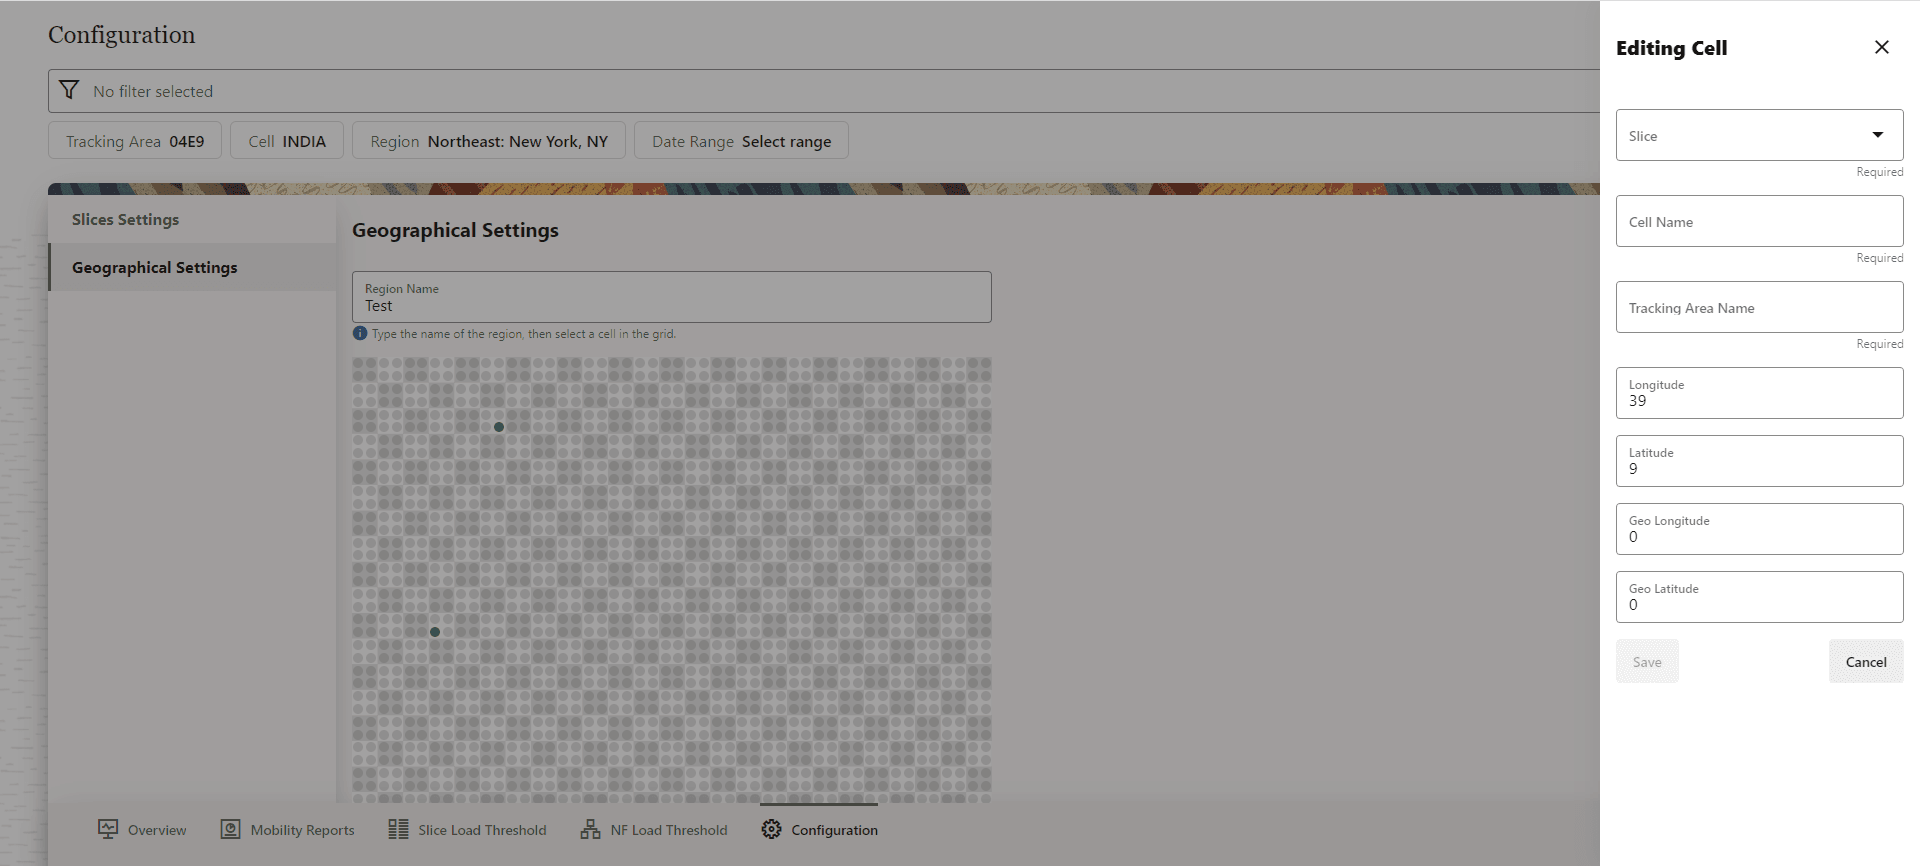
8.3.2.2 Select Existing Region and Edit Cells
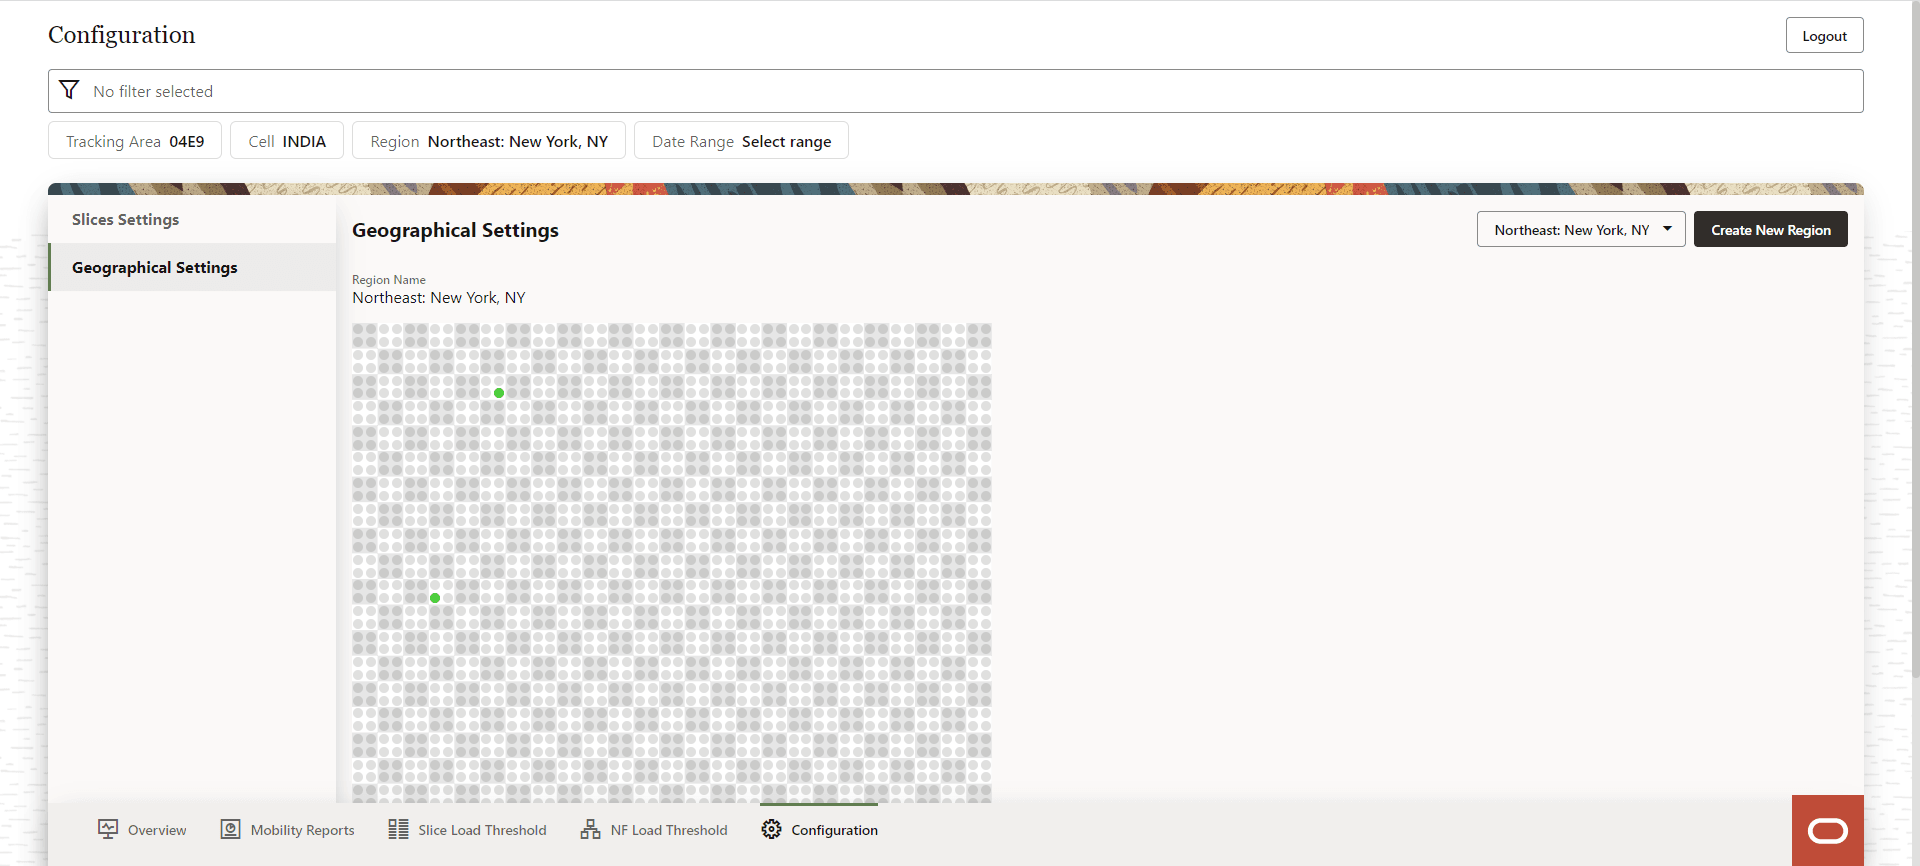
The Geographical Settings screen has an option to Select Existing Region. To visualize an existing region, click Select Existing Region drop down and select the desired region from the displayed list.
A grid of cells in the selected region are displayed:
Figure 8-14 Existing Region
Select cell that you want to edit and the Editing Cell form appears on the right side of the screen:
Figure 8-15 Edit Cell
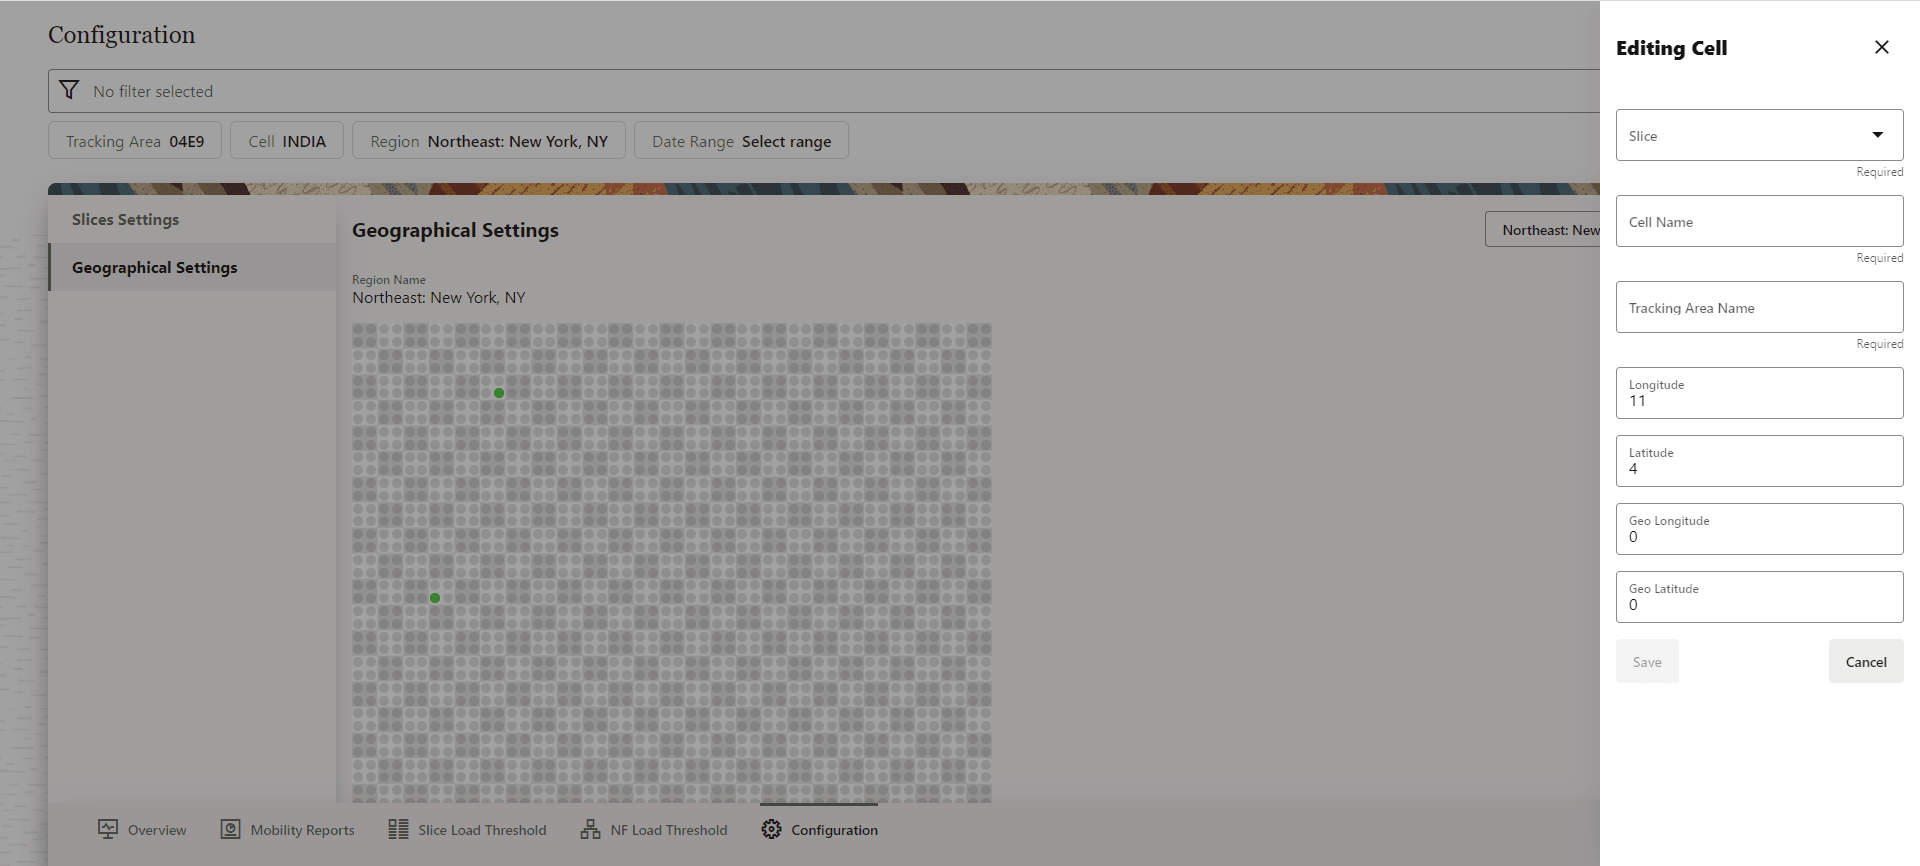
The following fields can be edited:
- Slice
- Cell Name
- Tracking Area
- Longitude
- Latitude
- Geo Longitude
- Geo Latitude
Click Save to save the changes or Cancel to discard the changes.
8.4 Mobility Reports
After successful login, the Network Overview screen appears. Click the Mobility Reports button, and the Mobility Reports screen appears.
Figure 8-16 Mobility Reports
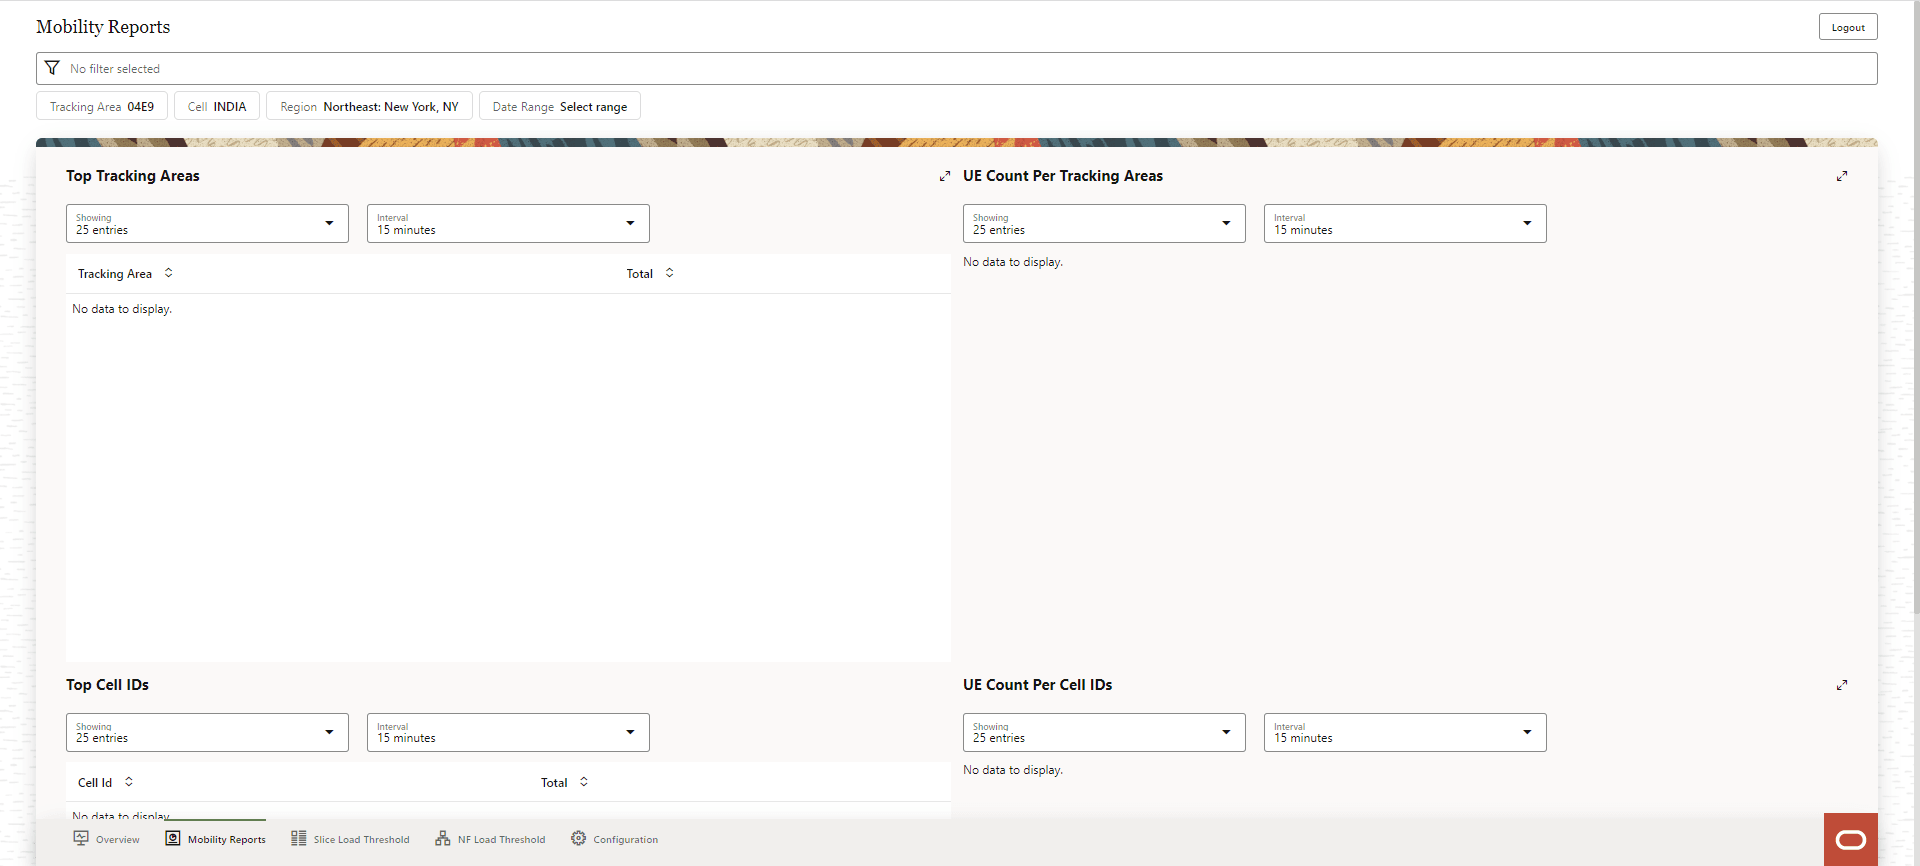
- Top Tracking Areas
- UE Count Per Tracking Areas
- Top Cell IDs
- UE Count Per Cell IDs
Top Tracking Areas
This section displays the Top Tracking Areas. Drop down options are available to select number of entries to be displayed and the time interval. Select Showing, to select the number of entries to be displayed, the available options are 10 entries, 25 entries, and 50 entries. Select the Interval, the available options are 5 minutes, 15 minutes, 30 minutes and 60 minutes.
The Tracking Area and the Total appear based on the number of entries and interval selected in the drop down list.
User has an option to obtain an expanded view of the Top Tracking Areas. Click the option to expand the view, the Top Tracking Areas appears as a pop up on the screen.
Figure 8-17 Top Tracking Areas
UE Count Per Tracking Areas
This section displays the UE Count Per Tracking Areas. Drop down options are available to select number of entries to be displayed and the time interval. Select Showing, to select the number of entries to be displayed, the available options are 10 entries, 25 entries, and 50 entries. Select the Interval, the available options are 5 minutes, 15 minutes, 30 minutes and 60 minutes.
User has an option to obtain an expanded view of the UE Count Per Tracking Areas. Click the option to expand the view, the UE Count Per Tracking Areas appears as a pop up on the screen.
Figure 8-18 UE Count Per Tracking Areas
Top Cell IDs
This section displays the Top Cell IDs. Drop down options are available to select number of entries to be displayed and the time interval. Select Showing, to select the number of entries to be displayed, the available options are 10 entries, 25 entries, and 50 entries. Select the Interval, the available options are 5 minutes, 15 minutes, 30 minutes and 60 minutes.
The Cell Id and the Total appear based on the number of entries and interval selected in the drop down list.
User has an option to obtain an expanded view of the Top Cell IDs. Click the option to expand the view, the Top Cell IDs appears as a pop up on the screen.
Figure 8-19 Top Cell IDs

UE Count Per Cell IDs
This section displays the UE Count Per Cell IDs. Drop down options are available to select number of entries to be displayed and the time interval. Select Showing, to select the number of entries to be displayed, the available options are 10 entries, 25 entries, and 50 entries. Select the Interval, the available options are 5 minutes, 15 minutes, 30 minutes and 60 minutes.
User has an option to obtain an expanded view of the UE Count Per Cell IDs. Click the option to expand the view, the UE Count Per Cell IDs appears as a pop up on the screen.
Figure 8-20 UE Count Per Cell IDs

8.5 Slice Load Threshold Alerts
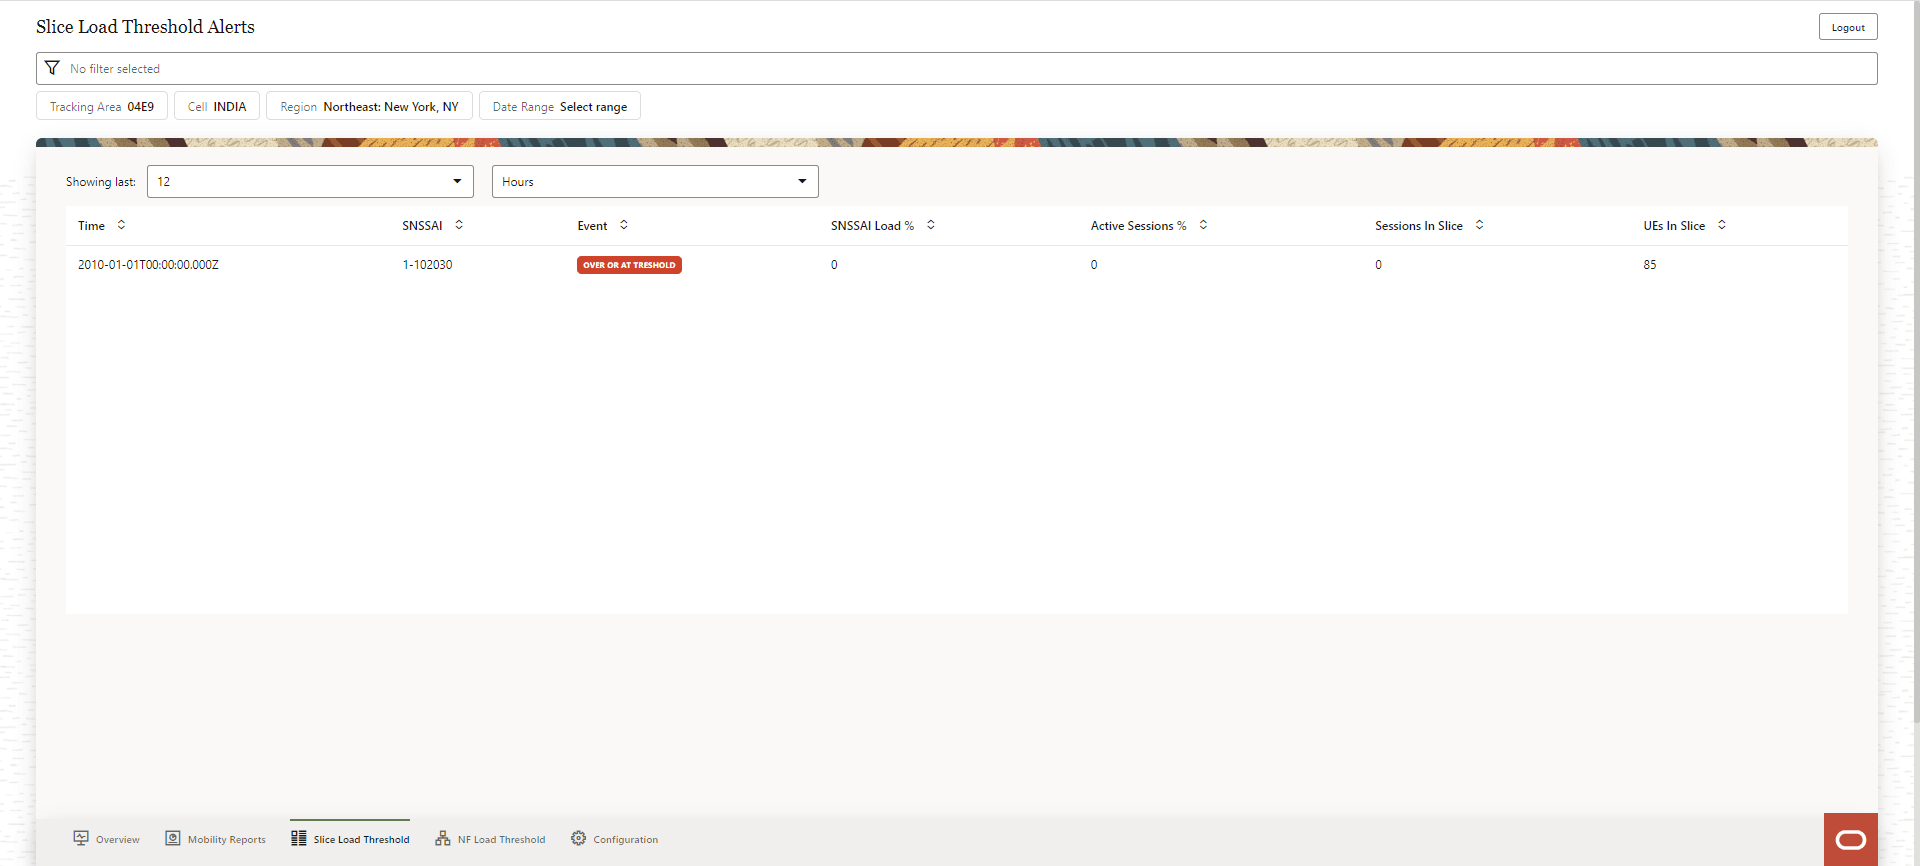
On the Network Overview Screen, click the Slice Load Threshold button, and the Slice Load Threshold Alerts screen appears.
- Time
- SNSSAI
- Event
- SNSSAI Load %
- Active Sessions %
- Sessions In Slice
- UEs In Slice
The user can see the alerts during a specified time duration. The time duration can be selected from the Showing last drop down list.
Figure 8-21 Slice Load Threshold Alerts
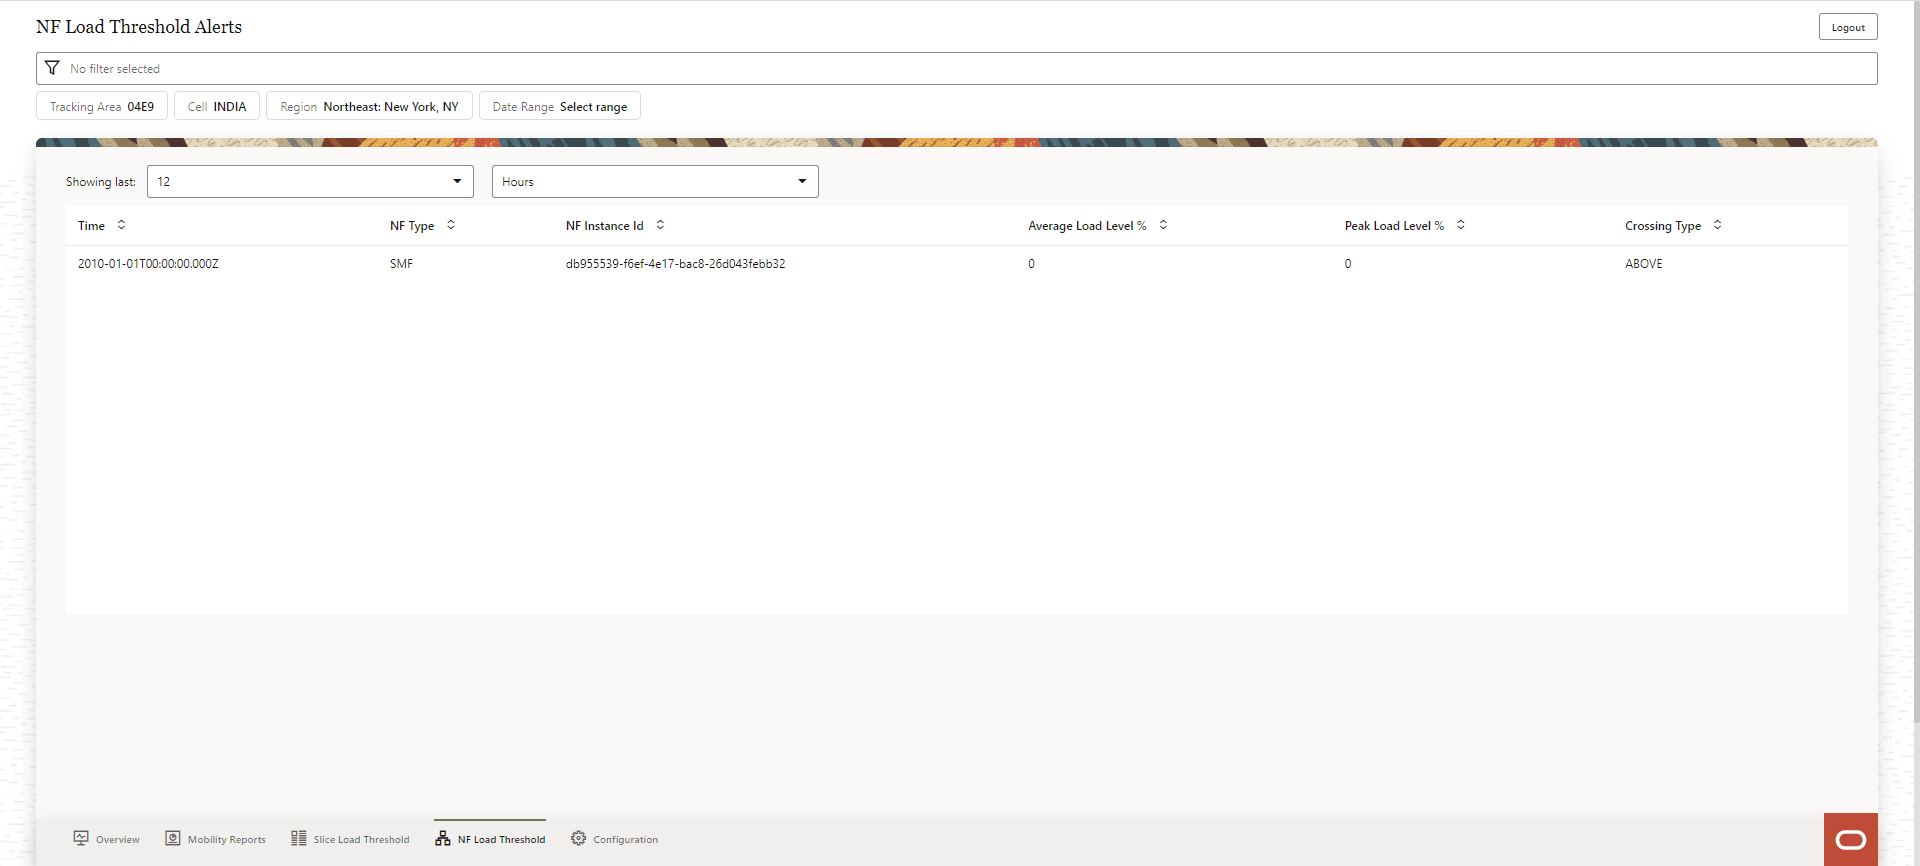
8.6 NF Load Threshold Alerts
On the Network Overview Screen, click the NF Load Threshold button, and the NF Load Threshold Alerts screen appears.
- Time
- NF Type
- NF Instance ID
- Average Load Level %
- Peak Load Level %
- Crossing Type
The user can see the alerts during a specified time duration. The time duration can be selected from the Showing last drop down list.
Figure 8-22 NF Load Threshold Alerts
