8 Access OCNWDAF GUI Using CNC Console
This chapter describes how to configure different analytics parameters (global and service) and view analytics information in the Oracle Communications Networks Data Analytics Function (OCNWDAF) GUI. The OCNWDAF GUI is accessed using the CNC Console application. OCNWDAF provides a console interface using the highly secure GUI service, which allows you to use an interactive interface for performing various actions related to OCNWDAF services.
Support for Multicluster Deployment
CNC Console supports both single and multiple cluster deployments by facilitating OCNWDAF deployment in local and remote Kubernetes clusters. For more information about single and multiple cluster deployments, see Oracle Communications Cloud Native Configuration Console Installation, Upgrade, and Fault Recovery Guide.
A single instance of CNC Console can configure multiple clusters of OCNWDAF deployments, where each cluster has an agent console installation and a OCNWDAF installation.
CNC Console Interface
This section provides an overview of the Oracle Communications Cloud Native Configuration Console (CNCC), which includes an interface to configure the OCNWDAF features.
To configure the OCNWDAF services using the CNCC, log in to the CNCC application. To log into CNCC, update the hosts file available at the C:\Windows\System32\drivers\etc location when CNCC is hosted on a third party cloud native environment.
- In the Windows system, open the hosts file in the notepad as an administrator and append the following set of lines at the end of the hosts file:
For example:<CNCC Node IP> cncc-iam-ingress-gateway.cncc.svc.cluster.local <CNCC Node IP> cncc-core-ingress-gateway.cncc.svc.cluster.local10.75.212.88 cncc-iam-ingress-gateway.cncc.svc.cluster.local 10.75.212.88 cncc-core-ingress-gateway.cncc.svc.cluster.localNote:
The IP Address mentioned above may change when the deployment cluster changes. - Save and close the hosts file.
Before logging into CNC Console, create a CNCC user name and password. Log in to the CNC Console application using these login credentials. For information on creating a CNC Console user and password, see Oracle Communications Cloud Native Configuration Console Installation, Upgrade, and Fault Recovery Guide.
8.1 OCNWDAF GUI Login
The OCNWDAF Graphical User Interface (GUI) can be accessed only after logging in to the CNC Console application. Before proceeding, ensure that the CNC Console is installed. For more information, see "Installing OCNWDAF GUI" section of Oracle Communications Networks Data Analytics Function Installation and Fault Recovery Guide.
Before logging in to the CNC Console application, create a username and password. For more information about username creation, see "Configuring CNC Console IAM" section in Cloud Native Configuration Console User Guide.
CNC Console Log in
Following is the procedure to log into CNC Console:
- Open any web browser.
- Enter the URL: http://<host name>:<port number>.
where, host name is cncc-iam-ingress-ip and port number is cncc-iam-ingressport.
- Enter valid login credentials.
Figure 8-1 CNC Console Login
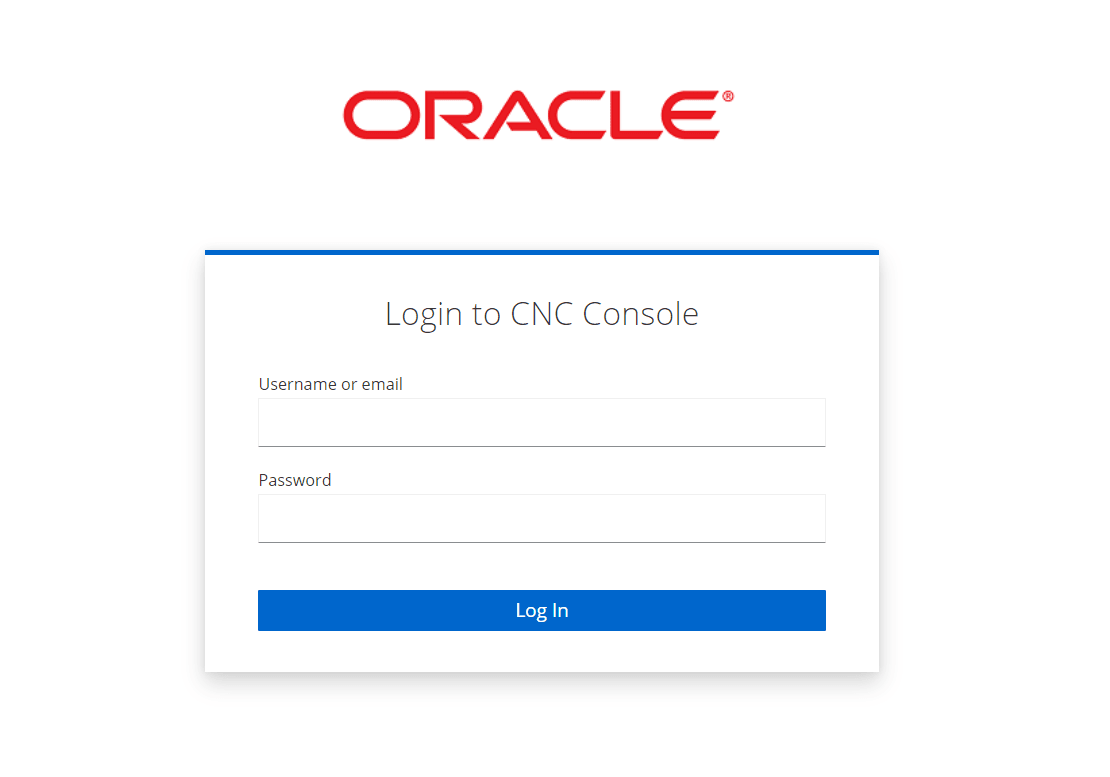
- Click Log in. The CNC Console interface is displayed.
Figure 8-2 CNC Console Interface
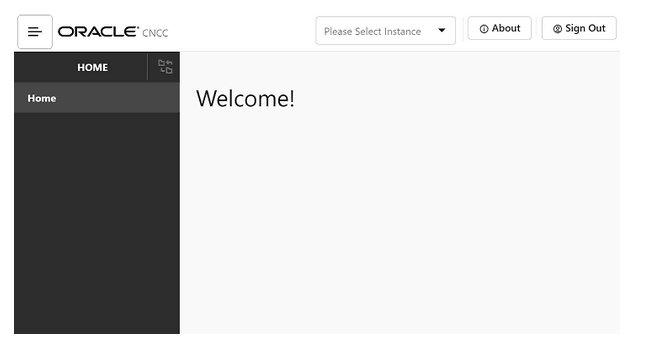
Select the required OCNWDAF instance from the Please Select Instance drop-down list. The left pane displays the selected network function.
On a new browser tab, the Machine Learning (ML) Model Selector page appears.
Figure 8-3 ML Model Selector
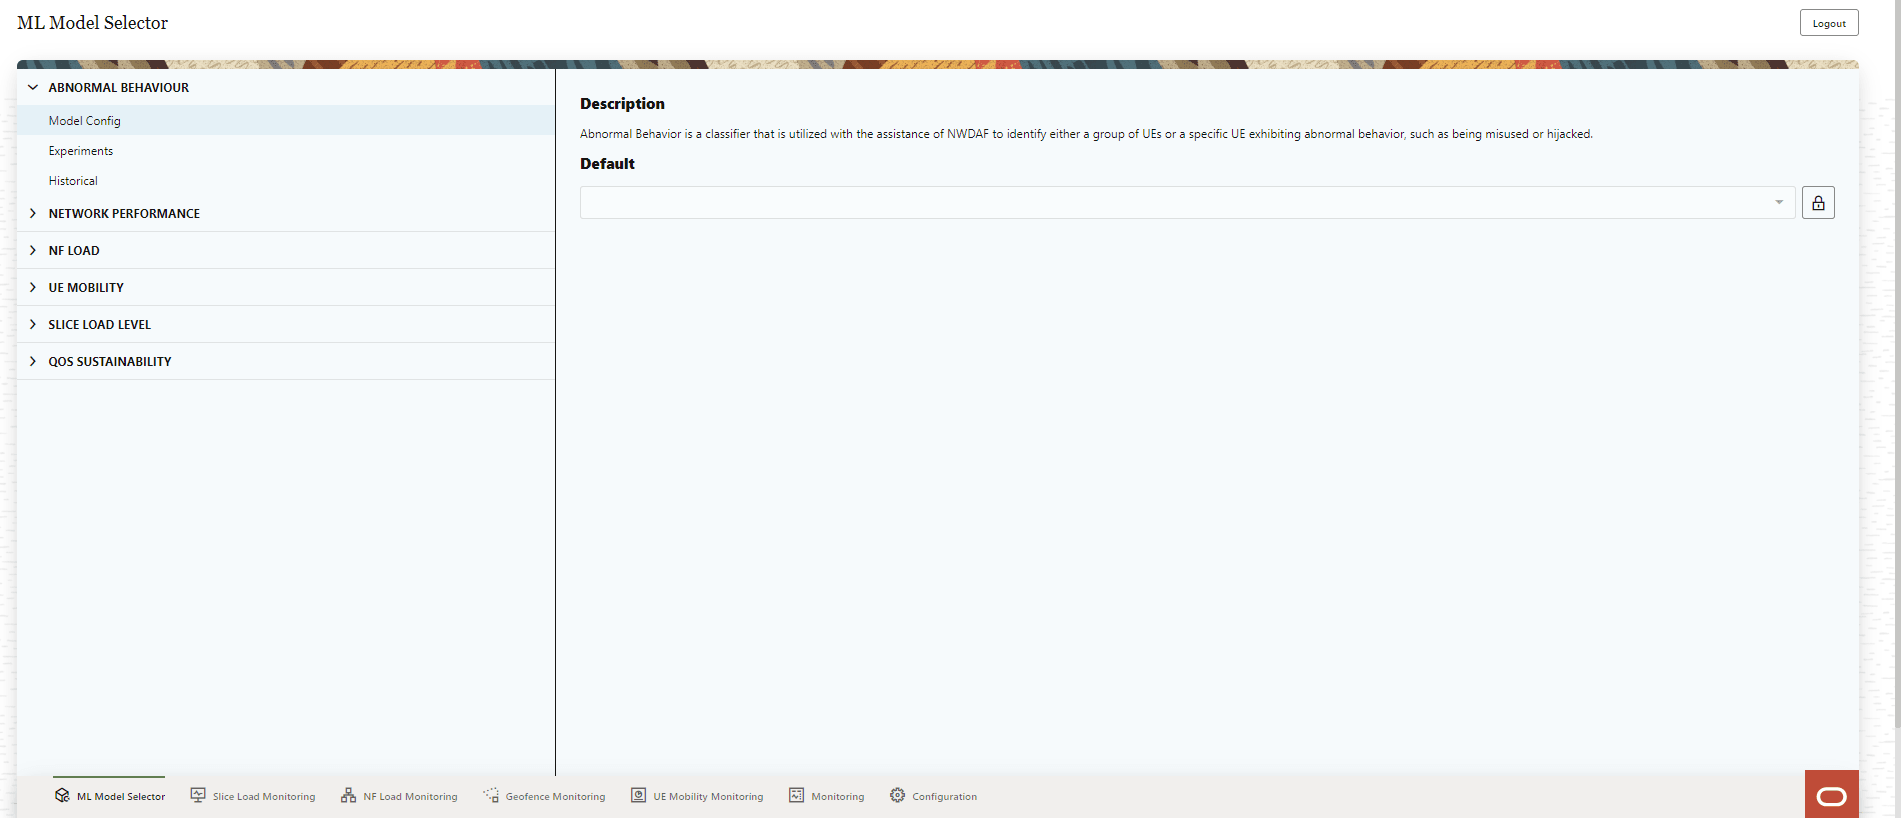
All GUI pages contain the following options:
- The Logout button to logout from the GUI.
- The ML Model Selector icon at the bottom of the page opens the ML Model Selector page.
- The Slice Load Monitoring icon at the bottom of the page opens the Slice Load Monitoring page.
- The NF Load Monitoring icon at the bottom of the page opens the NF Load Monitoring page.
- The Geofence Monitoring icon at the bottom of the page opens the Geofence Monitoring page.
- The UE Mobility Monitoring icon at the bottom of the page opens the UE Mobility Monitoring page.
- The Monitoring icon at the bottom of the page opens the Monitoring page.
- The Configuration icon at the bottom of the page opens the Configuration page.
The ML Model Selector page consists the following elements:
- The list of analytics for which the ML Models can be selected:
- ABNORMAL BEHAVIOUR
- NETWORK PERFORMANCE
- NF LOAD
- UE MOBILITY
- SLICE LOAD LEVEL
- QOS SUSTAINABILITY
- A brief of the Description selected analytics ID.
- The Default algorithm of the selected analytic.
To update the ML model for the OCNWDAF analytic IDs, see Machine Learning (ML) Model Selector.
8.2 Machine Learning (ML) Model Selector
Use the ML Model Selector page to update or select the Machine Learning (ML) model for the OCNWDAF analytic IDs. It contains the following elements:
- The list of analytics IDs for which the ML algorithms can be selected are:
- ABNORMAL BEHAVIOUR
- NETWORK PERFORMANCE
- NF LOAD
- UE MOBILITY
- SLICE LOAD LEVEL
- QOS SUSTAINABILITY
- A brief of the Description analytic ID.
- The Default algorithm of the selected analytic ID. The Edit icon is used to select a new algorithm from the drop-down list.
Follow the steps below to update the ML algorithm, run experiments, and view historical experiments for the OCNWDAF analytic IDs:
-
Click the analytic ID for which you want to update the ML algorithm. The following options appear below the selected Analytic ID:
For example:
Figure 8-4 ML Model Selector for an Analytic ID

- The Model Config option displays a brief Description of the analytic ID and the Default ML algorithm. Click Lock icon to select a new algorithm from the drop-down list. Listed below are the algorithm options for each Analytic ID:
Table 8-1 ML Algorithm
Analytic ID Algorithm Options ABNORMAL BEHAVIOUR - Random Forest Classifier (this is the default algorithm).
- Support Vector Classifier
- Gradient Boosting Classifier
- Logistic Regression
NETWORK PERFORMANCE The default algorithm is Long Short Term Memory Network. This is the only algorithm currently supported.
NF LOAD - Multi-layer Perceptron Regressor (this is the default algorithm).
- Random Forest Regressor
- Gradient Boosting Regressor
- Decision Tree Regressor
UE MOBILITY - Long Short Term Memory Network
- Feed Forward Neural Network (this is the default algorithm).
- Recurrent Neural Network
SLICE LOAD LEVEL - Linear Regression, this is the default algorithm.
- Random Forest Regressor
- Gradient Boosting Regressor
- K Neighbors Regressor
QOS SUSTAINABILITY - Decision Tree Regressor (this is the default algorithm).
- Random Forest Regressor
- K Neighbors Regressor
Select the algorithm, a pop-up window appears to confirm the change in the "Default Algorithm". Click Yes to confirm the change, click Cancel to discard the change.
A Success message is displayed after the algorithm is successfully changed.
The selected algorithm will now be used to train a model for the analytics category.
- Click Experiments option for the analytics ID to run experiments on the selected algorithm.
- Provide an Experiment Name.
- Click the check box to select the algorithm.
Note:
User can select multiple algorithms simultaneously.The following algorithms are available for each analytic ID:
Table 8-2 Select Algorithm
Analytic ID Algorithm Options ABNORMAL BEHAVIOUR - Support Vector Classifier
- Random Forest Classifier
- Gradient Boosting Classifier
- Logistic Regression
NETWORK PERFORMANCE - Long Short Term Memory Network
NF LOAD - Multi-layer Perceptron Regressor
- Random Forest Regressor
- Gradient Boosting Regressor
- Decision Tree Regressor
UE MOBILITY - Long Short Term Memory Network
- Feed Forward Neural Network
- Recurrent Neural Network
SLICE LOAD LEVEL - Linear Regression
- Random Forest Regressor
- Gradient Boosting Regressor
- K Neighbors Regressor
QOS SUSTAINABILITY - Decision Tree Regressor
- Random Forest Regressor
- K Neighbors Regressor
- Click Run Experiment, to run experiments with the selected algorithm(s).
- A success message is displayed on the screen with the Experiment ID.
- Click Historical to see information about the experiments previously run for the analytics ID. The list of experiments with the following details is displayed:
Figure 8-5 Historical Data
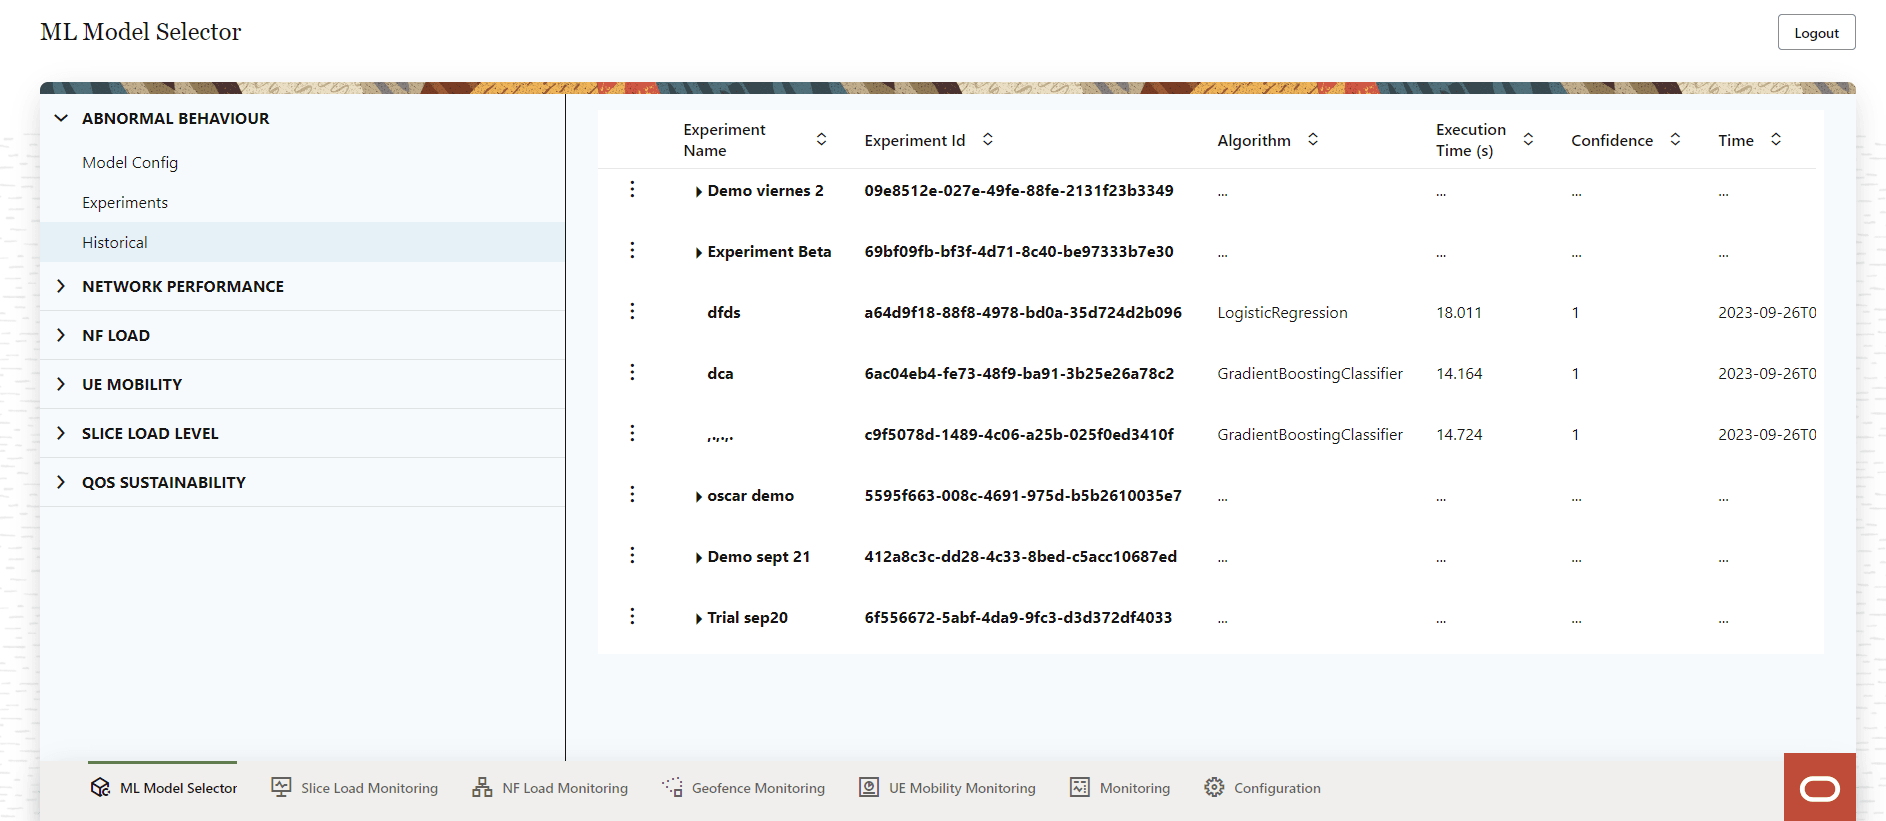
Table 8-3 Historical Data
Parameter Description Experiment Name The experiment name provided by the user. Experiment ID The unique identifier of the experiment. Algorithm The algorithm used for the experiment. Execution Time The time duration for which the experiment was conducted. Confidence The confidence value of the experiment. Time The date and time when the experiment was conducted. The Vertical Ellipses icon Click this icon to view metrics for the experiment. Click View Metrics, a pop-up appears to display the metrics information (for example, Figure 8-6)
Sample Metrics screen:
Figure 8-6 Metrics
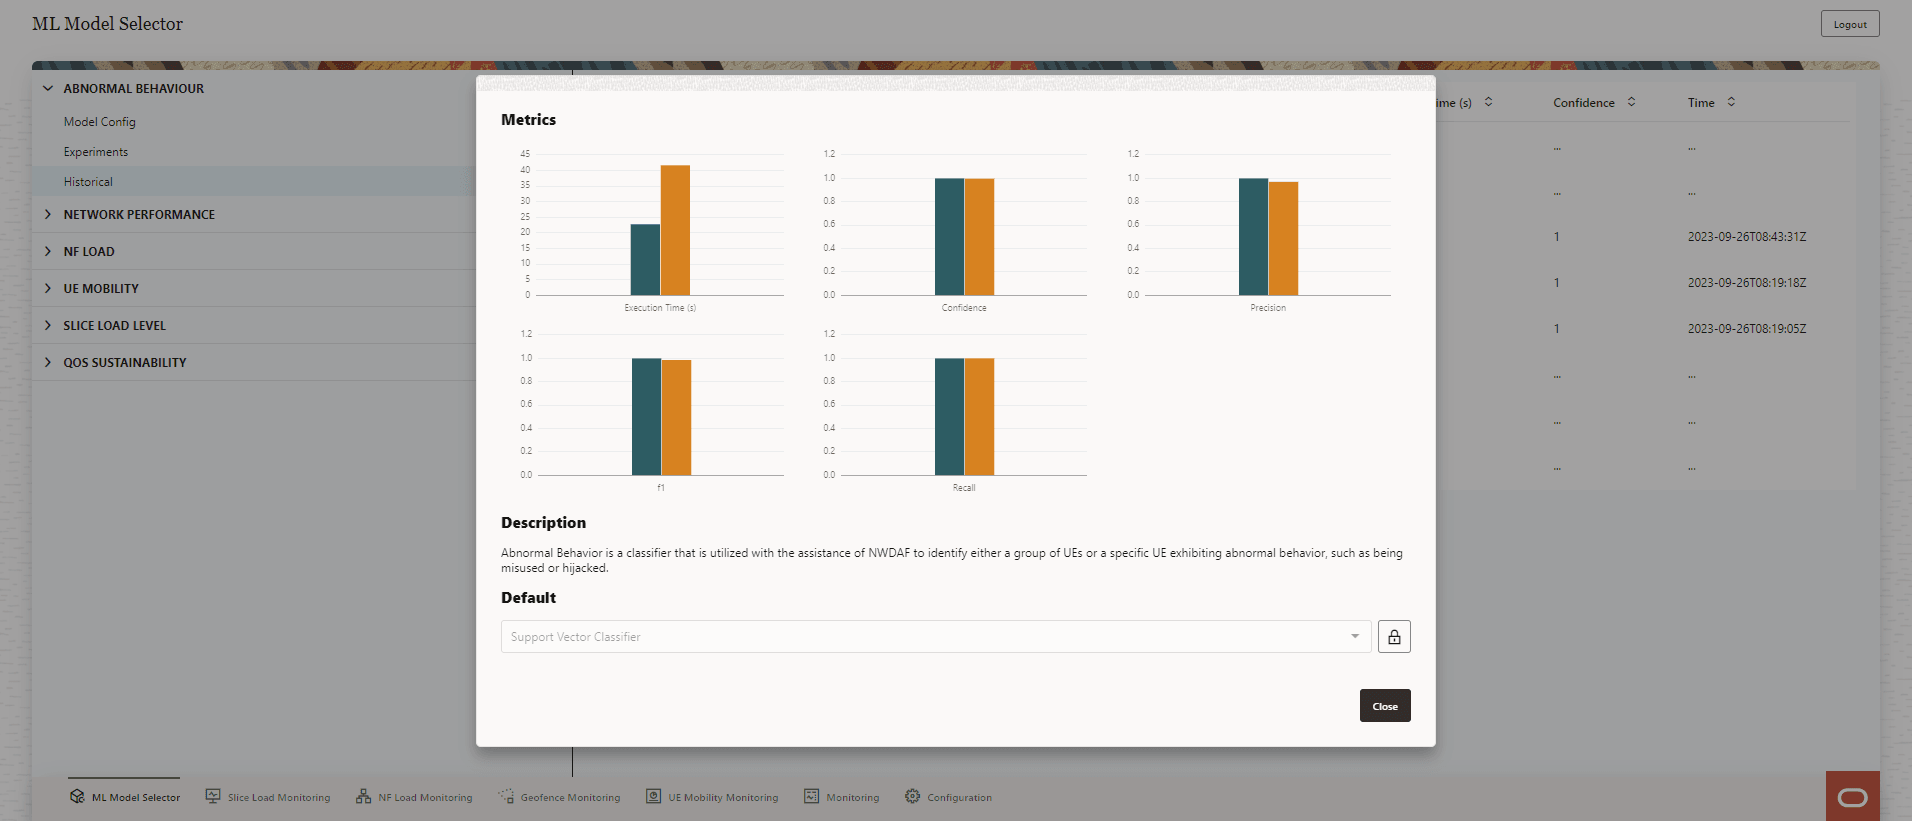
After reviewing the results, you can change the Default algorithm. Click the Lock icon and then select an algorithm from the drop-down list.
Select the algorithm, a pop-up window appears to confirm the change in the "Default Algorithm". Click Yes to confirm the change, click Cancel to discard the change.
A Success message is displayed after the algorithm is successfully changed.
8.3 Slice Load Monitoring
The Slice Load Monitoring screen displays the Registered Slices and Slice Load Monitoring Threshold Events information.
Figure 8-7 Slice Load Monitoring
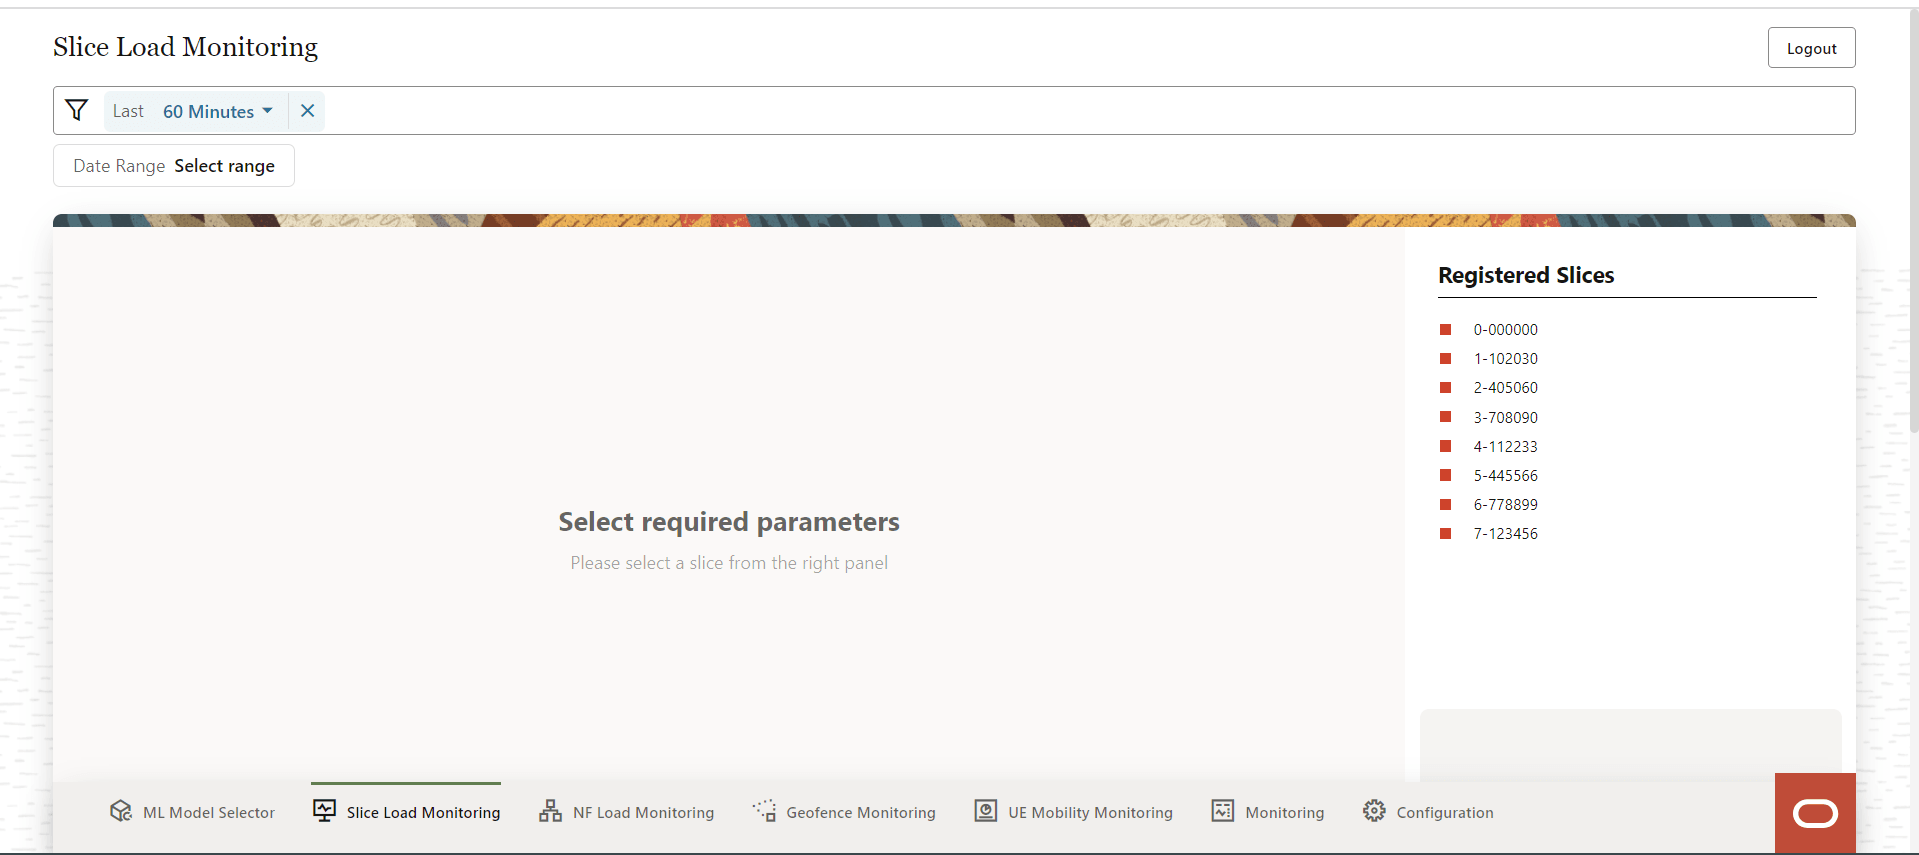
A Filter bar to filter the slice load information based on Date Range (click Select range to set the dates) or the option Last (click drop-down to select 3 Minutes, 5 Minutes, 15 Minutes, 30 Minutes, 60 minutes or 120 minutes) to filter based on the minutes elapsed.
- Slice Load: Displayed as a percentage (%) value.
- Max Sessions: Displays the maximum number of sessions in the slice.
- Session Load: Displays the session's load information in the slice.
- Max UEs: Displays the maximum number of UEs in the slice.
- UEs Load: Displays the UEs load information.
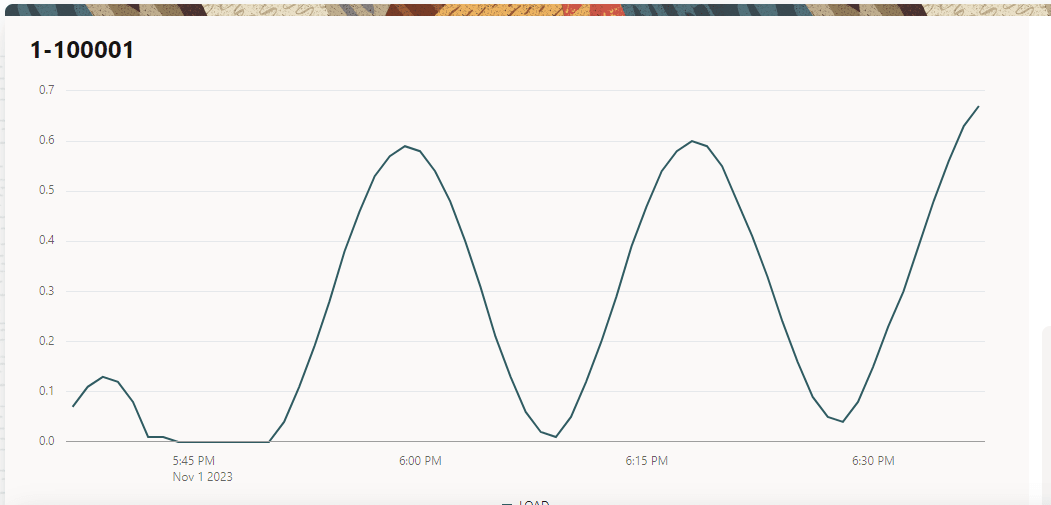
A graphical representation of the slice load monitoring information is displayed on the screen. Hover the mouse over the chart, a small popup window appears over the chart displaying the calculated slice load for that specific time.
Figure 8-8 Slice Load Graph
This page displays the following Slice Load Monitoring Threshold Events information:
- The user can select the number of previous events to be displayed. Select the number of events using the Showing last events drop down list.
- A list of slices with the following information is displayed:
- Time: The timestamp of the slice.
- SNSSAI: The S-NSSAI of the slice.
- Event: Displays if the event is "Under Threshold" or "Over of At Threshold".
- SNSSAI Load %: Displays the percentage of load on the S-NSSAI.
- Maximum Sessions %: Displays the percentage of active session.
Use the Arrow icon provided for each of the above parameters to list the values in ascending order.
8.4 NF Load Monitoring
The NF Load Monitoring screen displays the NF instances, NF load level as peak and average load values. It also displays the NF Load Monitoring Threshold information.
Figure 8-9 NF Load Monitoring
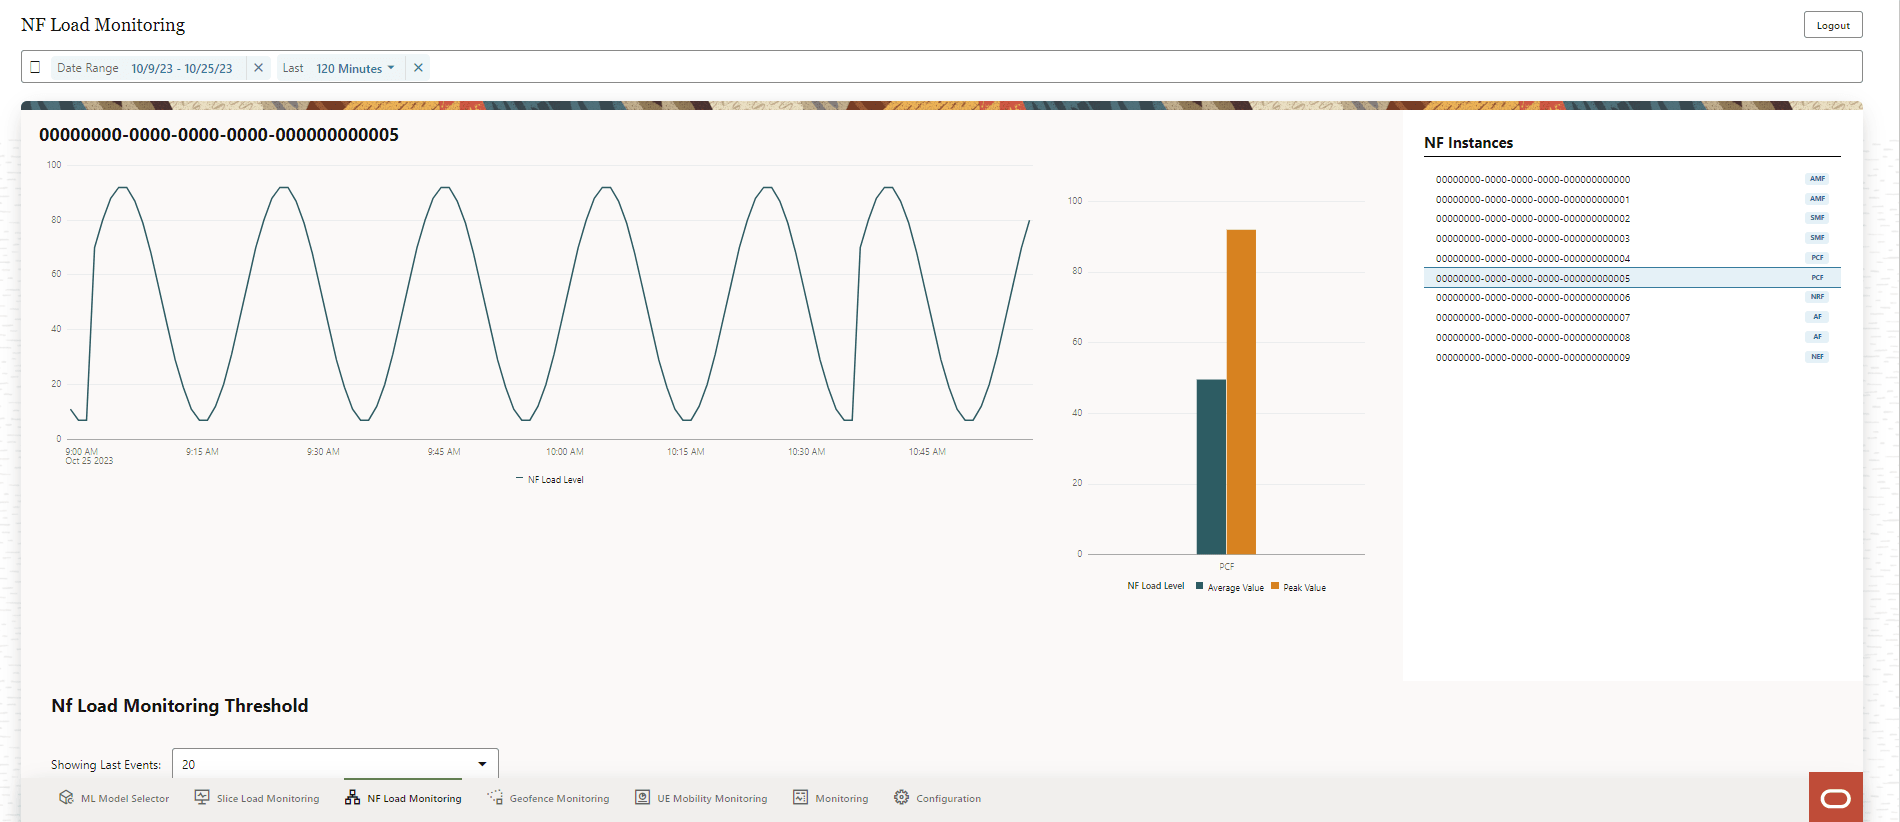
A Filter bar to filter the NF load information based on Date Range (click Select range to set the dates), and the option Last (click drop-down to select 3 Minutes, 5 Minutes, 15 Minutes, 30 Minutes, 60 minutes or 120 minutes) to filter based on the minutes elapsed.
The NF Instances are listed on the right side of the screen, select the NF instance to view the load levels for that NF.
- NF Load Level, it includes the following:
- A graphical representation of the NF load level and load values with time stamp.
- A graphical representation of the Peak Value.
- A graphical representation of the Average Value.
Use the Showing Last Events drop-down list to select the number of previous NF load level events to be displayed on the screen.
A list of NFs with the following information is displayed:
- Time: The timestamp of the NF.
- NF Type: The NF type such as AMF, SMF, or NWDAF and so on.
- NF Instance Id: The NF instance identifier.
- Average Load Level %: Displays the average load level on an NF (in percentage).
- Peak Load Level %: Displays the peak load level of an NF (in percentage).
- Crossing Type: Indicates the crossing type that is "ASCENDING", DESCENDING", or "CROSSED".
Use the Arrow icon provided for each of the above parameters to list the values in ascending order.
8.5 Geofence Monitoring
The Geofence Monitoring page displays the Active Geofences and the Geofence Events.
Figure 8-10 Geofence Monitoring
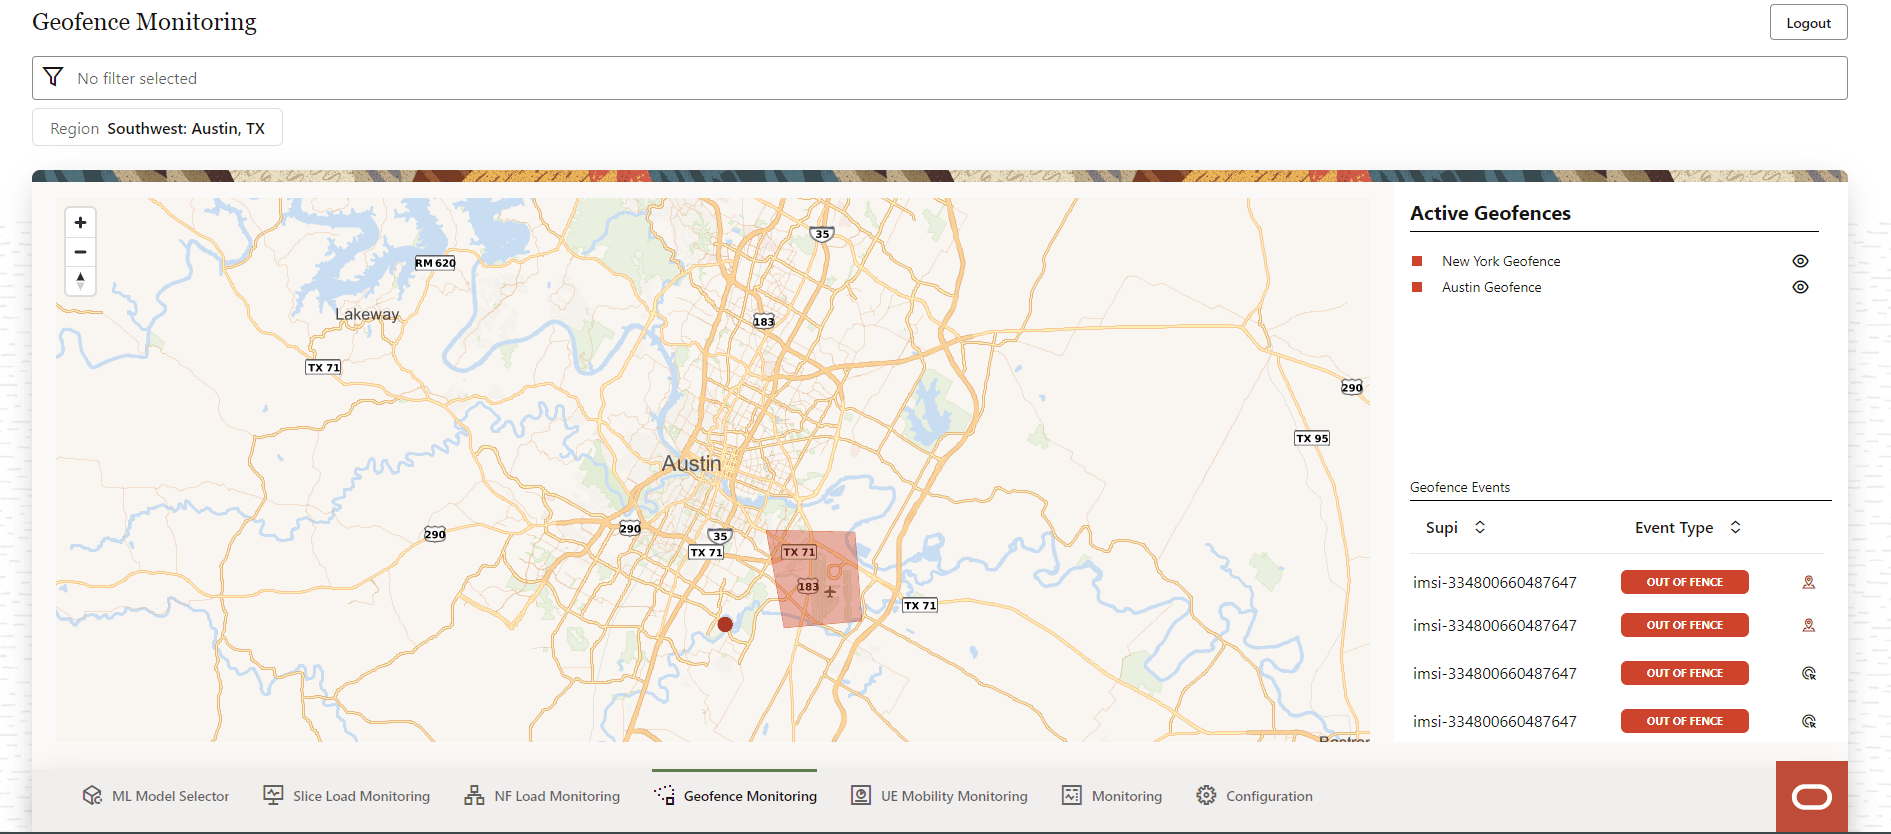
A Filter bar to filter the Geofence information based on Region (click region drop-down list to select the region). The filter selection can be refreshed by clicking on the Refresh icon.
The Geofence Monitoring screen displays the Active Geofences in the region. The geofences are color coded. The Active Geofences are also listed on the right-side of the page. Click the Eye icon to view or block the display of the geofence on the map.
The Geofence Events are listed on the right-side of the page. For each geofence event the following information is displayed:
- Supi: Indicates the SUPIs of the UEs.
- Event Type: Is displayed as "IN FENCE" when the UE is within the defined geofence area, or "OUT OF_FENCE" if the UE is outside the defined geofence area.
- Click the Target icon to determine if the UE is within or outside the geofence area. The icon changes to the Location icon. Click the Location icon determine the location of the UE on the map.
Use the Arrow icon provided for each of the above parameters to list the values in ascending order.
To add, update, or delete a geofence see, Geofence Settings on the Configuration page.
8.6 UE Mobility Monitoring
The UE Mobility Monitoring screen displays the UE Mobility Data and Abnormal Behavior (AB) Events information.
To obtain UE Mobility Data, select the radio button UE Mobility Data or select the radio button AB Events to obtain information on the abnormal events.
Figure 8-11 UE Mobility Monitoring
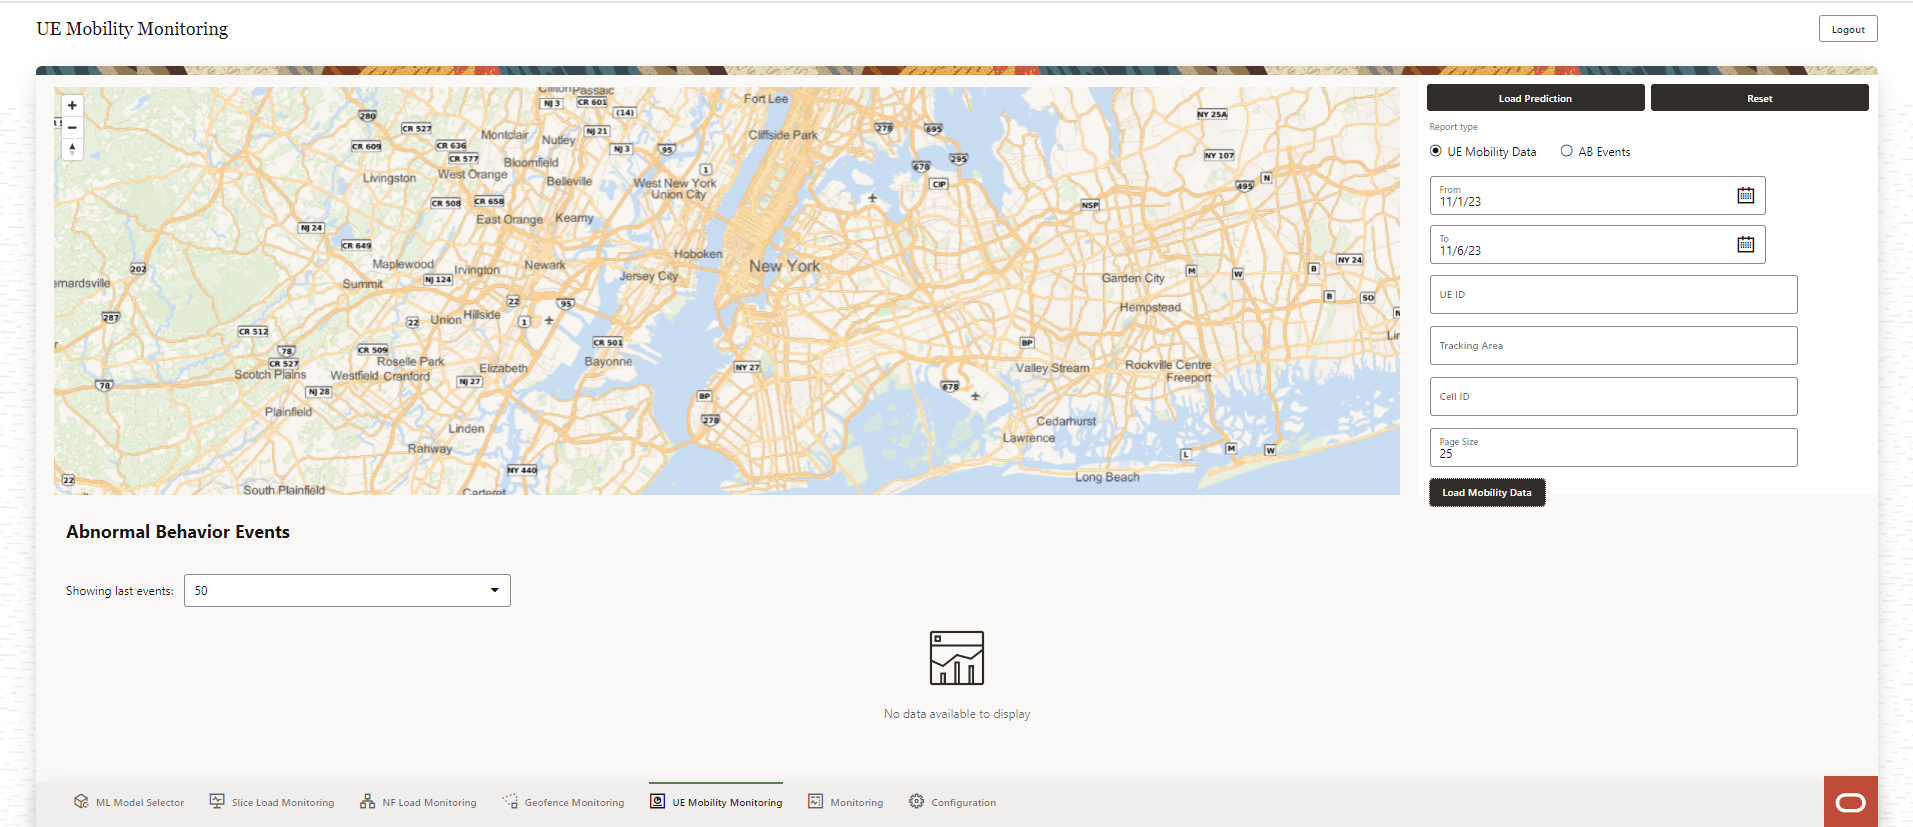
UE Mobility Data
Provide the following information to obtain UE Mobility Data :
- From date, click on the Calender icon to select the start date.
- To date, click on the Calender icon to select the end date.
- UE ID
- Tracking Area
- Cell ID
- Page Size
Click Load Mobility Data.
To obtain load prediction information click Load Prediction.
Figure 8-12 Load Prediction
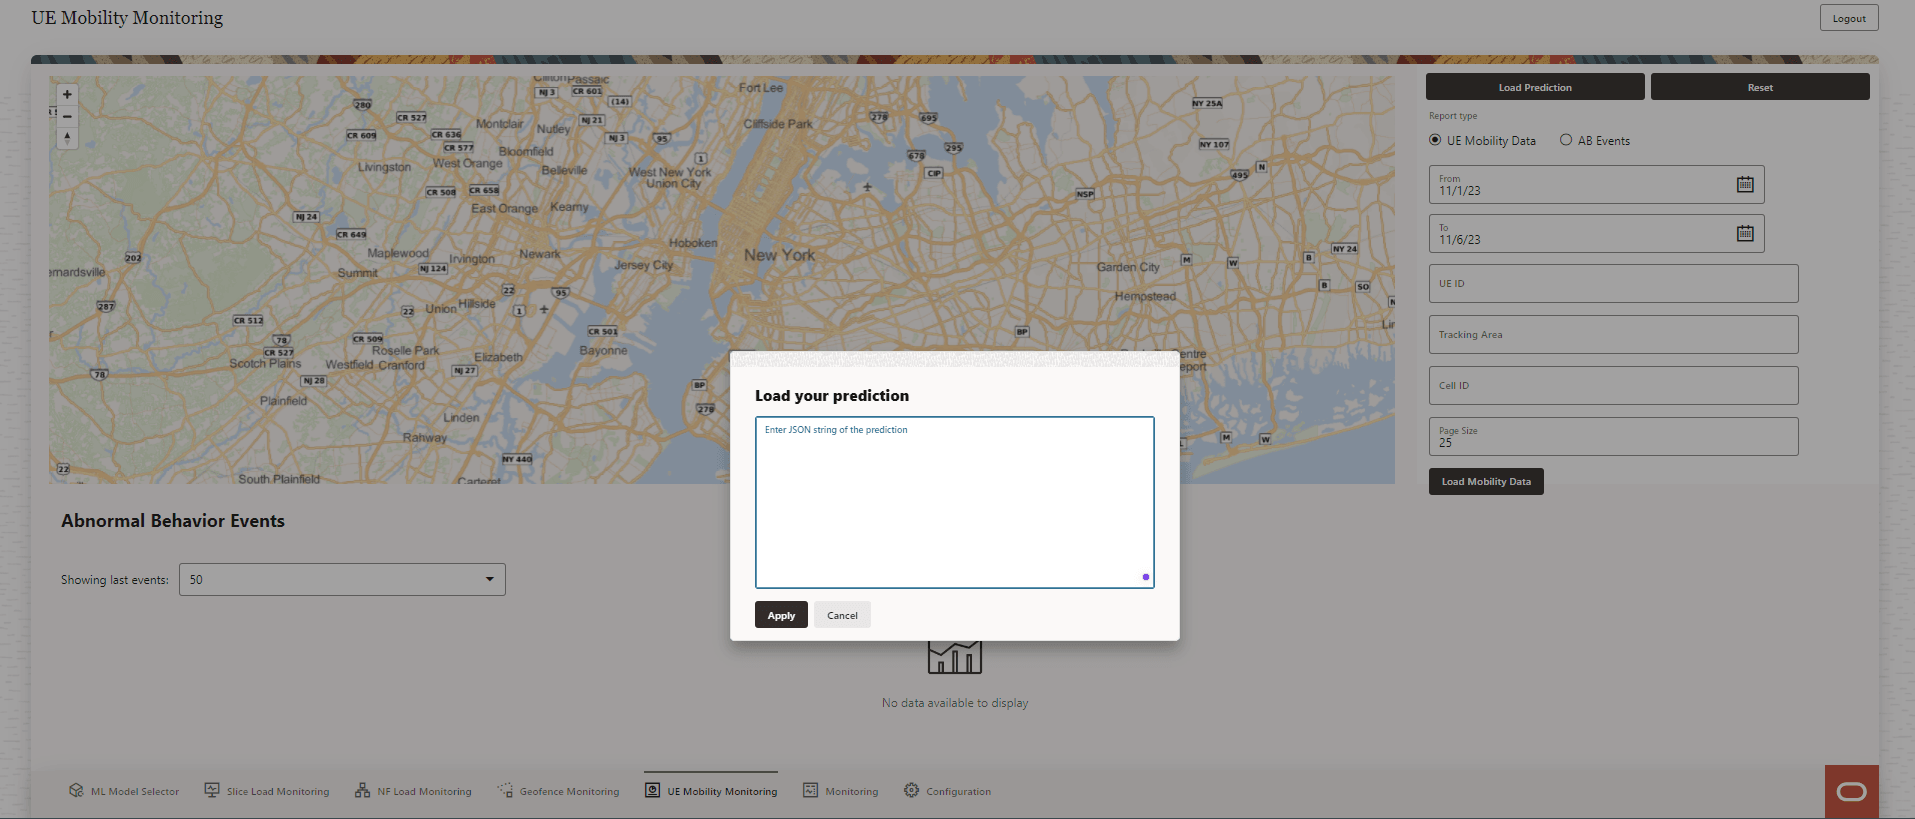
Enter the JSON string of the prediction in the text box. Click Apply. To discard the changes, click Cancel.
Click Reset to discard the existing values.
AB Events
Provide the following information to obtain information on abnormal events:
- From date, click on the Calender icon to select the start date.
- To date, click on the Calender icon to select the end date.
- UE ID
- Page Size
Click Load Abnormal Behavior Events.
To obtain load prediction information click Load Prediction.
Enter the JSON string of the prediction in the text box. Click Apply. To discard the changes, click Cancel.
Click Reset to discard the existing values.
This page lists Abnormal Behavior Events information:
- The user can select the number of previous events to be displayed. Select the number of events using the Showing last events drop down list.
- A abnormal events with the following information is displayed:
- Time
- Notify Correlation Id
- SUPI
- Exception ID
Click the Target icon listed against the abnormal event, the event location is displayed on the map. The icon changes to the Location icon.
Use the Arrow icon provided for each of the above parameters to list the values in ascending order.
8.7 Monitoring
- Network Performance Analytics
- User Data Congestion Analytics
- QoS Sustainability Analytics
Figure 8-13 Monitoring
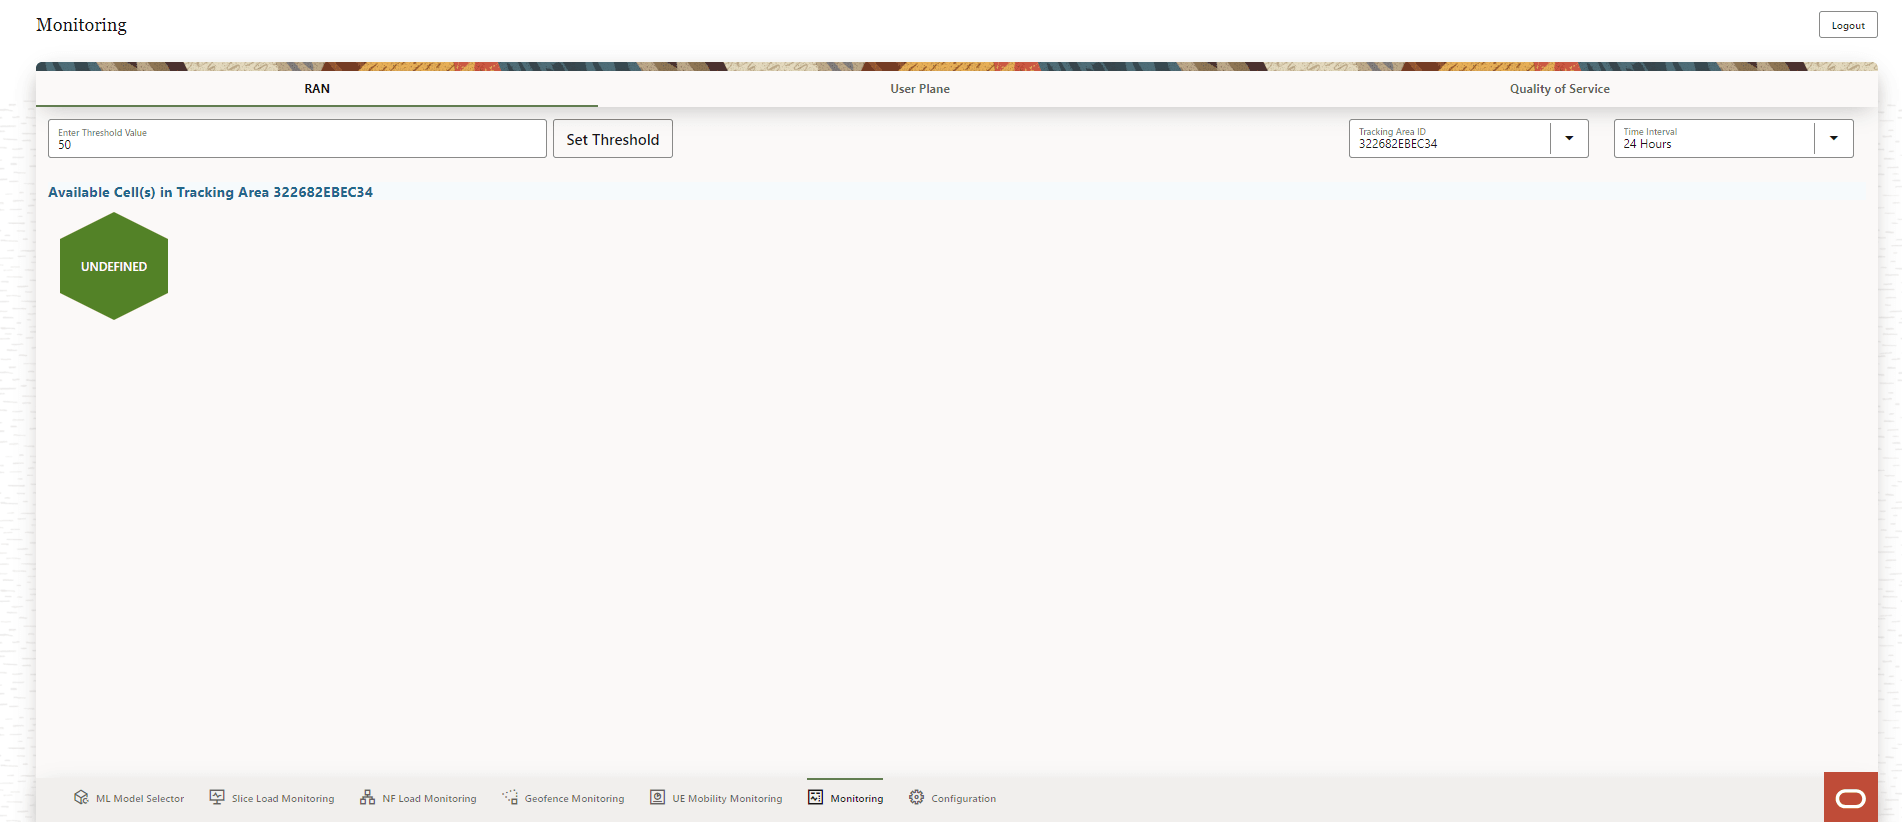
The page includes of three tabs RAN, User Plane, and Quality of Service.
The RAN tab displays information related to Network Performance Analytics,the User Plane tab displays the User Data Congestion Analytics, and the Quality of Service tab displays the QoS Sustainability Analytics reports and trends.
RAN
Click RAN, to see Network Performance Analytics information.
Figure 8-14 RAN
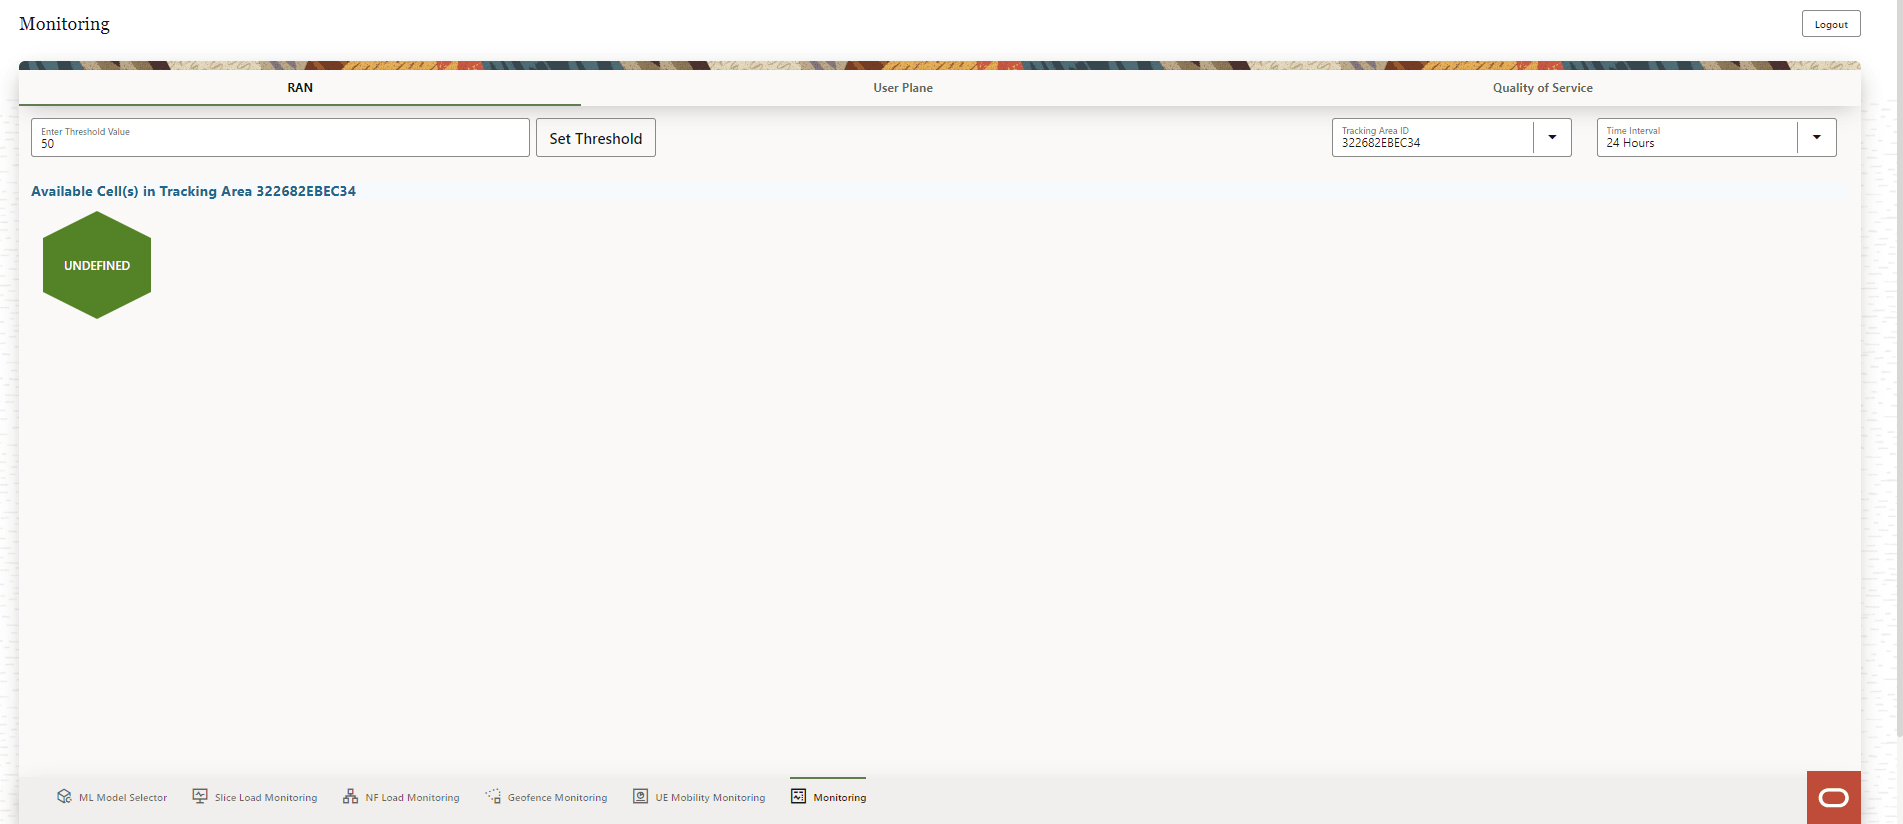
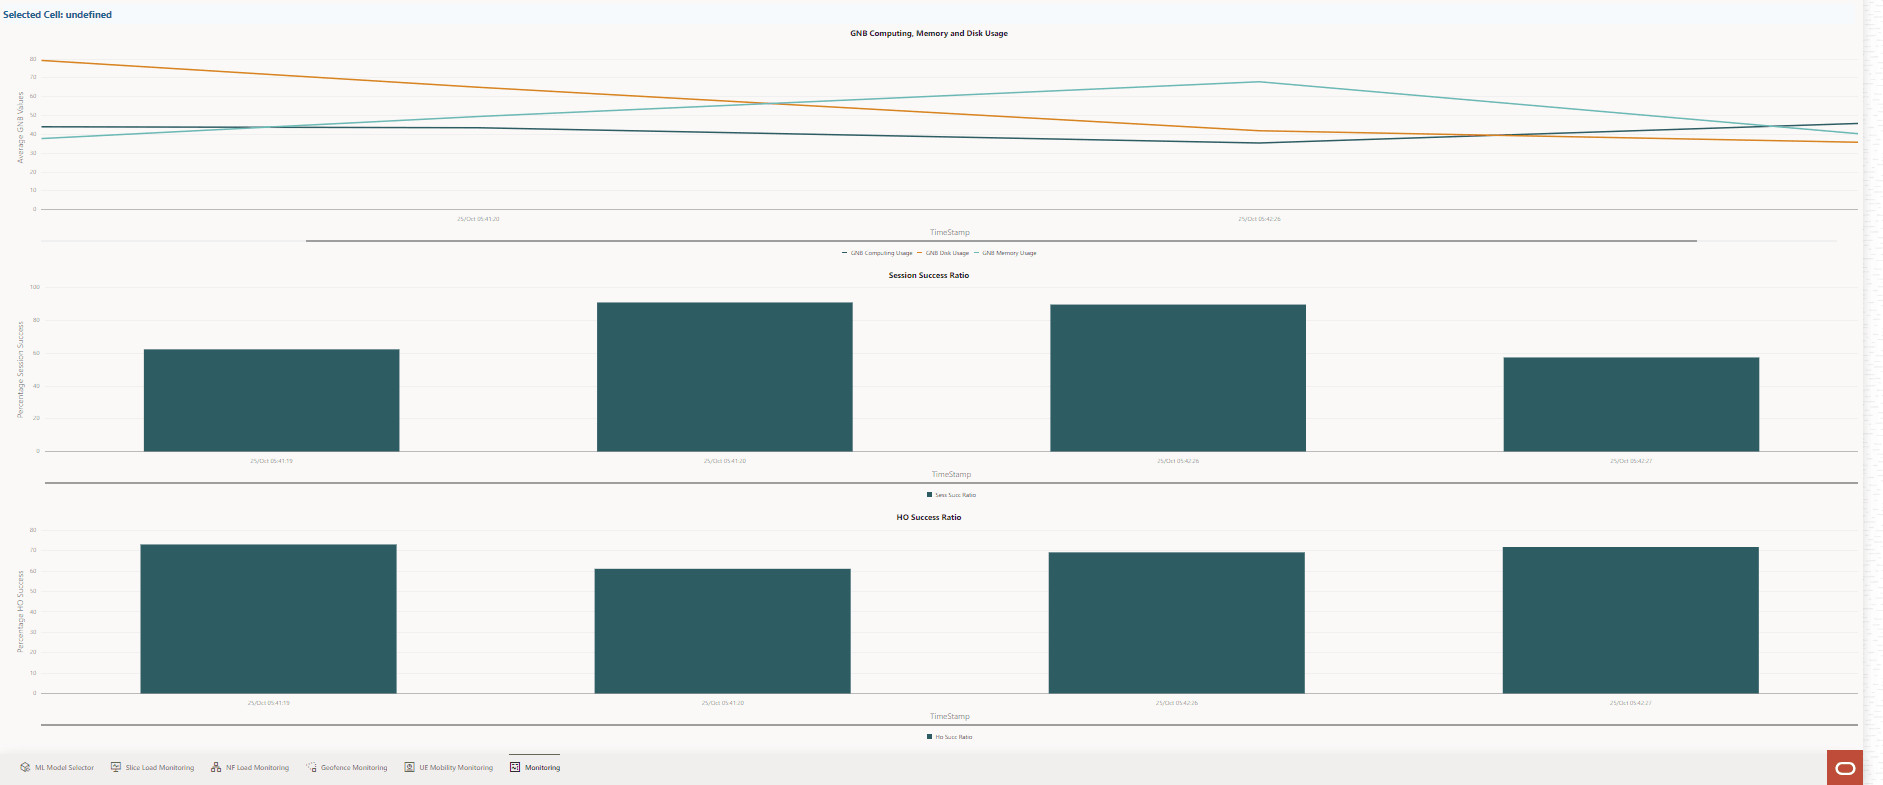
The Available Cell(s) are displayed on the screen. Click any Cell icon. Graphic visualization of resource usage related to the following fields are displayed on the screen:
- GNB Computing, Memory, and Disk Usage
- Session Success Ratio
- HO Success Ratio
For example:
Figure 8-15 Network Performance Resource Utilization
Follow the steps to view information for the selected tracking area, threshold, and time interval:
- To Set Threshold, follow the steps below:
- Provide a threshold value in the Enter Threshold Value text-box. Select a value from 1 up to 100. The default value is 50.
- Click Set Threshold.
- Use the Tracking Area ID drop-down list to select the tracking area for which the analytics information is required.
- Use the Time Interval drop-down list to select the interval for which the analytics information is required. The available interval options are 24 Hours, 48 Hours, 72 Hours, and 96 Hours.
The cells available in the selected Tracking Area ID within the selected Time Interval and threshold value are displayed on the screen. Click any cell to view the graphic visualizations of various parameters related to that cell.
User Plane
Click User Plane to see User Data Congestion Analytics information.
Figure 8-16 User Plane
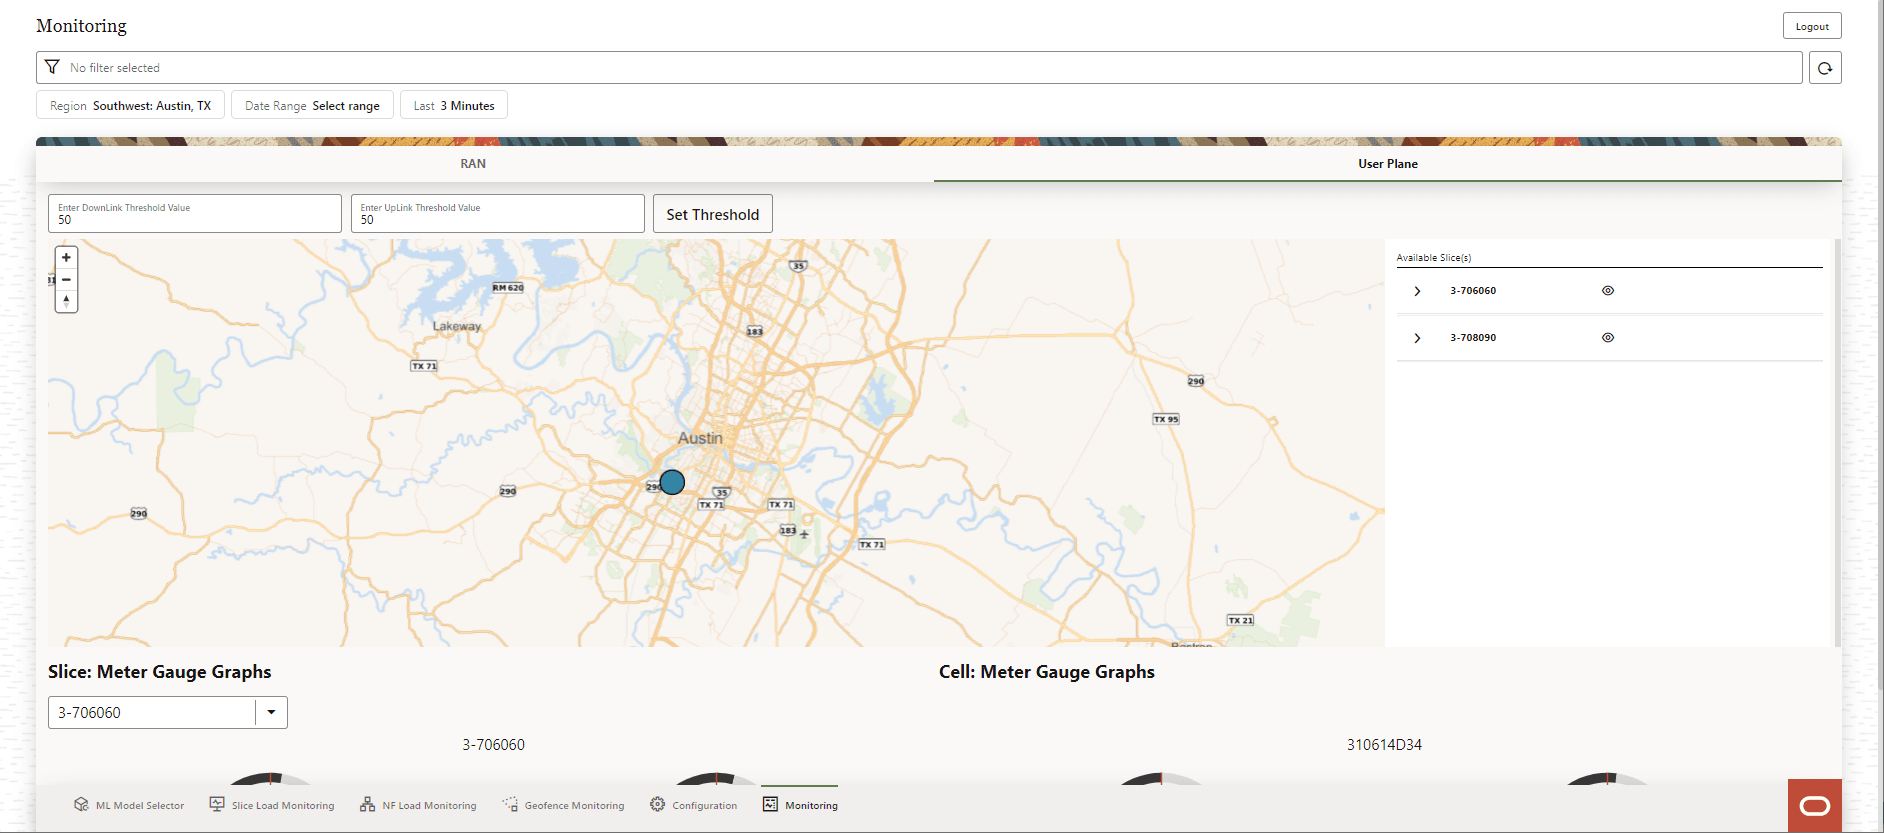
The list Available Slice(s) and Cells are displayed on the right side of the screen. To view or block the display of the slice on the map click Eye icon. Use the Arrow icon to view the list of cells in that slice. Click any Cell on the map, the following graphic visualizations are displayed on the screen:
- Slice:Meter Gauge Graphs: Uplink and downlink values are displayed.
- Cell:Meter Gauge Graphs: Uplink and downlink values are displayed.
To view the downlink and uplink throughput per slice use the dropdown list Slice: Meter Gauge Graphs to select the slice. The Meter Gauges for uplink and downlink throughput for the selected slice is displayed on the screen.
For example:
Figure 8-17 User Data Congestion
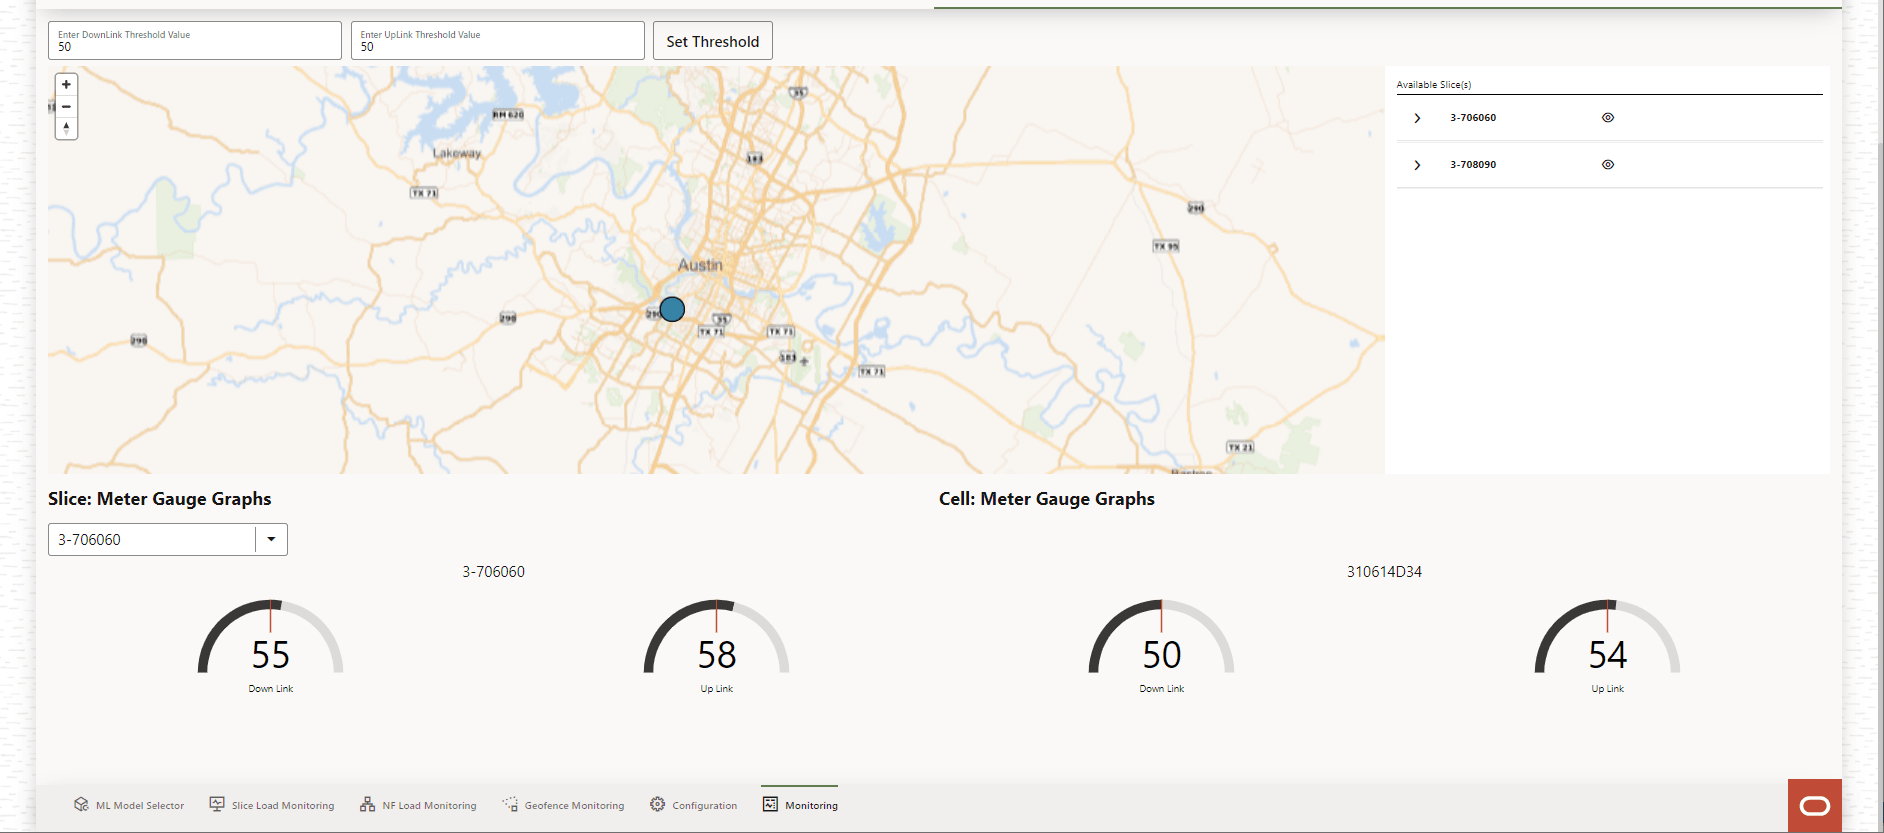
Perform the steps to view information for the specified uplink and downlink threshold values:
- To Set Threshold, follow the steps below:
- Provide a threshold value in the Enter DownLink Threshold Value text-box. The default value and the permitted maximum value is 100.
- Provide a threshold value in the Enter UpLink Threshold Value text-box. The default value and the permitted maximum value is 100.
- Click Set Threshold.
The list of Available Slice(s) within the specified thresholds is displayed on the screen.
Quality of Service
Click Quality of Service, to see QoS Sustainability Analytics information such as QoS trends and reports.
Figure 8-18 Quality of Service
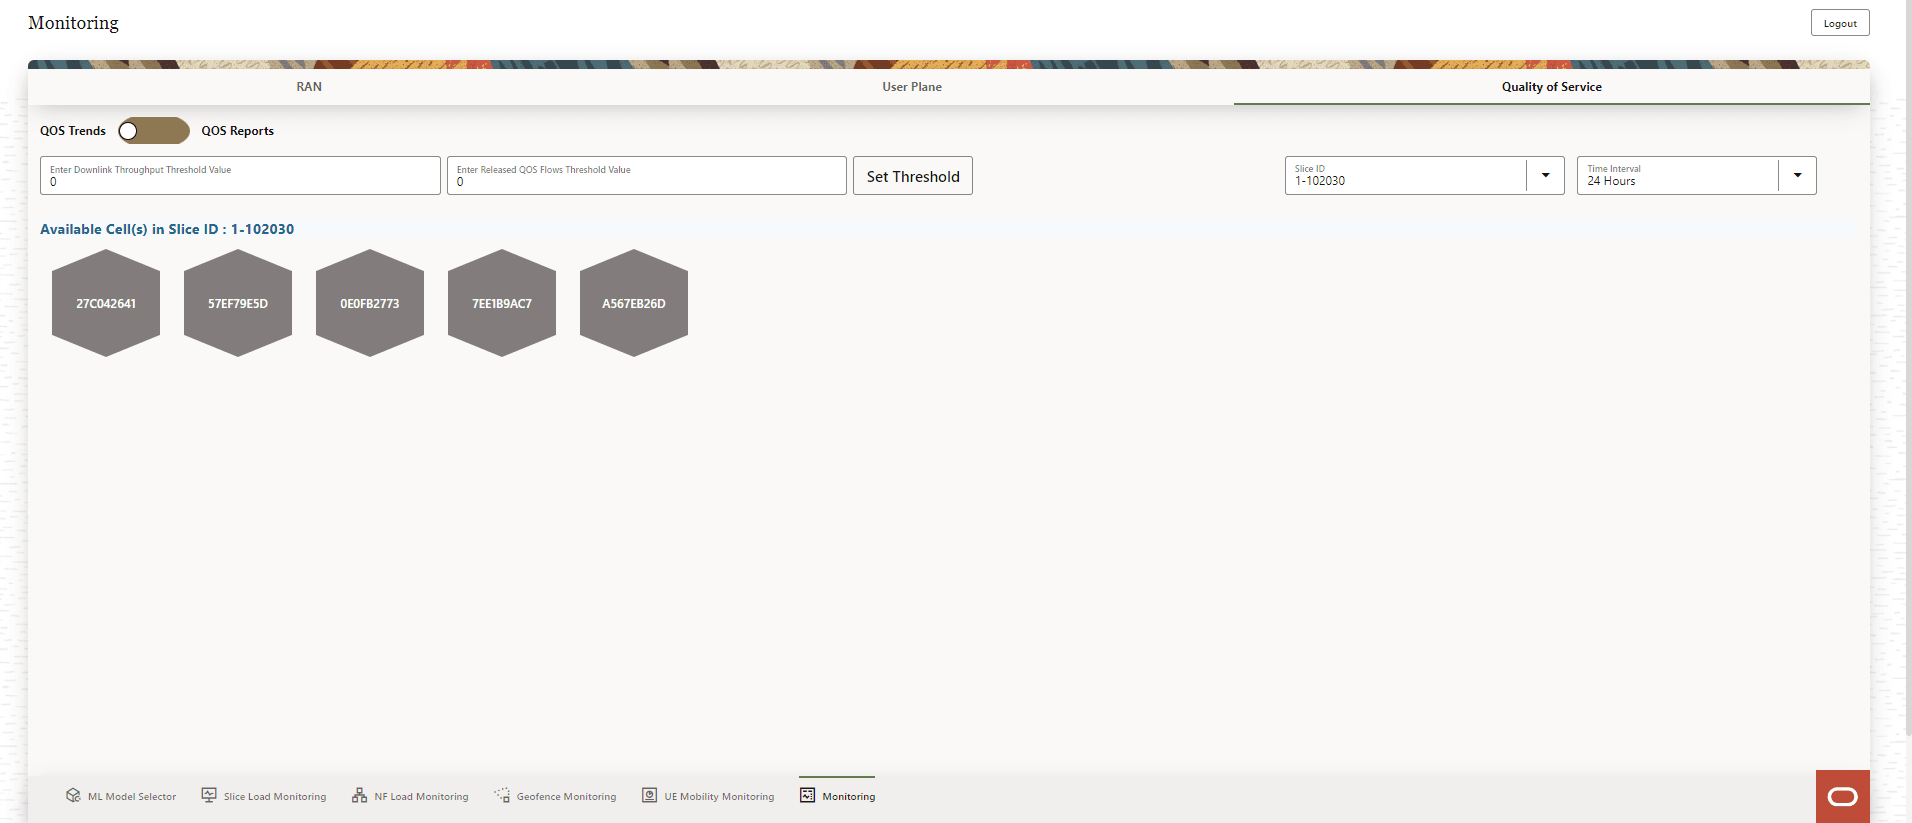
Use the toggle switch to select viewing either the QOS Trends or the QOS Reports.
The Available Cell(s) in the slice are displayed on the screen. Click any Cell icon to view the graphic visualization of QoS analytics.
QOS Trends
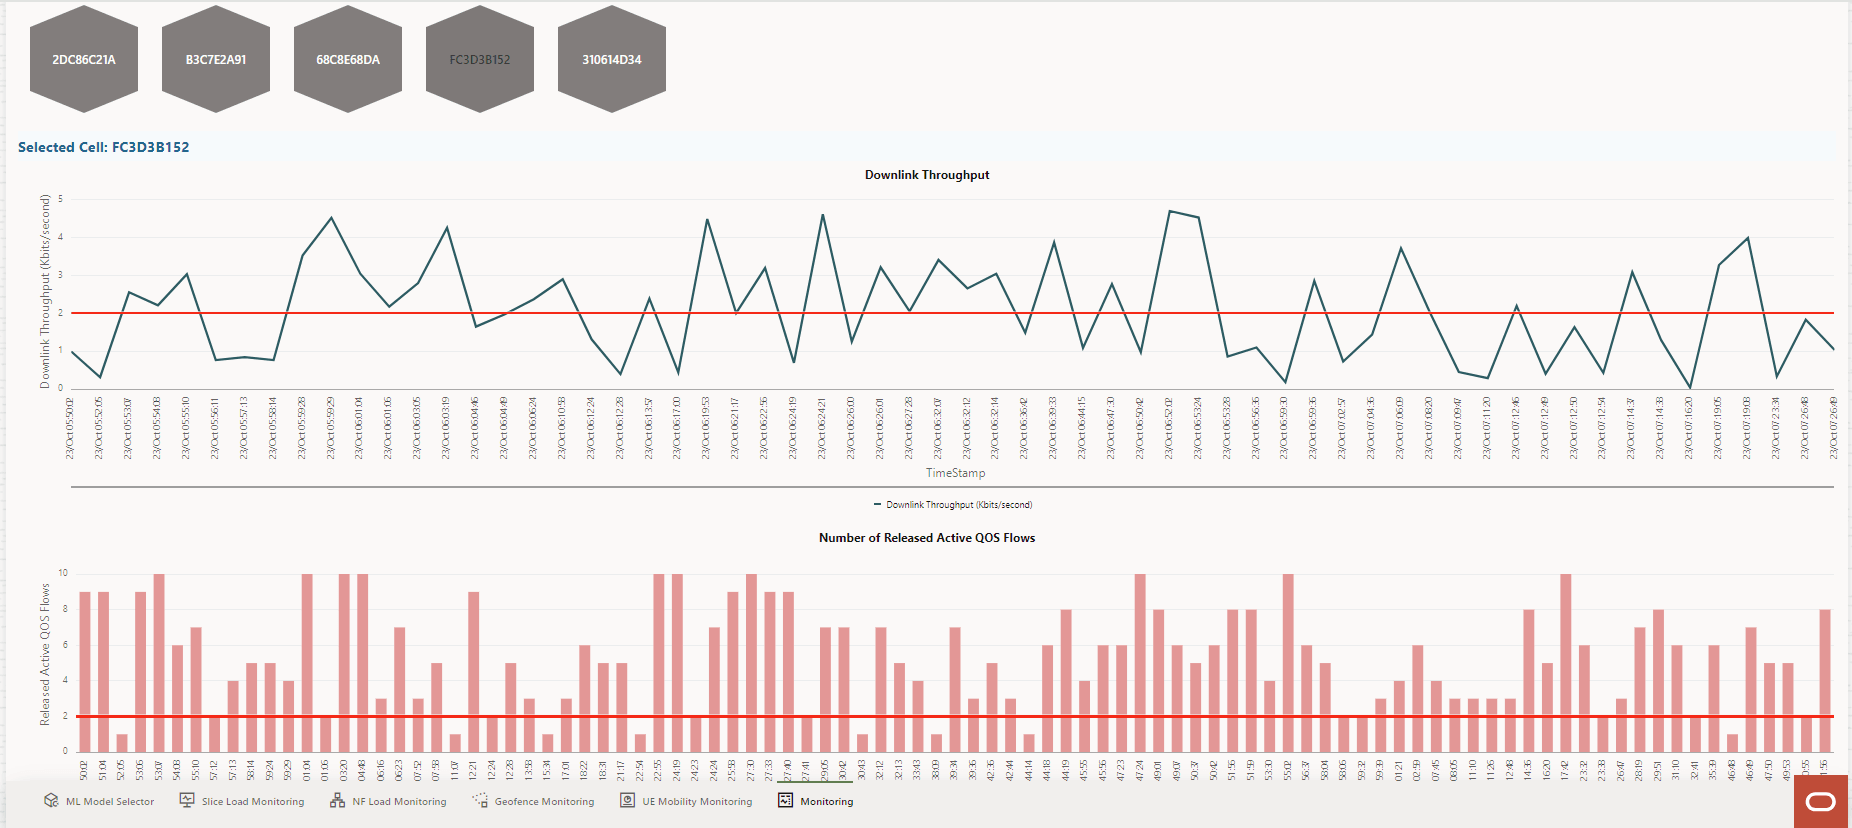
The Available Cell(s) in the selected slice are displayed on the screen. Click any Cell icon. The following graphic visualizations are displayed on the screen:
- Downlink Throughput: A line graph depicting downlink Throughput (Kbits/second) with timestamp (date and time) and the Downlink Throughput threshold values.
- Number of Released Active QoS Flows: A bar graph depicting Released Active QoS Flows with timestamp (date and time) and Release QoS flow threshold values.
Note:
Use the zoom and scroll function on the graphs for a precise view of the data.For example:
Figure 8-19 QoS Trends
QOS Reports
Use the toggle switch, select QOS Reports. The Available Cell(s) in the selected slice are displayed on the screen.
For example:
Figure 8-20 QoS Reports

Click any Cell icon. The following graphic visualizations are displayed on the screen:
- A meter gauge graph displaying the Mean Downlink Throughput (bits/second) for the selected cell is displayed on the screen.
- A meter gauge graph displaying the Count of Released Active QOS Flows for the selected cell is displayed on the screen.
For example:
Figure 8-21 QoS Reports

Follow the steps to view information for a selected Slice ID, threshold, and time interval:
- To Set Threshold, follow the steps below:
- Provide a threshold value in the Enter Downlink Throughput Threshold Value text-box. For QOS Trends, enter a valid value in the range 0 up to the maximum permitted value. The maximum permitted value will be displayed when you click on the text-box. For QOS Reports enter a valid value in the range 0 up to the maximum permitted value. The maximum permitted value will be displayed when you click on the text-box.
- Provide a threshold value in the Enter Released QOS Flows Threshold Value text-box. For QOS Trends the default value is 0 and the permitted range of values is 0 up to the maximum permitted value. The maximum permitted value will be displayed when you click on the text-box. For QOS Reports the default value is 0 and the permitted range of values is 0 up to the maximum permitted value. The maximum permitted value will be displayed when you click on the text-box.
- Click Set Threshold.
- Use the Slice ID drop-down list to select the Slice for which the analytics information is required.
- Use the Time Interval drop-down list to select the interval for which the analytics information is required. The available interval options are 24 Hours, 48 Hours, 72 Hours, and 96 Hours.
The cells available in the selected Slice ID within the selected Time Interval and threshold values are displayed on the screen. Click on any cell to view the graphic visualizations of various parameters related to that cell.
8.8 Configuration
The Configuration page displays options to configure Slices Settings and Geofences Settings.
Figure 8-22 Configuration
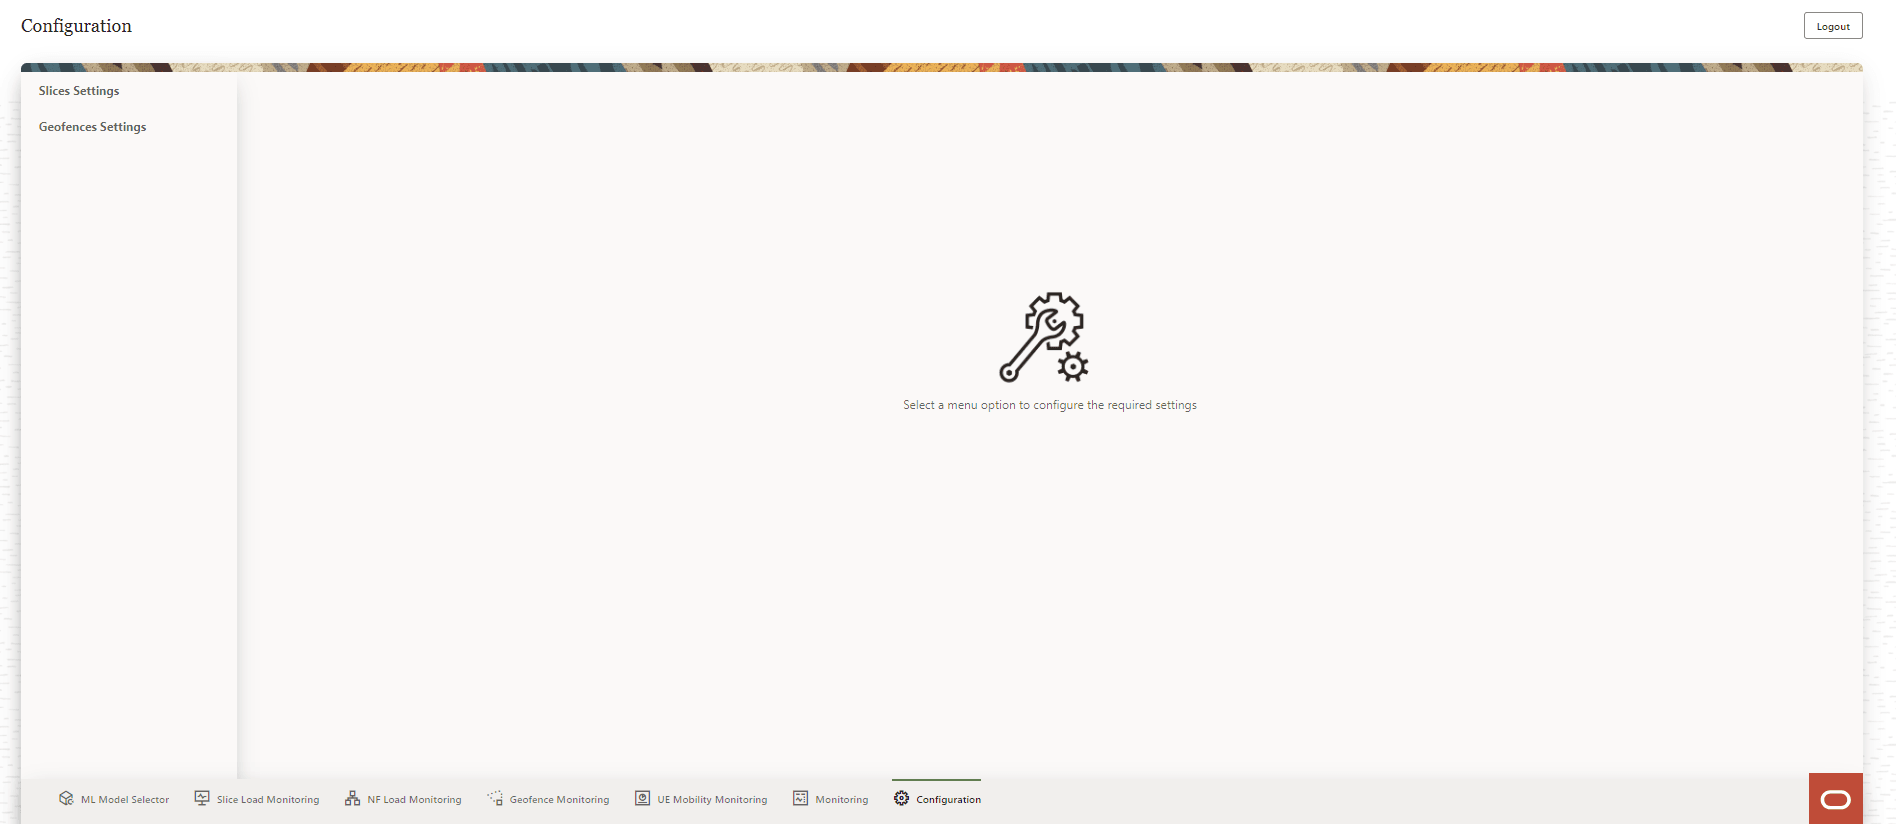
The user can perform the following actions through the Configuration page:
- Access the Slice Settings page.
- Access the Geofence Settings page.
8.8.1 Slices Settings
The Slices Settings page provides an option to Add New Slice and view the Slice Settings of all the configured slices.
Figure 8-23 Slice Settings
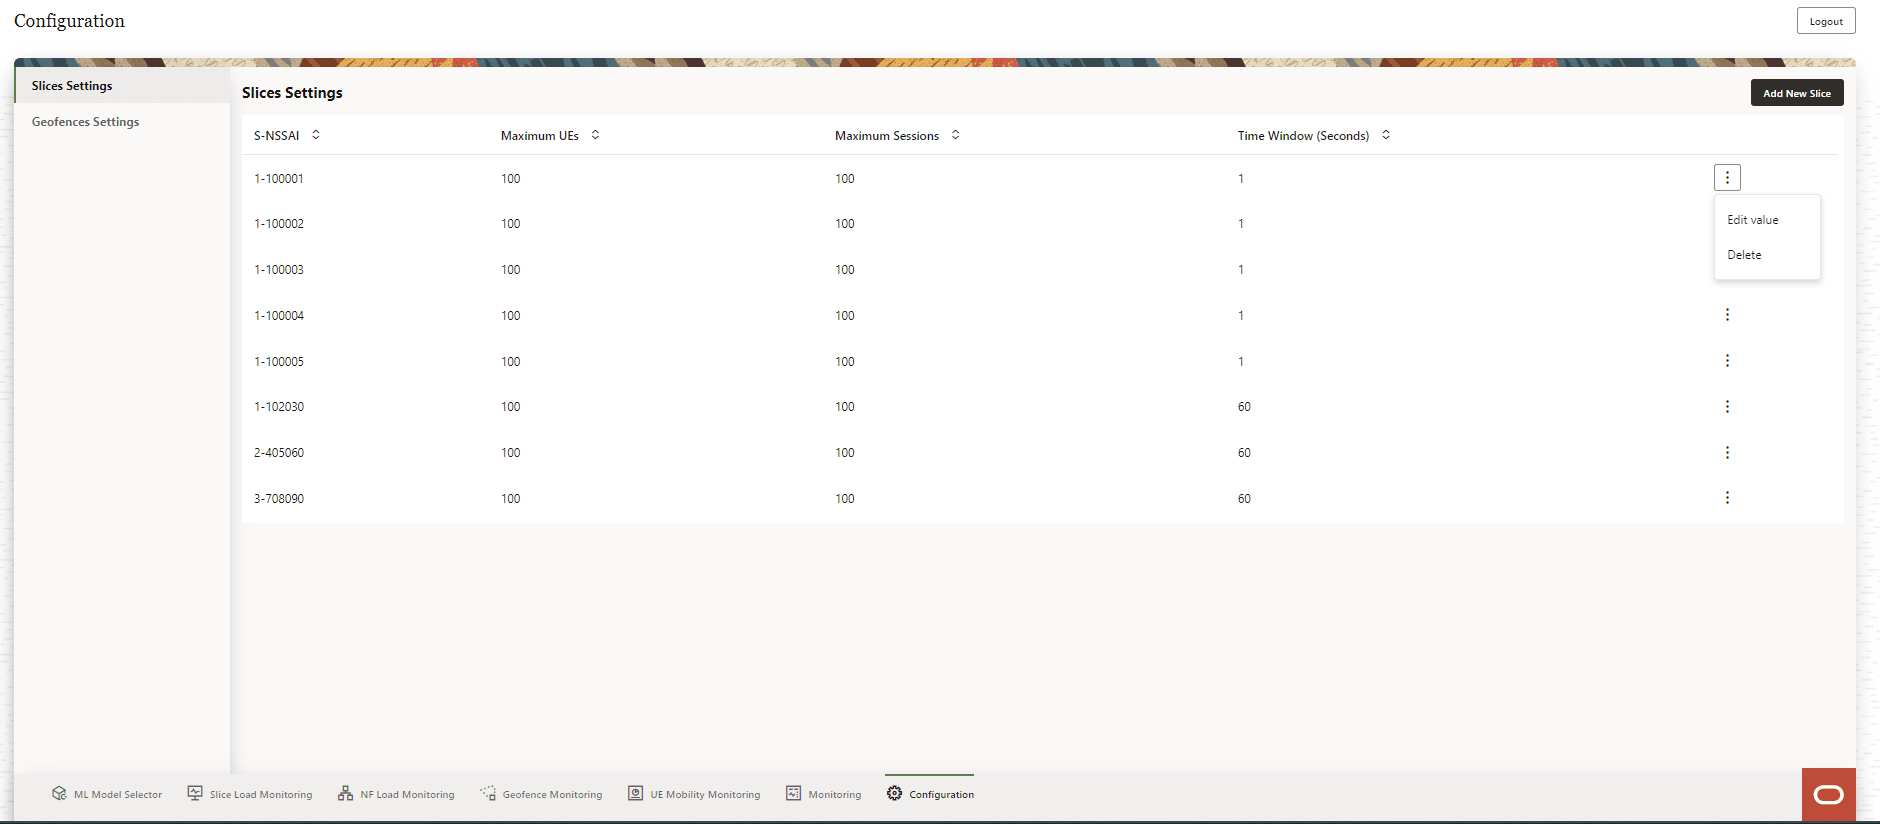
The user can perform the following actions on the Slices Settings page:
- Add New Slice
- View the configured slices and the slice parameters:
- S-NSSAI
- Maximum UEs
- Maximum Sessions
- Time Window (Seconds)
Use the Arrow icon provided for each of the above parameters to list the values in ascending order.
- Click the vertical Ellipses icon to edit a slice. The Edit Value option appears in a pop-up window.
- Click the vertical Ellipses icon to delete a slice. The Delete option appears in a pop-up window.
8.8.1.1 Add New Slice
To add a new slice, click Add New Slice on the Slices Settings screen. The Add Slice form appears on the right side of the screen:
Figure 8-24 Add Slice
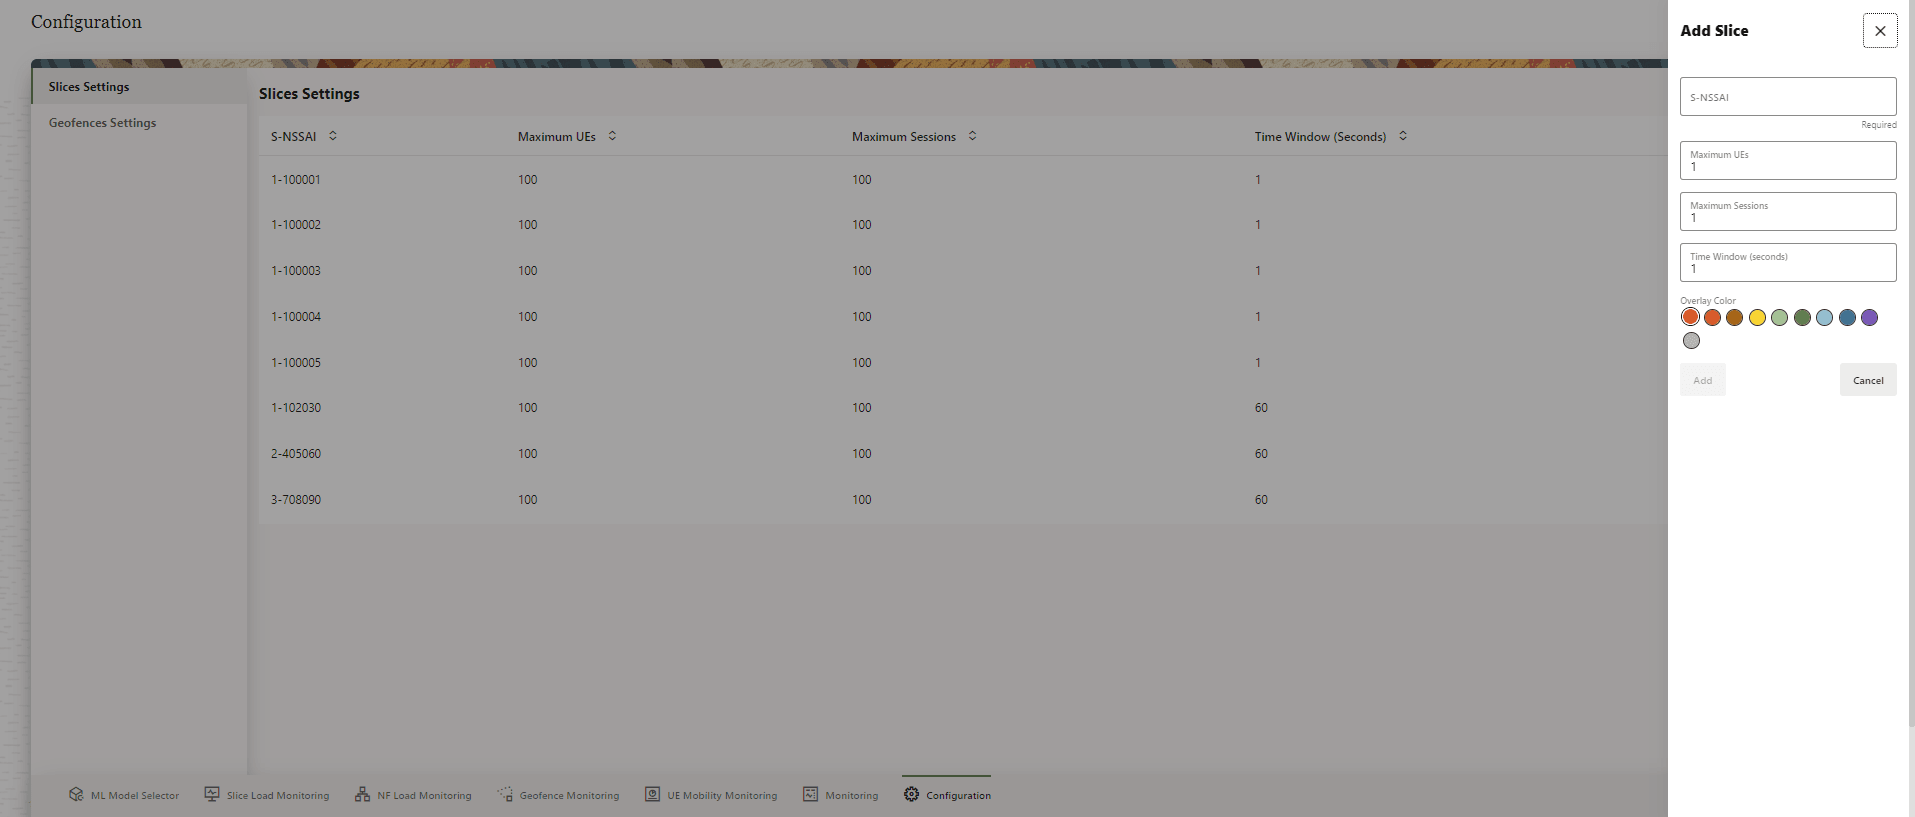
Provide the following information to create a new slice:
Table 8-4 Add Slice
| Parameter | Type | Description |
|---|---|---|
| S-NSSAI | String | The S-NSSAI is the network slice identifier. This parameter is mandatory. |
| Maximum UEs | Integer | The maximum number of user equipments allowed in the slice. |
| Maximum Sessions | Integer | The maximum number of sessions allowed in the slice. |
| Time Window (seconds) | Seconds | Threshold detection window time. Default: 5 minutes. |
| Overlay Color | Color | Select a display color for the slice. |
Click Add to create a new slice. The new slice is listed in the Slices Settings screen.
To discard the changes click Cancel.
8.8.1.2 Edit Slice
In the Slices Settings screen, click the vertical Ellipses icon on the right side of the slice to be edited.
Click the Edit Value option that appears in a pop-up window.
The Edit Slice form appears on the right side of the screen.
Figure 8-25 Edit Slice
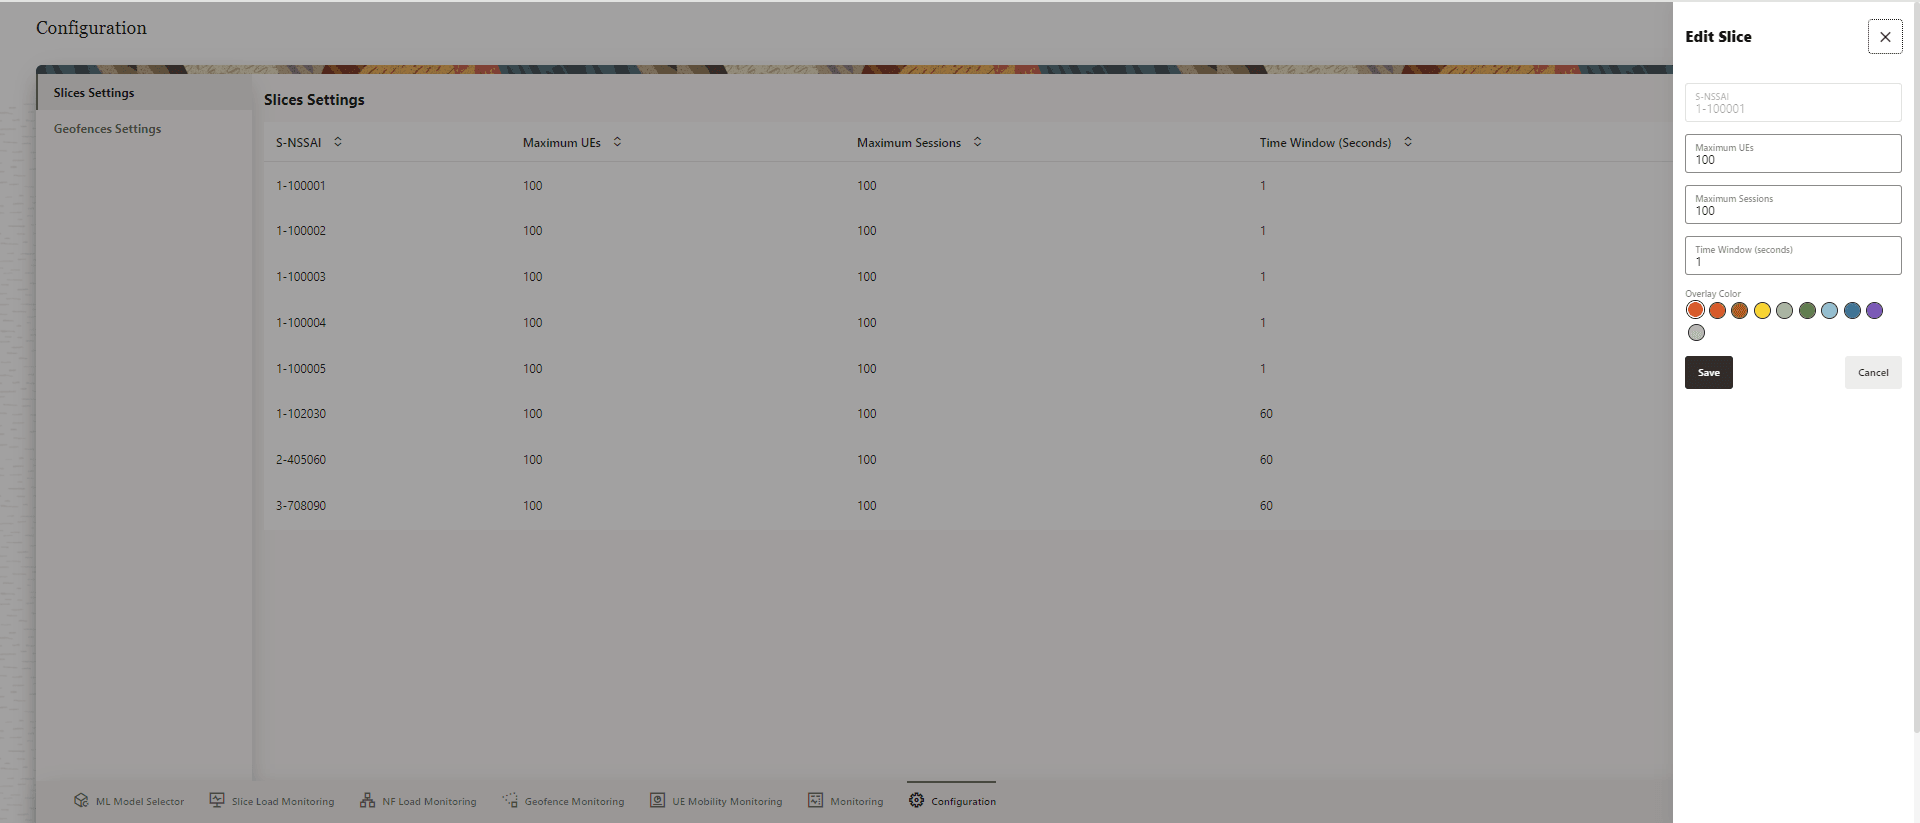
Note: The S-NSSAI of the slice cannot be modified.
Modify the required fields to edit the slice. Click Save to apply the changes to the slice. Click Cancel to discard the changes.
8.8.1.3 Delete Slice
To delete a slice, click the vertical Ellipses icon on the right side of the slice to be deleted. Click Delete option that appears in a pop-up window.
A Delete Slice confirmation dialog box appears on the screen.
Figure 8-26 Delete Slice
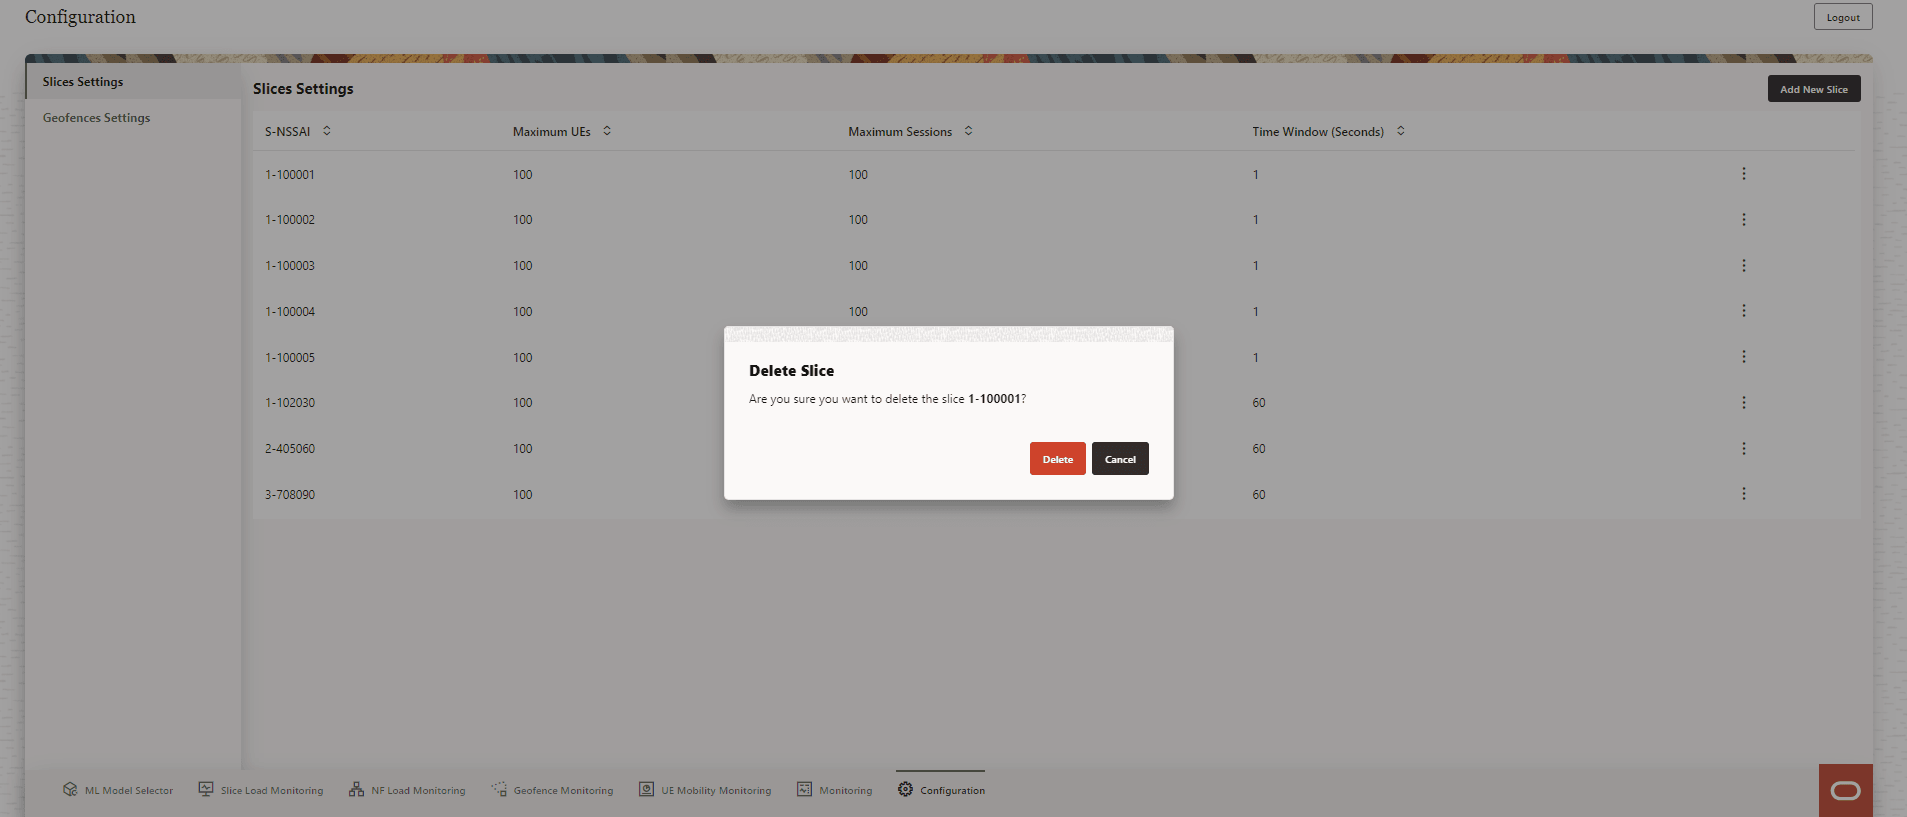
Click Delete to confirm deletion or Cancel to discard slice deletion.
After the slice is successfully deleted, a Success message appears on the screen.
8.8.2 Geofence Settings
The Geofence Settings page provides an option to Add New Geofence and view the Geofence Settings of all the configured geofences.
Figure 8-27 Geofences Settings
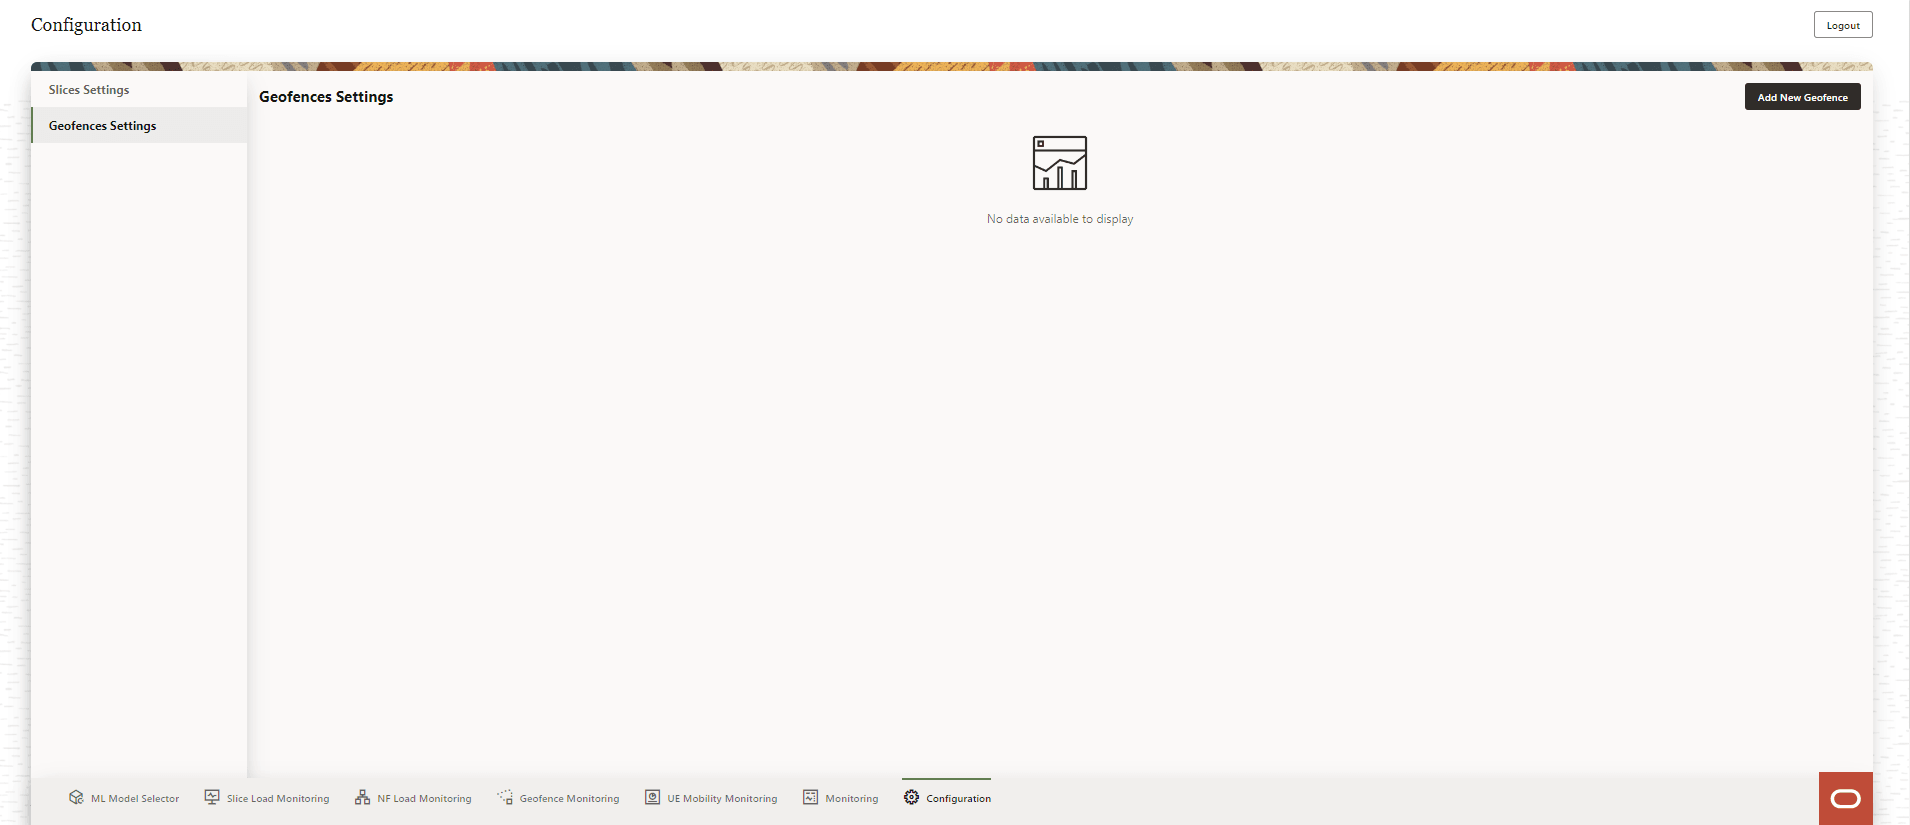
The user can perform the following actions on the Geofences Settings screen:
- Add New Geofence
- View the configured geofences and the geofence parameters:
- Name
- Region
Use the Arrow icon provided for each of the above parameters to list the values in ascending order.
- Click the vertical Ellipses icon to edit a geofence. The Edit Geofence option appears in a pop-up window.
- Click the vertical Ellipses icon to delete a geofence. The Delete Geofence option appears in a pop-up window.
8.8.2.1 Add New Geofence
To add a new geofence, click Add New Geofence in the Geofence Settings screen. A form with the fields to add a new geofence Add Geofence, appears on the right side of the screen:
Figure 8-28 Add Geofence
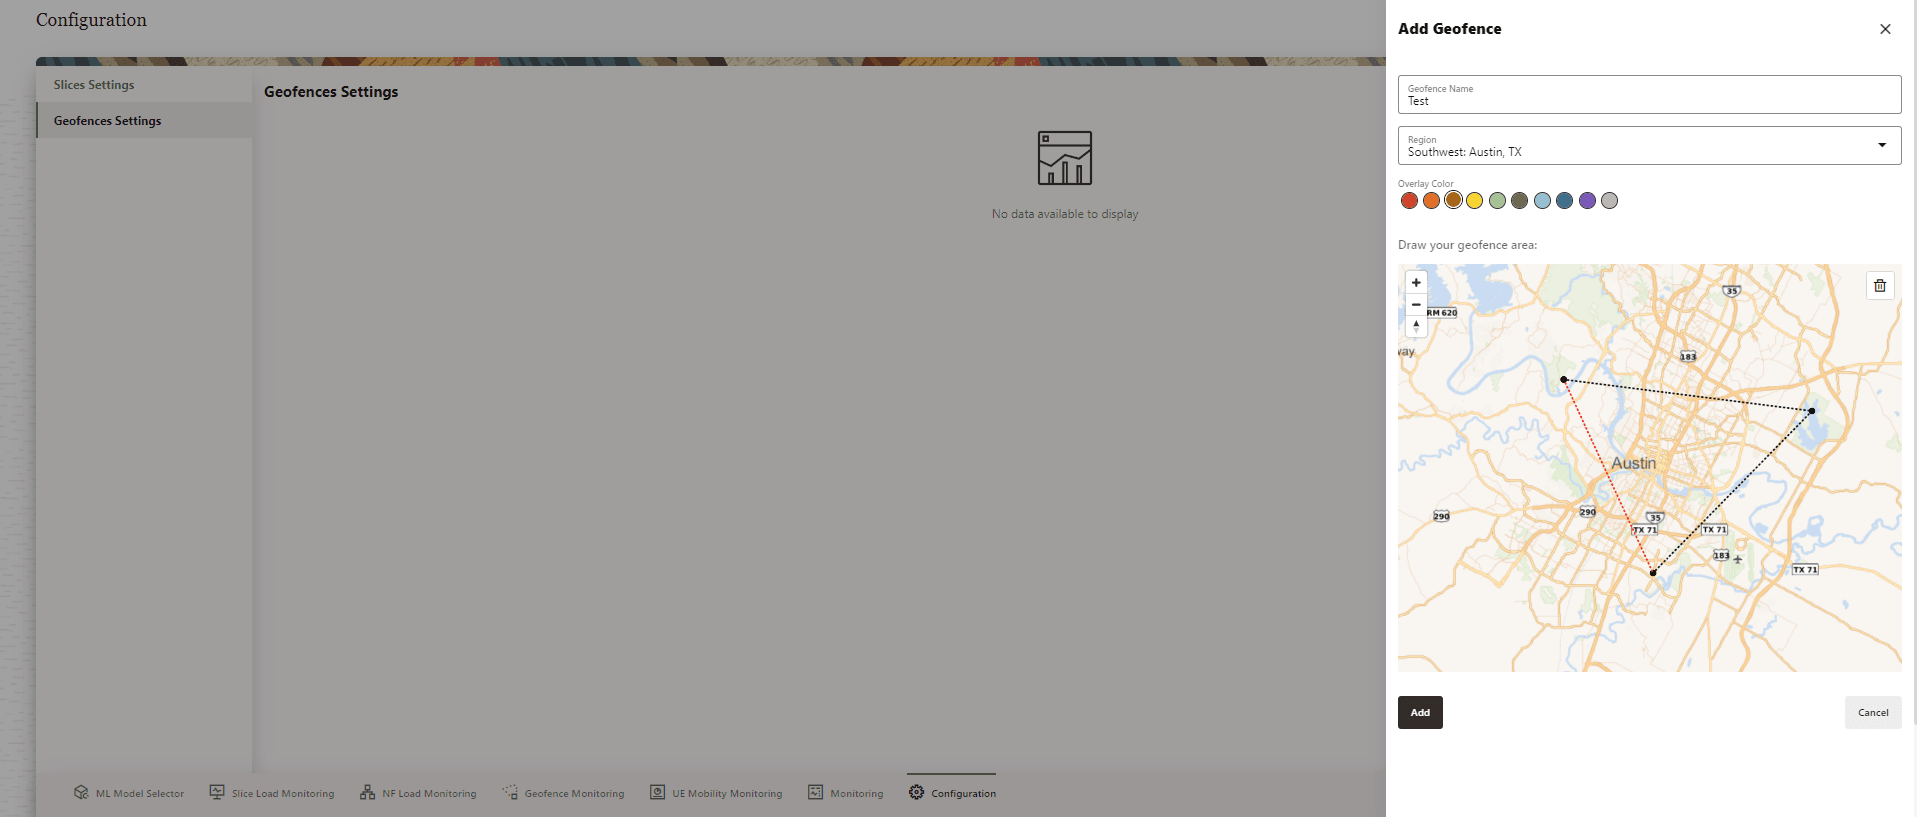
Provide the following information to create a new geofence:
- Provide a Geofence Name. This is a required field.
- Select Region from the drop-down list.
- Select an Overlay Color for the geofence.
- A map to Draw your geofence area appears on the screen. Click on the map to select the geofence co-ordinates, the region formed by the co-ordinates defines the geofence area.
Click Add to create a new geofence. A success message appears on the screen. The new geofence is listed on the Geofence Settings screen. Click Cancel to discard the changes.
8.8.2.2 Edit Geofence
To edit a geofence, click the vertical Ellipses icon on the right side of the geofence to be edited.
Figure 8-29 Edit Value
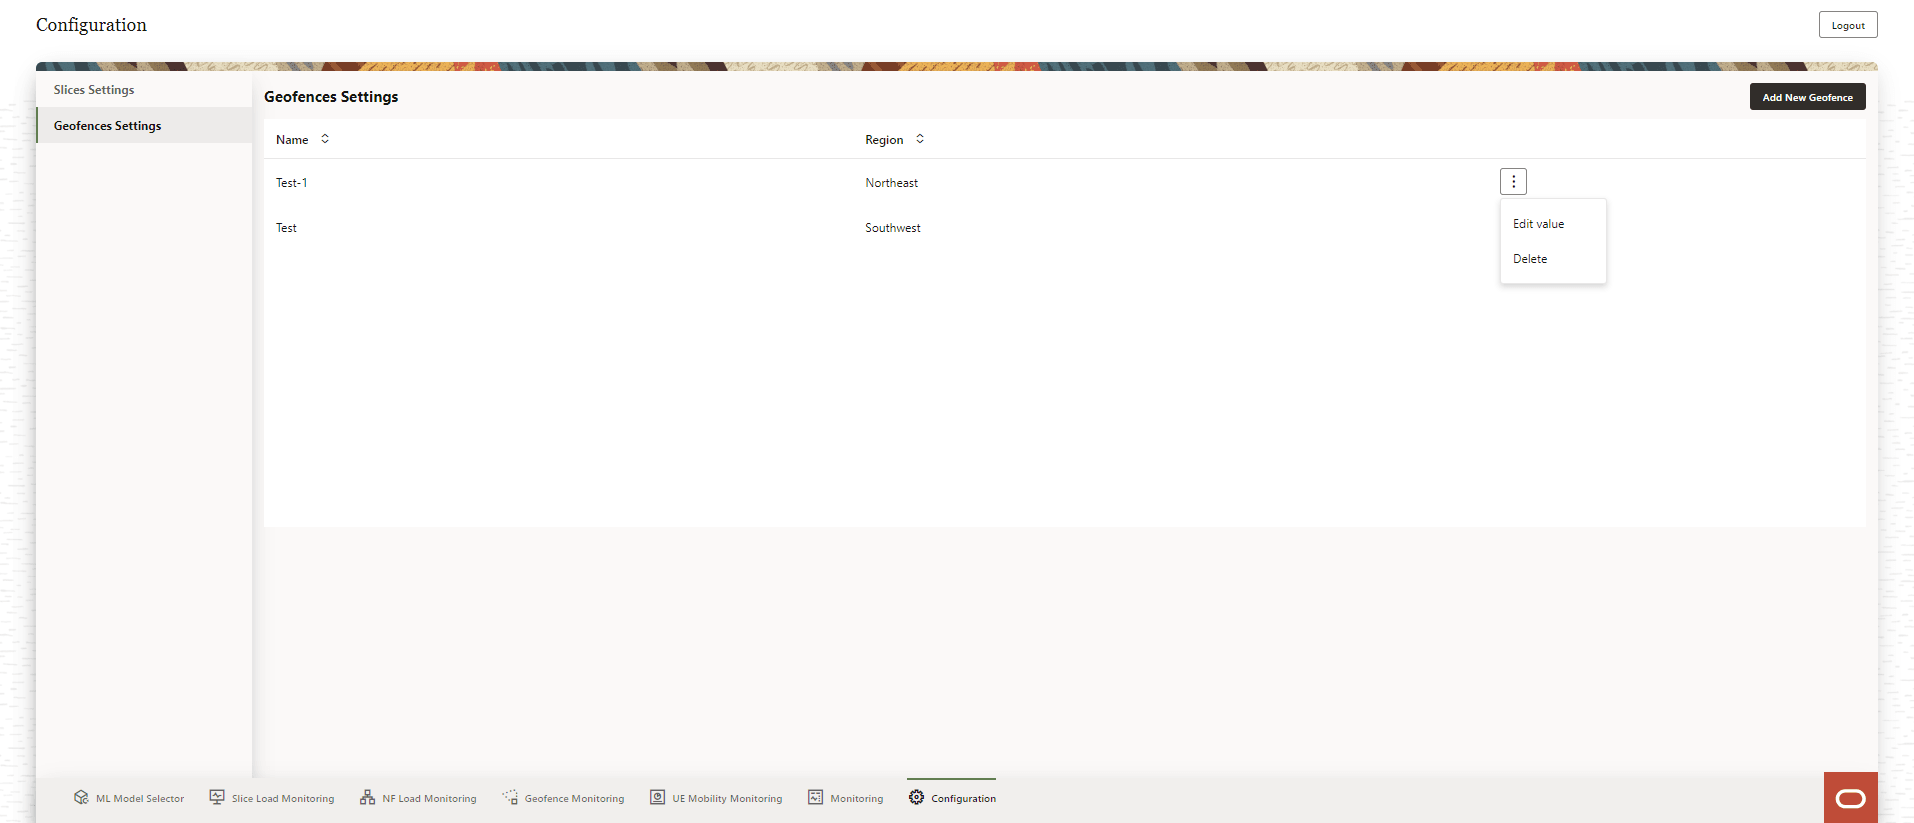
Click the Edit Value option that appears in a pop-up window.
The Edit Geofence form appears on the right side of the screen.
Figure 8-30 Edit Geofence
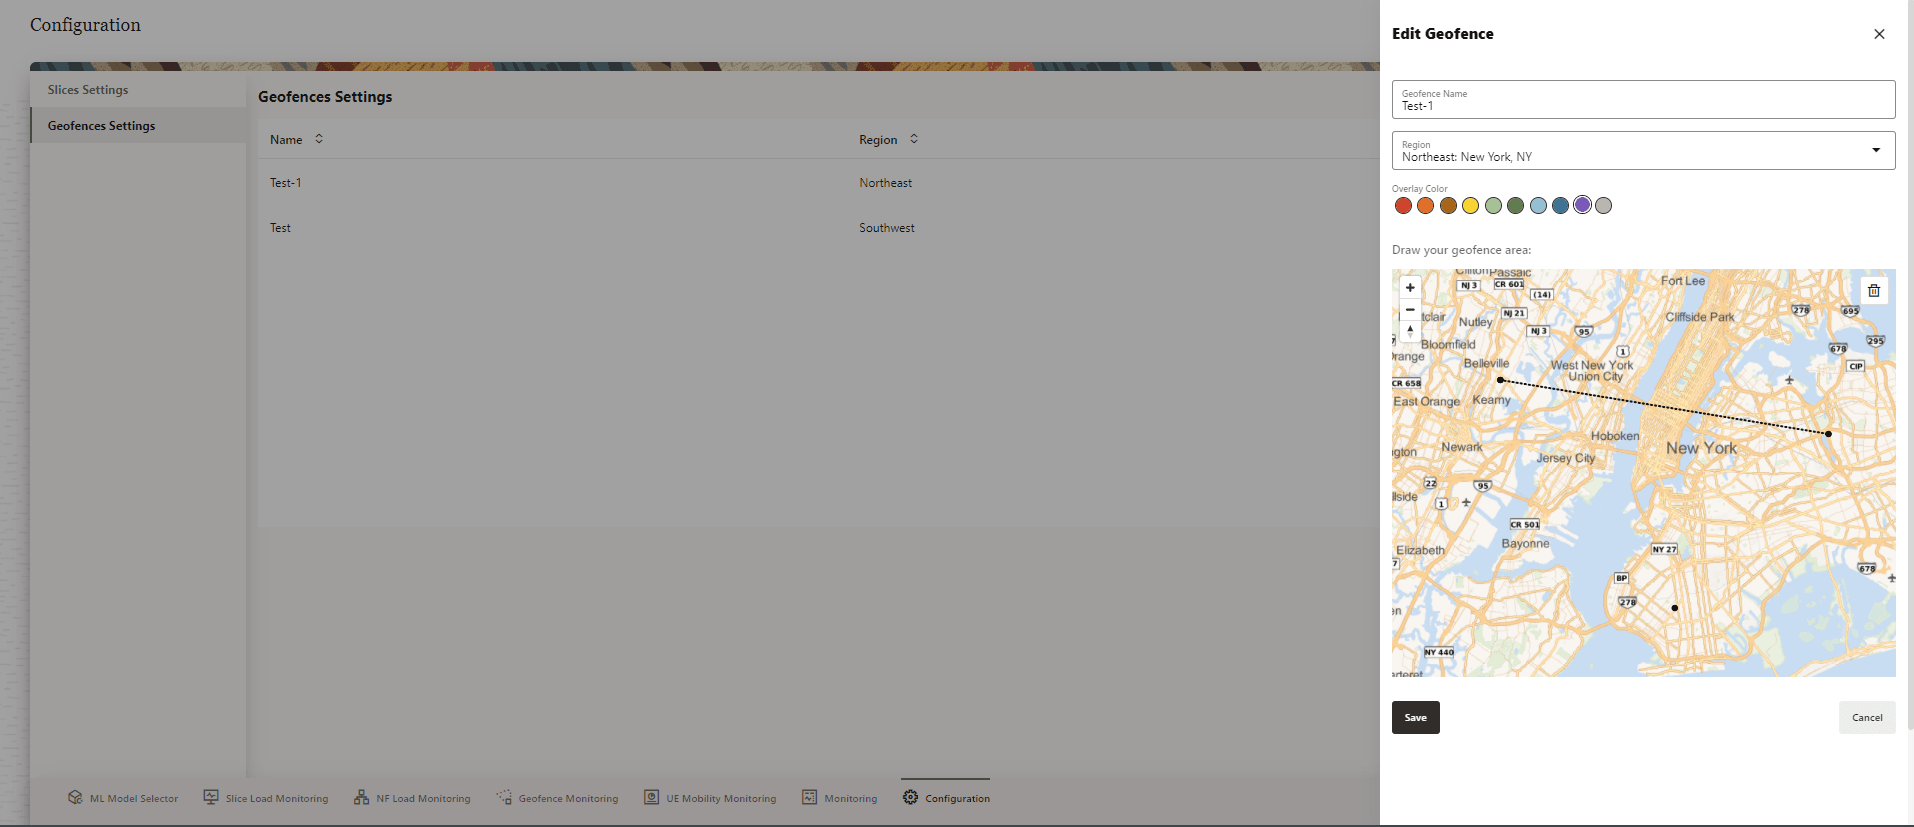
Modify the required fields to edit the geofence. Click Save to apply the changes to the geofence or click Cancel to discard the changes.
8.8.2.3 Delete Geofence
To delete a geofence, click the vertical Ellipses icon on the right side of the geofence to be deleted. Click Delete option that appears in a pop-up window.
A Delete Geofence confirmation dialog box appears on the screen.
Figure 8-31 Delete Geofence
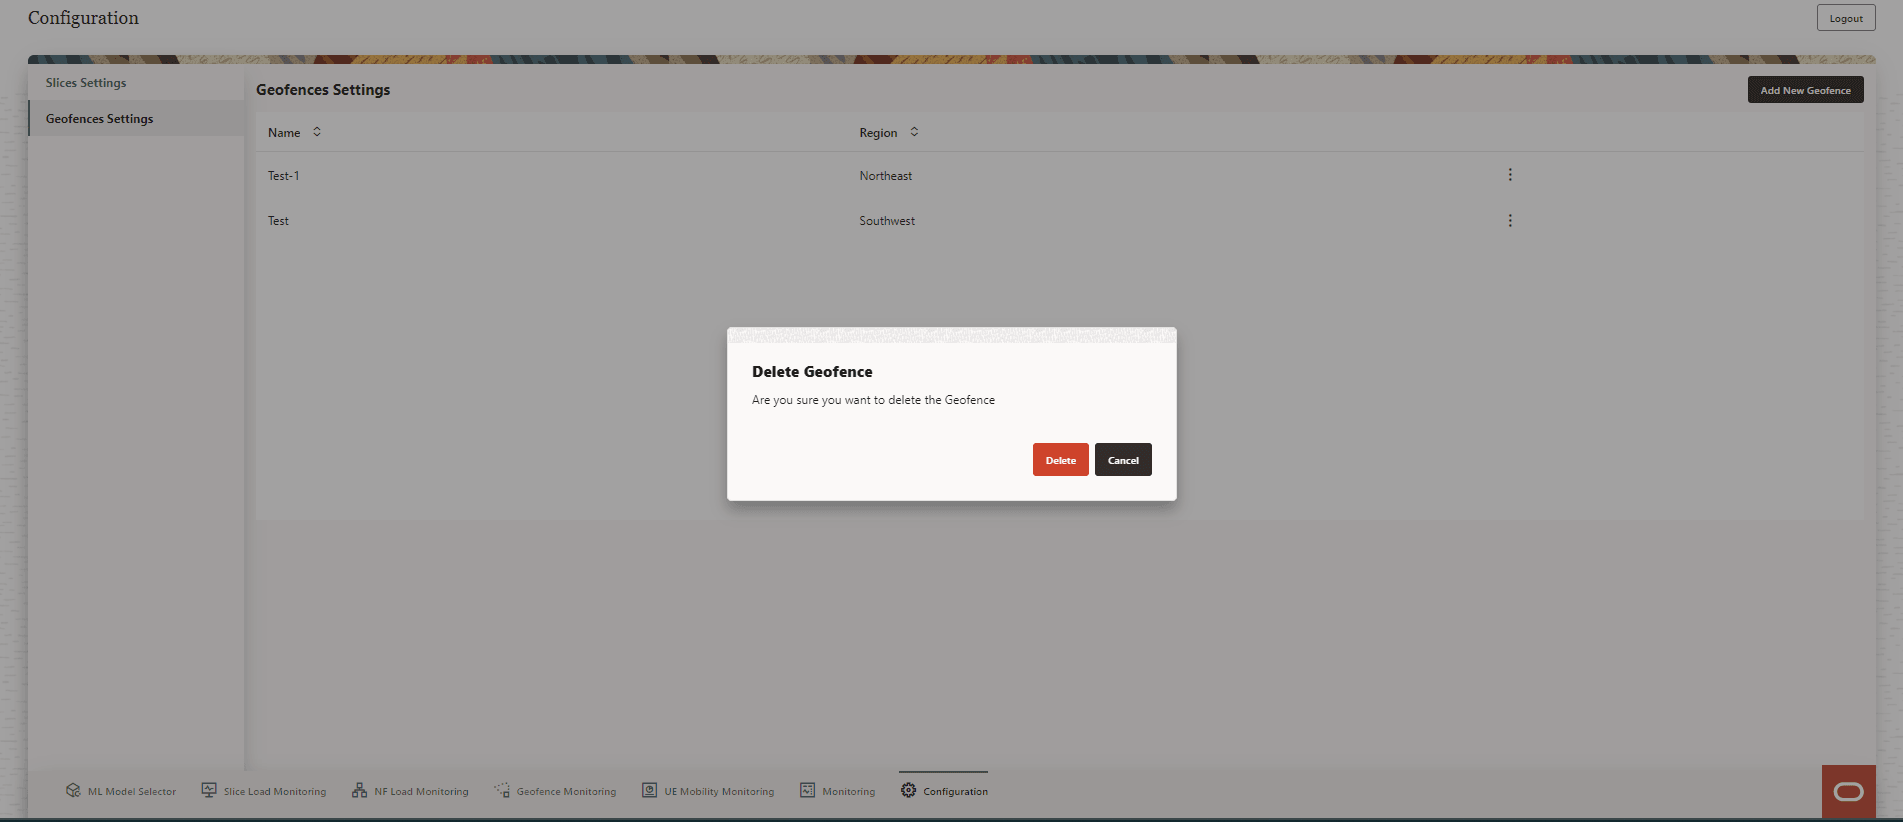
Click Delete to confirm deletion or Cancel to discard geofence deletion.
After the geofence is successfully deleted, a Success message appears on the screen.