4 Running Test Cases Using ATS
4.1 Running NWDAF Test Cases using ATS
This section describes how to run Networks Data Analytics Function (NWDAF) test cases using ATS.
Prerequisites
To run NWDAF test cases, ensure that the following prerequisites are met:
- The ATS version must be compatible with the NWDAF release.
- The NWDAF and ATS must be deployed in the same namespace.
- The NWDAF must be deployed using the appropriate
values.yamlfile as per the configuration to be tested. - Ensure a nodePort or LoadBalancer port is available for "ocats-nwdaf-deploy".
Logging into ATS
Running ATS
Before logging in to ATS, you need to ensure that ATS is deployed successfully using HELM charts.
For more information on verifying ATS deployment, see Verifying ATS Deployment.
Note:
To modify default log in password, refer to Modifying Login Password.Build the Jenkins host IP and load the Jenkins tool, run the following command to obtain the ocats-nwdaf-deploy service port:
kubectl get svc -n <namespace> | grep ocats-nwdaf-deploy- Obtain the node and pod name, run the following command:
kubectl get pod -o=custom-columns=NODE:.spec.nodeName,NAME:.metadata.name -n <namespace> | grep ocats-nwdaf-deploy - If an external IP is used, obtain the external Kubernetes node IP. Run the following command:
kubectl get no -o wide - Build the IP host as <External Node IP> : <Host IP>
ATS Login
-
To log in to ATS, open a browser and provide the IP Address and port details as <Worker-Node-IP>:<Node-Port-of-ATS>.
Figure 4-1 ATS Login
To run ATS, enter the login credentials. Click Sign in.
-
Cuztomize Jenkins page appears. Close this page.
- Jenkins is ready! page appears, click Start Using Jenkins.
-
Dashboard screen displaying the NWDAF preconfigured pipelines appears.
Figure 4-2 Pipelines

The NWDAF ATS has three configured pipelines:
- NWDAF-NewFeatures
- NWDAF-Performance
- NWDAF-Regression
Configure NWDAF Pipelines
To run configure a pipeline perform the following steps:
- The user database access includes permission to retrieve, update, and delete information.
- The user has logged in to the Jenkins page with admin credentials.
- Select the pipeline you want to run the test cases on, click NWDAF-NewFeatures in the Name column. The following screen appears:
Figure 4-3 Pipeline Configuration

In the above screen:
- Click Configure to configure the NWDAF pipeline.
- Click Build History box to view all the previous pipeline executions, and the Console Output of each execution.
- The Full Stage View represents the previously run pipelines for reference.
- The Test Results Analyzer is the plugin integrated into the OCNWDAF-ATS. This option can be used to display the build-wise history of all the executions. It will provide a graphical representation of the past execution together.
- Click Configure to configure the environment parameters of the pipeline. User must wait for the page to load completely. Once the page loads completely, move to the Pipeline section:
Note:
Make sure that the following page loads completely before you perform any action on it. Also, do not modify any configuration other than shown below.Figure 4-4 Configure Pipeline
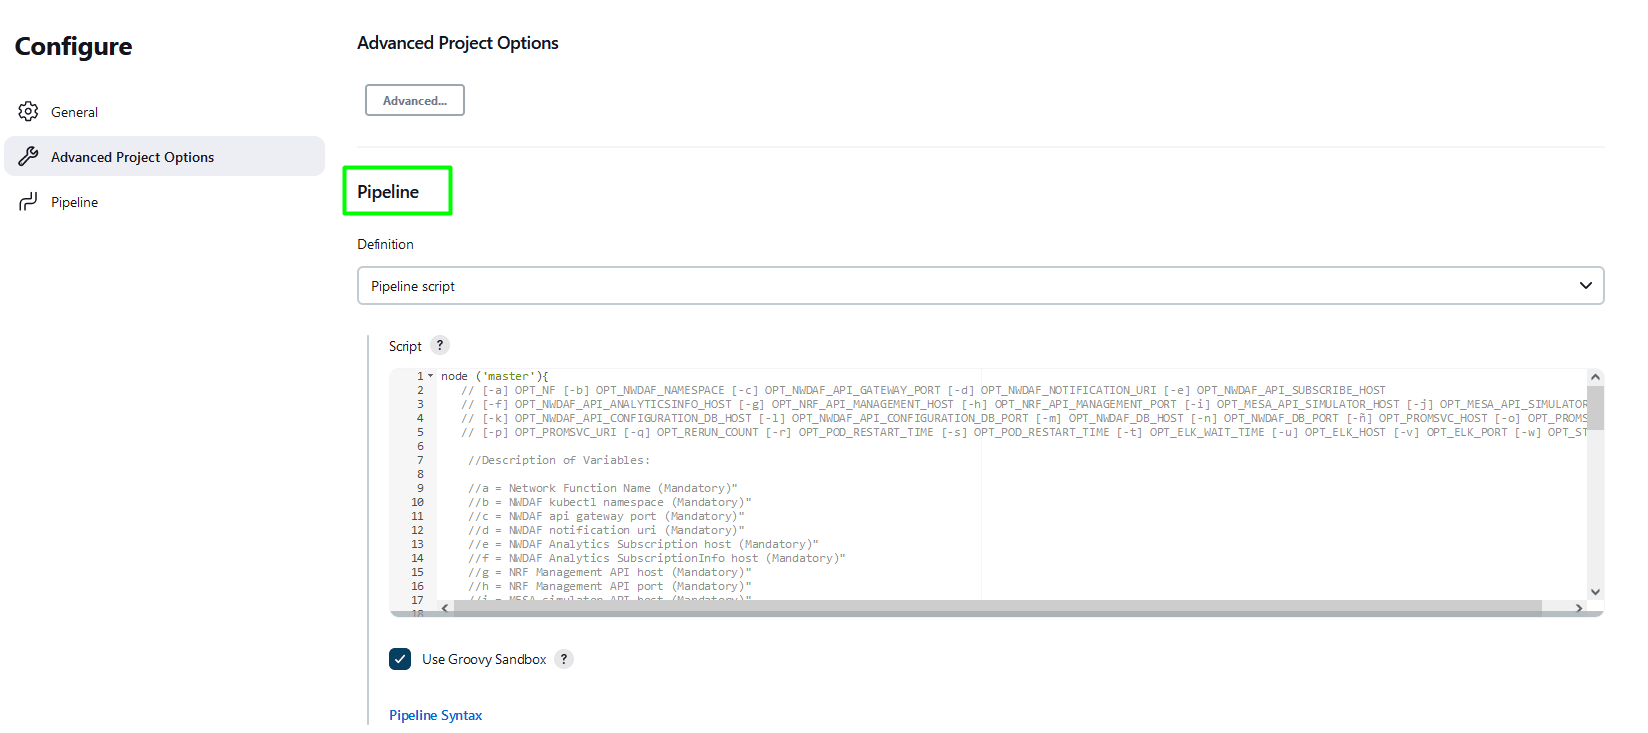
Note:
Remove the existing default content of the pipeline script. - Depending on the pipeline you want to configure, use the respective script. The following scripts are available at:
/var/lib/jenkins/ocnwdaf_tests/pipeline_scripts:- NewFeatures_Pipeline_script.txt
- Regression_Pipeline_script.txt
- Performance_Pipeline_script.txt
- Update the script of the pipeline you want to configure, and update the parameters according to the ATS and NWDAF environment you want to test.
- - b : Use this option to update the namespace according to the current namespace being used.
- - c : Use this option to update the service name of the Ingress gateway according to the current service name of the Ingress gateway being used.
Run the following command in the NWDAF console to verify the current service name of the Ingress gateway:
kubectl get svc -n <namespace_name> | grep ingressFor example:
kubectl get svc -n mdc-nwdaf-qa | grep ingressFigure 4-5 Ingress Gateway

- Verify if the same name is assigned to "-c = NWDAF api gateway" host field, if not update to match the current name. Use the option "-c ingress-gateway-service \" .
- -g : Use this option to update the service name of the MESA simulator according to the current service name of the MESA simulator being used.
Run the following command in the NWDAF console to verify the current service name of the Mesa simulator:
kubectl get svc -n <namespace_name> | grep mesaFor example:
kubectl get svc -n mdc-nwdaf-qa | grep mesaFigure 4-6 Mesa Simulator

- Verify if the same name is assigned to "-g = MESA simulator API" host field, if not update to match the current name. Use the option "-g mesa-simulator-service \" .
- -i : Use this option to update the service name of the NWDAF Configuration API Host Service according to the current service name of the NWDAF Configuration API Host Service being used.
Run the following command in the NWDAF console to verify the current service name of the NWDAF Configuration API Host Service:
kubectl get svc -n <namespace_name> | grep configurationFor example:
kubectl get svc -n mdc-nwdaf-qa | grep configurationFigure 4-7 Configuration API Host Service

- Verify if the same name is assigned to "-i = NWDAF CONFIGURATION API" host field, if not update to match the current name. Use the option "-i ocn-nwdaf-configuration-service \" .
- Update the following parameters according to the database setup:
- -q : Use this option to update the NWDAF database host name, it can be FQDN or IP address.
For example:
-q 10.75.245.174 \
- -r : Use this option to update the NWDAF database port, it can be Cluster IP or Node Port.
For example:
-r 32648 \
- -F : Use this option to update the InnoDB database host name, it can be FQDN or the IP address.
For example:
-F 10.75.245.189 \
- -G : Use this option to update the InnoDB database port, it can be Cluster IP or Node Port.
For example:
-G 3306 \
- -q : Use this option to update the NWDAF database host name, it can be FQDN or IP address.
- Update the -s db_user_id, -t db_user_psw, inno_db_user_id, and inno_db_user_pswvariables with the current data base user credentials, follow the steps listed below:
- Provide the userid and password of the database to be encrypted. Navigate to ocats-nwdaf-deploy pod and run the command:
kubectl exec -it <pod_name> -n <namespace_name> bashFor example:
kubectl exec -it ocats-nwdaf-deploy-54f98c447c-l6vxq -n ocnwdaf-ns bash - From the console, run the following command:
cd /env/lib/python3.9/site-packages/ocnnwdaf_lib/db_mgt - To update the user id run the following command from the console:
python -c "from db_connection_mgt import *; print(encode_values_data('<user>'))" - To update the password run the following command from the console:
python -c "from db_connection_mgt import *; print(encode_values_data('<password>'))" - Copy and paste the encrypted user id and password into the pipeline script located in the bottom of the page.
For example:
Figure 4-8 Sample Output

Figure 4-9 Pipeline Script
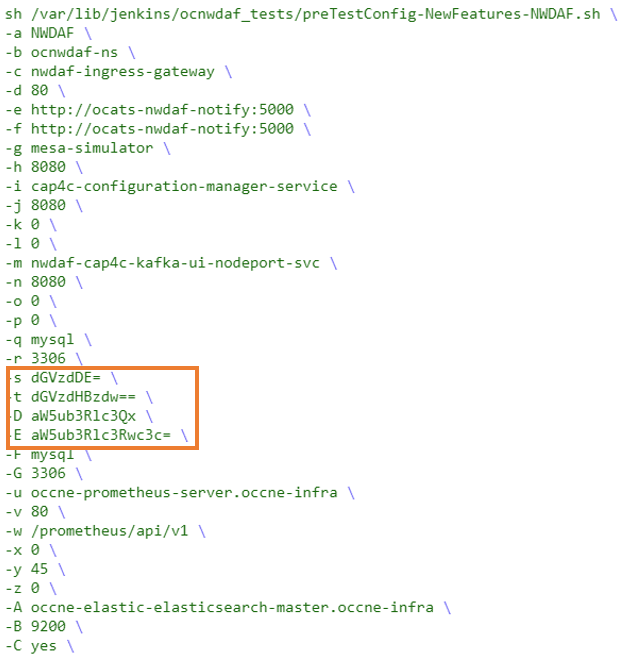
Save the values for later use.
- Select the Use Groovy Sandbox checkbox.
- Provide the userid and password of the database to be encrypted. Navigate to ocats-nwdaf-deploy pod and run the command:
- Click Save. Perform the above steps for NWDAF-Regression and NWDAF-Performance pipelines.
Run the NWDAF ATS test scrips
- To run the test cases, click Build with Parameters.
- The TestSuite multi-option page is displayed, ensure the SUT value is NWDAF.
Figure 4-10 TestSuite Page
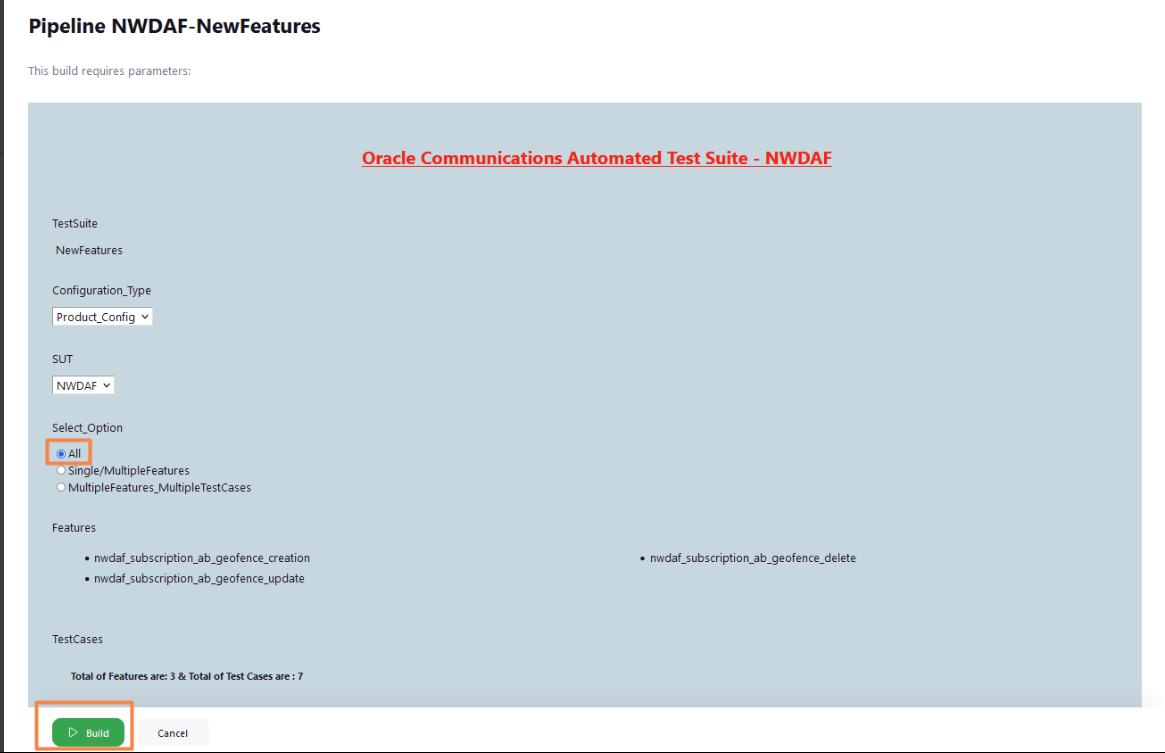
- To run all scripts available, select All and click Build.
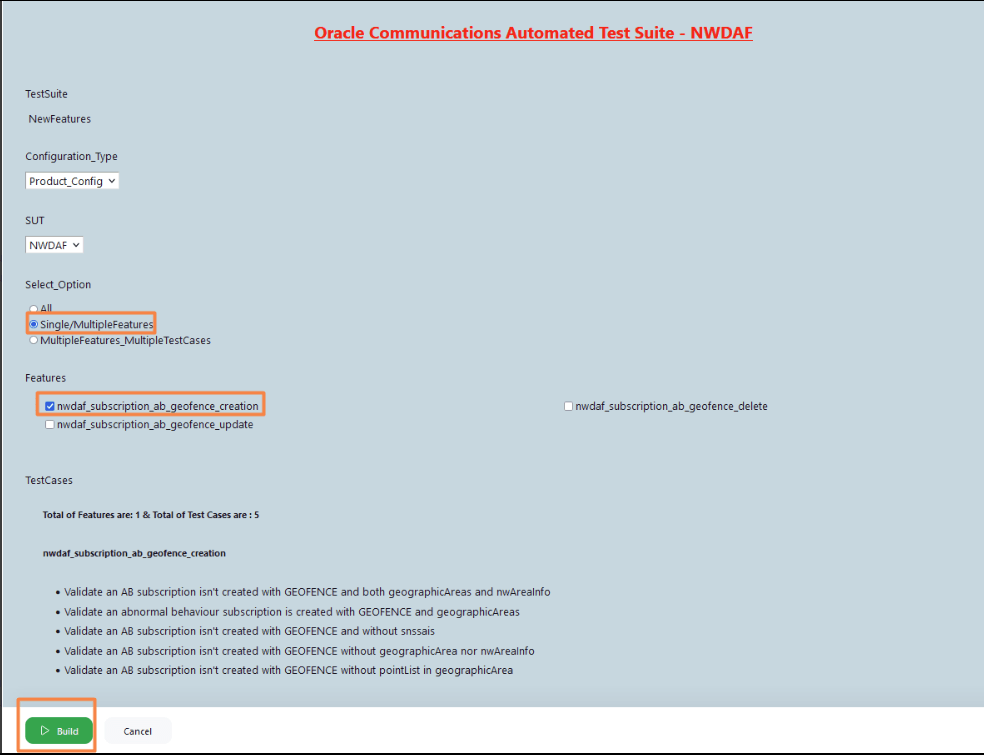
- To run scripts on a specific feature, select Single/MultipleFeatures option and select the Feature you want to run the test on and click Build.
Figure 4-11 Single/Multiple Features
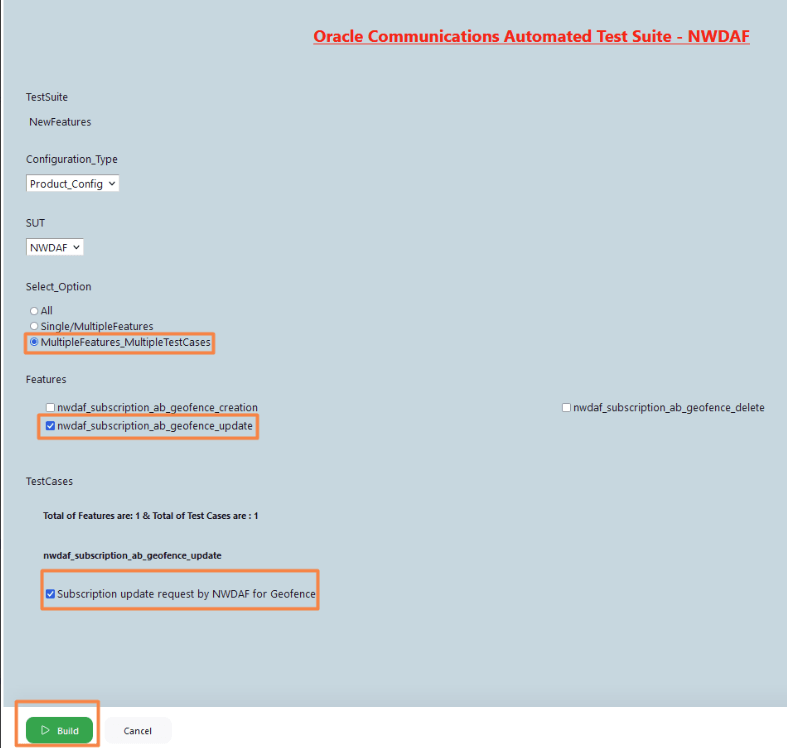
- To run scripts on a specific test scenario, select MultipleFeatures_MultipleTestCases option and select the Feature and the TestCases you want to run the test on and click Build.
Figure 4-12 Multiple Features and Testcases
- The Build History menu displays the list of running jobs, select the latest job displayed in the list.
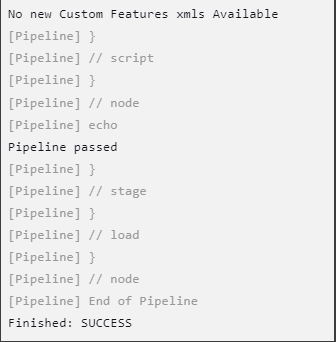
- Click the Console Output option for this job. The jobs progress can be visualized in the log. The job progress also displays results for test cases and pipelines completed.
For example:
Figure 4-13 Sample Output

Figure 4-14 Sample Output
4.2 Running OCNADD Test Cases using ATS
4.2.1 Prerequisites
- The ATS version must be compatible with the OCNADD release.
- The ATS and Stub must be deployed in the namespace based on the OCANDD deployment mode, see Note.
- For OCANDD deployments in which ACL is enabled, perform the following steps:
Note:
Skip these steps if ACL is not enabled in the OCNADD deployment.- Set the Jenkins pipeline variables INTRA_TLS_ENABLED and ACL_ENABLED to true.
- Update the ssl.truststore.password, ssl.keystore.password, and ssl.key.password in ocnadd_tests/data/admin.properties file inside the ATS pod as follows:
-
Access the Kafka pod from the OCNADD worker group or the default group deployment in which the SCRAM user configuration was added while enabling the ACL. Run the following command, in this example
kafka-broker-0is the Kafka pod:kubectl exec -it kafka-broker-0 -n <namespace> -- bash - Extract the ssl parameters from the Kafka broker environments, run the following command:
env | grep -i pass - Use the truststore and keystore passwords retrieved from the above command output to update the ocnadd_tests/data/admin.properties file of the ATS pod, run the following commands:
kubectl exec -it ocats-ocats-ocnadd-xxxx-xxxx -n <namespace> -- bash$ vi ocnadd_tests/data/admin.propertiesSample output:
              security.protocol=SASL_SSL
              sasl.mechanism=PLAIN
              sasl.jaas.config=org.apache.kafka.common.security.plain.PlainLoginModule required username="ocnadd" password="ocnadd";
              ssl.truststore.location=/var/securityfiles/keystore/trustStore.p12
              ssl.truststore.password=<truststore pass>
              ssl.keystore.location=/var/securityfiles/keystore/keyStore.p12
              ssl.keystore.password=<keystore pass>
              ssl.key.password=<keystore pass>
-
Note:
- Before triggering a new pipeline from Jenkins, delete all existing Data Feed and Filter configurations from the previous execution.
- If ATS and Stub are in OCNADD centralized deployment mode, exclude the scenario tag NotSupportedForCentralizedDD follow the step below:
- In the Jenkins UI, navigate from FilterWithTags(Yes) to Scenario_Exclude_Tags, enter NotSupportedForCentralizedDD and click Submit.
This step avoids failures from the various scenarios that are not supported by the OCNADD in the centralized deployment mode.
- In the Jenkins UI, navigate from FilterWithTags(Yes) to Scenario_Exclude_Tags, enter NotSupportedForCentralizedDD and click Submit.
4.2.2 Logging in to ATS
Running ATS
[ocnadd@k8s-bastion ~]$ helm status ocats -n ocnadd-deploy
NAME: ocats
LAST DEPLOYED: Sat Nov  3 03:48:27 2022
NAMESPACE: ocnadd-deploy
STATUS: deployed
REVISION: 1
TEST SUITE: None
NOTES:
# Copyright 2018 (C), Oracle and/or its affiliates. All rights reserved.

Thank you for installing ocats-ocnadd.

Your release is named ocats , Release Revision: 1.
To learn more about the release, try:

  $ helm status ocats
  $ helm get ocats
[ocnadd@k8s-bastion ~]$ kubectl get pod -n ocnadd-deploy | grep ocats
ocats-ocats-ocnadd-54ffddb548-4j8cx 1/1 Running 0 9h
[ocnadd@k8s-bastion ~]$ kubectl get svc -n ocnadd-deploy | grep ocats
ocats-ocats-ocnadd LoadBalancer 10.20.30.40 <pending> 8080:12345/TCP 9hFor more information on verifying ATS deployment, see Verifying ATS Deployment.
Note:
If LoadBalancer IP is provided, then give <LoadBalancer IP>:8080Figure 4-15 ATS Login
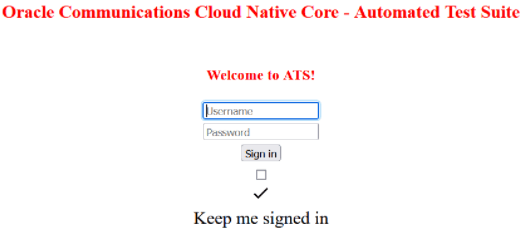
- Enter the login credentials. Click
Sign in. The following screen appears.
Figure 4-16 OCNADD Pre-Configured Pipelines
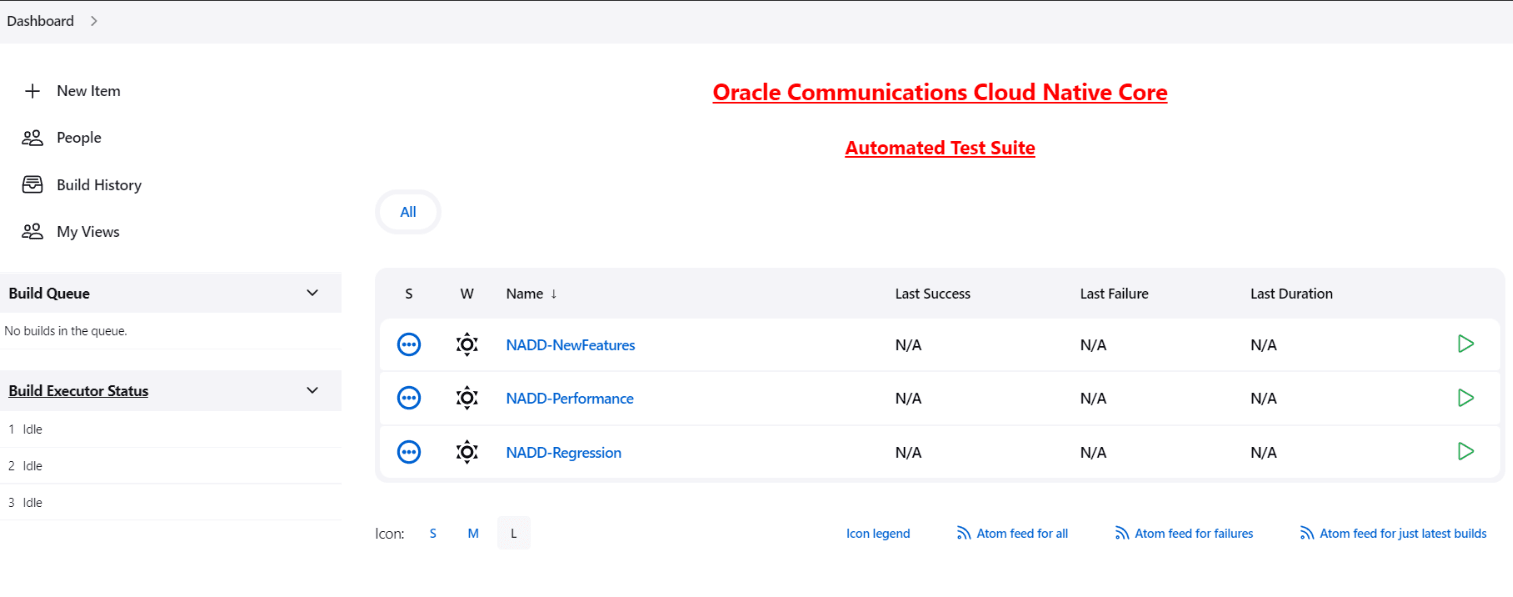
OCNADD ATS has three pre-configured pipelines.
- OCNADD-NewFeatures: This pipeline has all the test cases delivered as part of OCNADD ATS - 23.4.0.
- OCNADD-Performance: This pipeline is not operational as of now. It is reserved for future releases of ATS.
- OCNADD-Regression: This pipeline is not operational as of now. It is reserved for future releases of ATS.
4.2.3 OCNADD-NewFeatures Pipeline
OCNADD-NewFeatures Pipeline
- Click OCNADD-NewFeatures in the Name column. The following screen appears:
Figure 4-17 Configuring OCNADD-New Features
 In the above screen:
- Click Configure to configure OCNADD-New Features.
- Click Build History box to view all the previous pipeline executions, and the Console Output of each execution.
- The Stage View represents the previously run pipelines for reference.
- The Test Results Analyzer is the plugin integrated into the OCNADD-ATS. This option can be used to display the build-wise history of all the tests. It provides a consolidated graphical representation of all past tests.
- Click Configure. Once the page loads completely, click the Pipeline tab:
Note:
Make sure that the Configure page loads completely before you perform any action on it. Also, do not modify any configuration other than shown below.The Pipeline section of the configuration page appears as follows:Figure 4-18 Pipeline Section
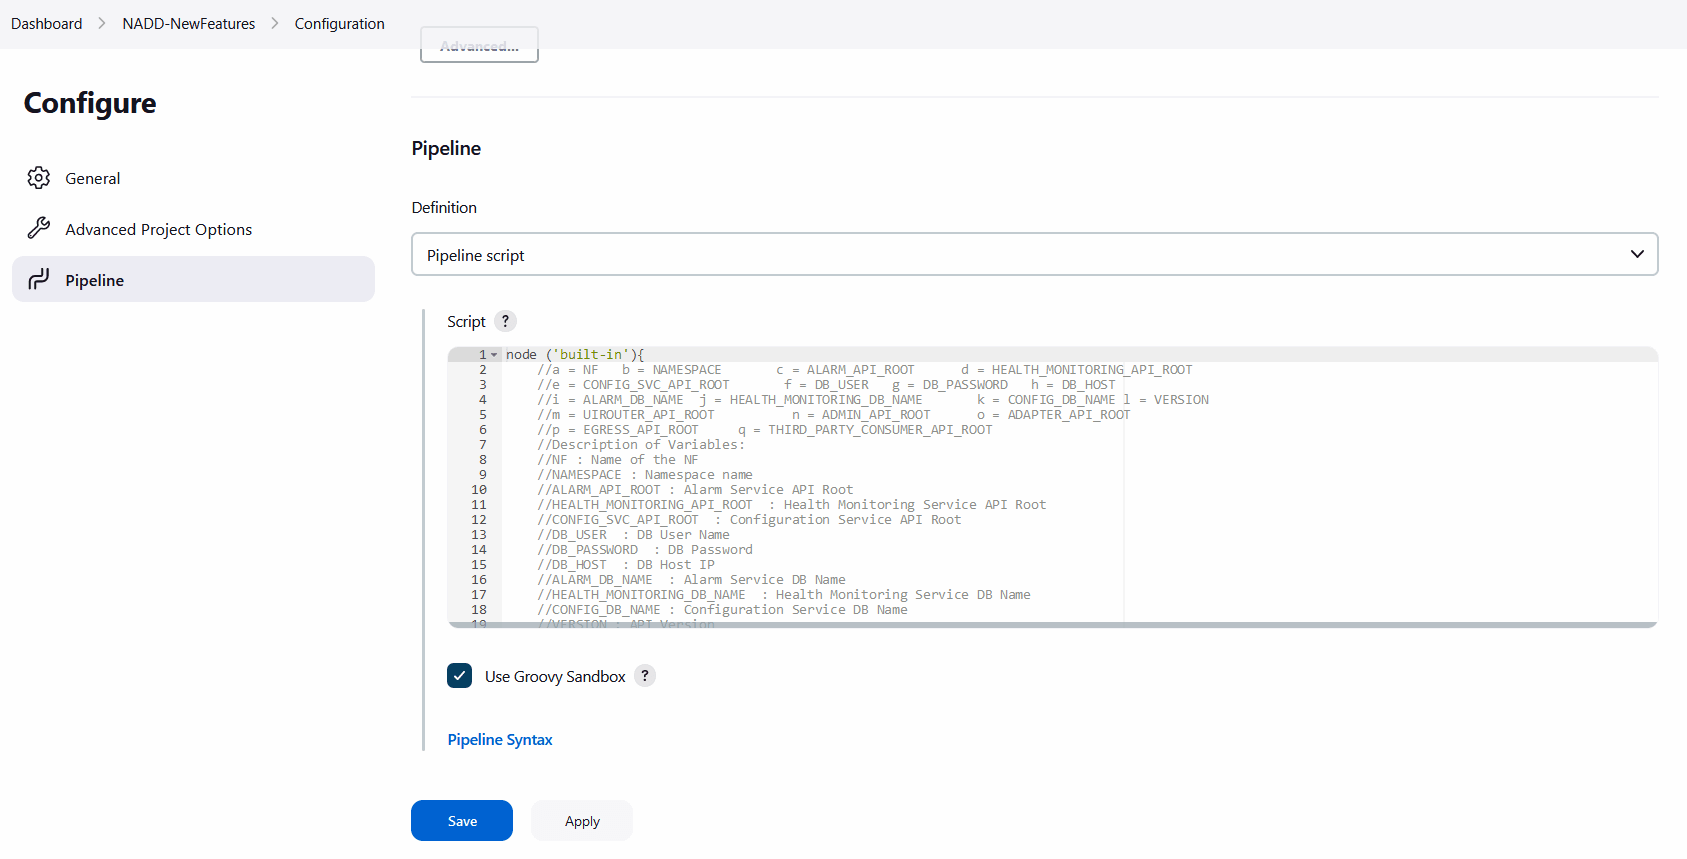
Important:
Remove the existing default content of the pipeline script and copy the following script content.The content of the pipeline script is as follows:
node ('built-in'){
    //a = NF    b = NAMESPACE    c = DB_HOST    d = DB_USER    e = DB_PASSWORD
    //f = ALARM_DB_NAME    g = HEALTH_MONITORING_DB_NAME    h = CONFIG_DB_NAME
    //i = ALARM_API_ROOT    j = HEALTH_MONITORING_API_ROOT    k = CONFIG_SVC_API_ROOT
    //l = UIROUTER_API_ROOT    m = ADMIN_API_ROOT    n = THIRD_PARTY_CONSUMER_API_ROOT
    //o = BACKUP_RESTORE_IMG_PATH    p = ALERT_MANAGER_URI      q = PROMETHEUS_URI      r = INTRA_TLS_ENABLED
    //s = RERUN_COUNT     t = ACL_ENABLED     u = WORKER_GROUP    v = MANAGEMENT_GROUP  w = MTLS_ENABLED    x = CERTIFICATE_FILE    y = CERTIFICATE_KEY
    //Description of Variables:
    //NF : Name of the NF
    //NAMESPACE : Namespace name
    //DB_HOST : DB Host IP
    //DB_USER : DB User Name
    //DB_PASSWORD : DB Password
    //ALARM_DB_NAME : Alarm Service DB Name
    //HEALTH_MONITORING_DB_NAME : Health Monitoring Service DB Name
    //CONFIG_DB_NAME : Configuration Service DB Name
    //ALARM_API_ROOT : Alarm Service API Root
    //HEALTH_MONITORING_API_ROOT : Health Monitoring Service API Root
    //CONFIG_SVC_API_ROOT : Configuration Service API Root
    //UIROUTER_API_ROOT : UI Router API Root
    //ADMIN_API_ROOT : Admin Service API Root
    //THIRD_PARTY_CONSUMER_API_ROOT : Third Pary Consumer API Root
    //BACKUP_RESTORE_IMG_PATH : Repository path for Backup restore image
    //ALERT_MANAGER_URI : Alert Manager API Root
    //PROMETHEUS_URI : Prometheus URI
    //INTRA_TLS_ENABLED : IntraTLS Value true/false
    //RERUN_COUNT : ReRun Count for Failed Tests
    //ACL_ENABLED : ACL Enabled true/false
    //WORKER_GROUP : Worker Group Namespace name
    //MANAGEMENT_GROUP : Management Group Namespace name
    //MTLS_ENABLED : mTls Enabled value
    //CERTIFICATE_FILE : OCATS certificate file name
    //CERTIFICATE_KEY : OCATS certificate key file name

    sh '''
        sh /var/lib/jenkins/ocnadd_tests/preTestConfig-NewFeatures-NADD.sh \
        -a NADD \
        -b <ocnadd-namespace> \
        -c <DB_HOST> \
        -d <DB_USER> \
        -e <DB_PASSWORD> \
        -f alarm_schema \
        -g healthdb_schema \
        -h configuration_schema \
        -i ocnaddalarm.<management-group-namespace>.svc.<domainName>:9099 \
        -j ocnaddhealthmonitoring.<management-group-namespace>.svc.<domainName>:12591 \
        -k ocnaddconfiguration.<management-group-namespace>.svc.<domainName>:12590 \
        -l ocnaddbackendrouter.<management-group-namespace>.svc.<domainName>:8988 \
        -m ocnaddadminservice.<management-group-namespace>.svc.<domainName>:9181 \
        -n ocnaddthirdpartyconsumer.<worker-group-namespace>.svc.<domainName>:9094 \
        -o <repo-path>/ocdd.repo/ocnaddbackuprestore:<tag> \
        -p occne-kube-prom-stack-kube-alertmanager.occne-infra.svc.<domainName>:80/<clusterName> \
        -q occne-kube-prom-stack-kube-prometheus.occne-infra.svc.<domainName>:80/<clusterName>/prometheus/api/v1/query \
        -r true \
        -s 0 \
        -t false \
        -u <worker-group-namespace:clusterName> \
        -v <management-group-namespace> \
        -w false \
        -x <OCATS_certificate_file_name> \
        -y <OCATS_certificate_key_file_name> \
    '''
    if(env.Include_Regression && "${Include_Regression}" == "YES"){
        sh '''sh /var/lib/jenkins/common_scripts/merge_jenkinsfile.sh'''
        load "/var/lib/jenkins/ocnadd_tests/jenkinsData/Jenkinsfile-NADD-Merged"
    }
    else{
        load "/var/lib/jenkins/ocnadd_tests/jenkinsData/Jenkinsfile-NADD-NewFeatures"
    }

}
You can modify pipeline script parameters from "-b" to "-q" on the basis of your deployment environment, click on 'Save' after making the necessary changes.
The description of all the script parameters is as follows:
- a: Name of the NF to be tested in the capital (NADD).
- b: Namespace in which the NADD is deployed (ocnadd-deploy).
- c: DB Host IP provided NADD deployment (10.XX.XX.XX).
- d: DB username provided during NADD deployment.
- e: DB password provided during NADD deployment.
- f: DB Schema Name of ocnaddalarm microservice provided during NADD deployment (alarm_schema).
- g: DB Schema Name of ocnaddhealthmonitoring microservice provided during NADD deployment (healthdb_schema).
- h: DB Schema Name of ocnaddconfiguration microservice provided during NADD deployment (configuration_schema).
- i: API root endpoint to reach NADD's ocnaddalarm microservice. (<Worker-Node-IP>:<Node-Port-of-ocnaddalarm>) or default value
- j: API root endpoint to reach NADD's ocnaddhealthmonitoring microservice. (<Worker-Node-IP>:<Node-Port-of-ocnaddhealthmonitoring>) or default value
- k: API root endpoint to reach NADD's ocnaddconfiguration microservice. (<Worker-Node-IP>:<Node-Port-of-ocnaddconfiguration>) or default value
- l: API root endpoint to reach NADD's ocnaddbackendrouter microservice. (Not used in the current release, use the default value)
- m: API root endpoint to reach NADD's ocnaddadminservice microservice. (Not used in the current release, use the default value)
- n: API root endpoint to reach NADD's ocnaddthirdpartyconsumer microservice. (<Worker-Node-IP>:<Node-Port-of-ocnaddthirdpartyconsumer>) or default value
- o: Repository path for ocnaddbackuprestore image.
- p: API root endpoint to reach alert manager microservice.
- q: Prometheus URI
- r: Set the IntraTLS value to either "true" or "false" based on user requirement and OCNADD deployment (either with intraTlS enabled or disabled).
- s: Rerun count for failed test cases. The default value is set to '2'. It can be set to '0', '1', or any other value based on user requirements.
- t: Set the ACL_ENABLED value to either "true" or "false" based on the OCNADD deployment (ACL enabled or disabled).
- u: Worker group namespace name along with cluster name.
- v: Management group namespace name.
- w: Sets the MTLS_ENABLED value to either "true" or "false" based on the OCNADD deployment.
- x: OCATS Certificate File name.
- y: OCATS Certificate Key file name.
Note:
If ATS and Stub are on a OCNADD in non-centralized deployment mode, then u: <worker-group-namespace:clusterName> and v: <management-group-namespace> will be in the same namespace.Running OCNADD Test Cases
- Click the Build with Parameters link available in the left navigation pane of the NADD-NewFeatures Pipeline screen. The following page appears:
Figure 4-19 Pipeline NADD_NewFeatures
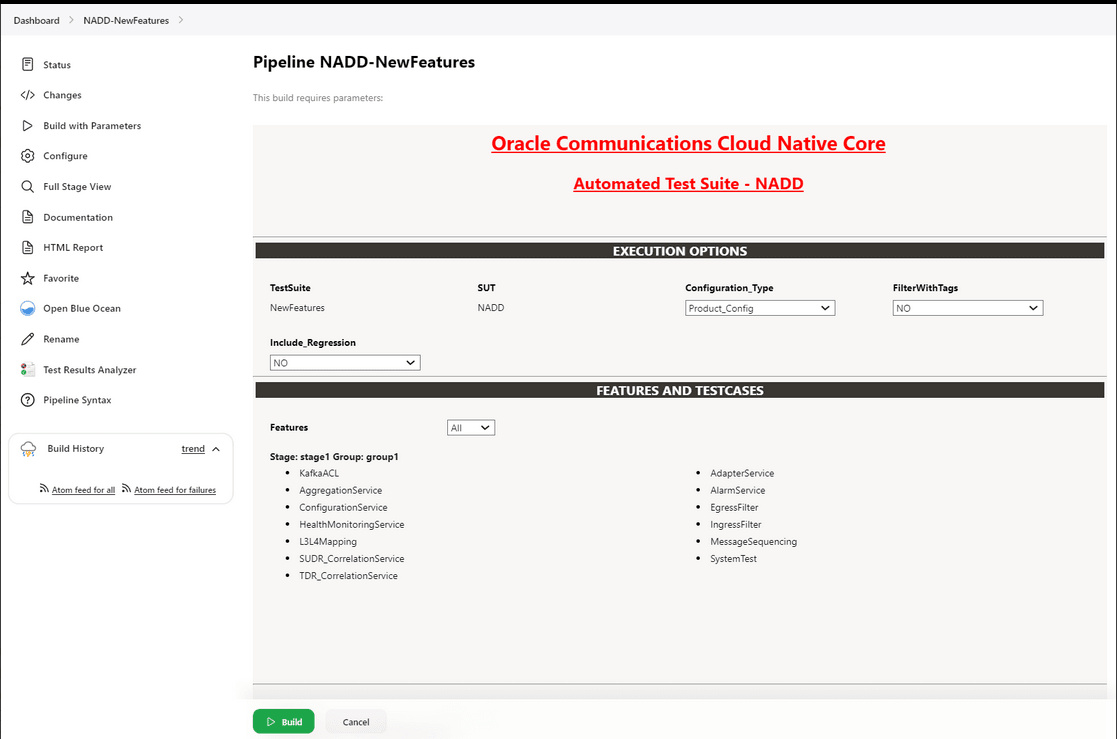
- Select Configuration_Type as Product_Config.
- Set Include_Regression to 'NO' from the drop-down list.
- In Select_Option:
- Select All to run all the feature test cases and click the Build button to run the pipeline.
- Choose Single/MultipleFeatures to run the specific feature test cases and click the Build button to run the pipeline.
- Choose MultipleFeature/MultipleTestCases to select multiple features and multiple test cases within the selected features and click the Build button to run the pipeline.
4.2.4 OCNADD-NewFeatures Documentation
The NADD-NewFeatures pipeline has a HTML report of all the feature files that can be tested as part of the OCNADD ATS release. Follow the procedure listed below to view all the OCNADD functionalities:
- On the Pipeline NADD-NewFeatures page click Documentation in the left navigation pane. All test cases provided as part of the OCNADD ATS release are displayed on the screen.
Note:
- The Documentation option appears on the screen only if NADD-NewFeatures pipeline test cases are executed at least once.
- Use the Firefox browser to open the Documentation, other browsers are not supported.
Figure 4-20 Documentation
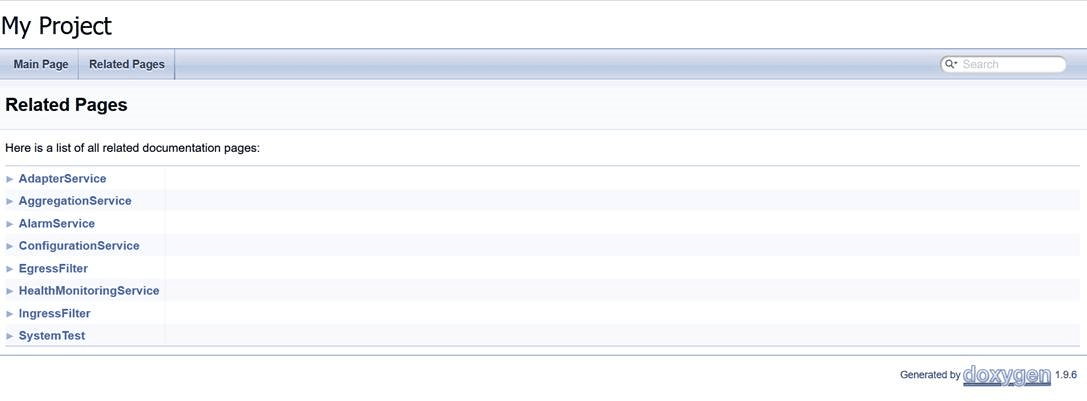
- Click any functionality to view its test cases and scenarios for each test case.
- To exit, click Back to NADD-NewFeatures on the top-left corner of the screen.
4.2.5 Troubleshooting ATS
This section provides troubleshooting procedures for some common ATS test case failures.
Offset Count Mismatch Results in Test Case Failure
Problem
Test cases fail due to the offset count mismatch. Delay in third-party consumers receiving messages results in this failure.
Example: The test case failed due to offset count of the MAIN topic(which is 186) does not match with off set count of the third-party Consumer(which is 155)
Then Compare the offset change in MAIN topic and consumer ... failed in 0.000s
Assertion Failed: The increase in offset counts is not matching, increase in offset of MAIN : 186 , increase in offset of Consumer : 155
Captured stdout:
{'Location': 'http://ocnaddconfiguration:12590/ocnadd-configuration/configure/v3/app-oracle-cipher', 'content-length': '0'}
['OCL', '2023-08-13T19:49:49.944Z', 'INFO', '1', '---', '[', 'scheduling-1]', 'c', '.o', '.c', '.c', '.o', '.c', '.c', '.ConsumerController', ':', '|', '*TOTAL*', '|', '0', '(0', ')', '|']
['OCL', '2023-08-13T19:49:49.944Z', 'INFO', '1', '---', '[', 'scheduling-1]', 'c', '.o', '.c', '.c', '.o', '.c', '.c', '.ConsumerController', ':', '+------------------------------+-------------------------------+-------------------------------+--------------------------------------+']
['OCL', '2023-08-13T19:50:14.952Z', 'INFO', '1', '---', '[', 'scheduling-1]', 'c', '.o', '.c', '.c', '.o', '.c', '.c', '.ConsumerController', ':', '|', '*TOTAL*', '|', '155', '(0', ')', '|']
['OCL', '2023-08-13T19:50:14.952Z', 'INFO', '1', '---', '[', 'scheduling-1]', 'c', '.o', '.c', '.c', '.o', '.c', '.c', '.ConsumerController', ':', '+------------------------------+-------------------------------+-------------------------------+--------------------------------------+']
Solution
The test cases which failed due to offset count mismatch, pass when a test case rerun is performed.
Assertion Failed: Status code:404 did not match with 204
Problem
The test cases fail due to 'Assertion Failed: Status code:404 did not match with 204'. This error occurs when any previous scenario abruptly fails without executing all the steps of the scenario.
Sample Error Message
Example:
Given delete already existing data feeds ... failed in 0.346s
Assertion Failed: FAILED SUB-STEP: Given delete already existing configurations
Substep info: Assertion Failed: Status code:404 did not match with 204
Traceback (of failed substep):
  File "/env/lib64/python3.9/site-packages/behave/model.py", line 1329, in run
    match.run(runner.context)
  File "/env/lib64/python3.9/site-packages/behave/matchers.py", line 98, in run
    self.func(context, *args, **kwargs)
  File "/var/lib/jenkins/cncats/ocnftest/ocnadd_steps.py", line 1906, in step_impl
    assert False , 'Status code:{} did not match with 204'.format(context.response.status_code)
Solution
The test cases which failed due to previous scenario failures, pass when a test case rerun is performed.
OCNADD Pods Enter a 'Image Pull' Error State
Problem
The OCNADD pods enter a 'Image Pull' error state after a few test cases are executed. This occurs when a test case appends a suffix to the image name and its execution is incomplete.
Solution
Correct the image name by editing the pods deployment and rerun the test suite.