Calls
The Calls page is the central repository for call analysis in Operations Monitor. You can analyze call information by traversing the platform in real-time or historically. This data can be inspected as a high-level overview of all active calls, or a single call and its messages in detail. Operations Monitor can display SIP or ISUP calls together with MEGACO, MGCP, ENUM, and Diameter Cx.
This page contains two panels: the Calls Chart displaying the number of calls currently in progress, and Recent Calls showing details about recent calls. For more information, see "Active Calls Chart" and "Recent Calls".
Call Legs
A call leg is the portion of the call between two platform devices. Operations Monitor gathers messages from multiple points on the network, correlates them into call legs and merges them into calls. For example, the call from Figure 4-20 contains four call legs:
-
From the Trunk to the Load Balancer device.
-
From the Load Balancer to the SIP Proxy.
-
From the SIP Proxy back to the Load Balancer.
-
From the Load Balancer to the callee.
Figure 4-20 Example Call Flow

Merging call legs into call flows is important for network troubleshooting and gathering accurate statistics. For call merging to work properly, you need to configure the platform devices in the Platform Devices section. For more information about configuring platform devices, see Initial Configuration.

Call States
Table 4-1 lists the call states:
Table 4-1 Call States
| Call States | Description |
|---|---|
|
Unauthorized |
The call was answered with '401' or '407'. The UAC typically sends another INVITE containing the credentials. If these are accepted by the UAS, the state will change to Proceeding or Established. |
|
Proceeding |
The call enters this state immediately after the first INVITE is received, and stays in it until an answer changes the state. The State details column may provide extra information (INVITE seen, ACK seen but no final response yet). |
|
Ringing |
The call enters this state when the first '180 Ringing' answer is seen. |
|
Established |
The call enters this state when the first successful 2xx answer is seen. The State details column mentions if the ACK is not yet received (200 OK seen, waiting for ACK). |
|
Finished |
An Established call enters this state when the first BYE message is seen. The State details column mentions if the related 200 OK message is not yet received (BYE seen, waiting for confirmation). |
|
Timed out |
An Established call enters this state if it lasts longer than the configured session timeout limit. This limit can be changed from the Session-timeout For Calls system option. For more information, see "Session-Timeout For Calls". |
|
Error |
A call enters this state if Operations Monitor is unable to follow the call, due to an unexpected sequence of message. |
|
Failed |
A Proceeding call enters this state if a non-successful final response is seen or the 'INVITE' transaction times out. In the latter case, the State details column shows the 'Timeout during call setup' message. |
|
Not Found |
A Proceeding call enters this state if the 404 response code is seen. |
|
Moved |
A Proceeding call enters this state if the 301 or the 302 response code is seen. |
|
Off-line |
A Proceeding call enters this state if the 480 response code is seen. |
|
Busy |
A Proceeding call enters this state if the 486 or the 600 response code is seen. |
|
Canceled |
A Proceeding call enters this state if the 487response code is seen. |
If a call has multiple call legs, the call state is computed from the call legs' individual states.
Active Calls Chart
The Active calls chart represents the number of established calls at the time of the measure. The minimum, maximum, and average for the sample period are displayed. Zooming and panning are available in this chart. For more information, see " Charts ".
The CSV export of info displayed in the chart exports the active calls data for the displayed period in CSV format for post-processing purposes. The Show interval in grid arranges data on a grid according to the time interval of the Active calls chart.
By default, the Auto Refresh is set to 30 seconds for this graph. For more information, see " Refresh Button ".
Note:
It is observed that Oracle Communications Session Monitor shows a sudden drop in the graphs at least once in a week. It occurs at around 3:45 am and it is a part of the standard cleanup process. This cleanup can not be deactivated.
Example
Figure 4-22 depicts a typical view for one day of the Active Calls graph. The number of established calls decreases at night and increases during peak hours.
Figure 4-22 Evolution of Active Calls Over 20 Minutes

Description of "Figure 4-22 Evolution of Active Calls Over 20 Minutes"
Figure 4-23 shows a view for 3 days.
Figure 4-23 Evolution of 'Active calls' Over 3 days

Description of "Figure 4-23 Evolution of 'Active calls' Over 3 days"
Recent Calls
The Recent Calls table displays recent and historical information for calls made in the last few days. The calls from this table are updated in real-time as their state changes.
Figure 4-24 Recent Calls Table

Recent Calls Table
Table 4-2 Recent Calls Table Columns
| Column | Description |
|---|---|
|
Avg. MOS |
The voice quality estimation for Finished calls. If Operations Monitor does not receive RTP traffic, or the RTP module is not loaded, this field is empty. The value is displayed in green, orange, or red depending on the thresholds set in the system options High Threshold for MOS and Low Threshold for MOS. For more information about how Operations Monitor estimates the MOS value of a call, see " Voice Quality ". |
|
Avg RTCP delay |
The average round-trip delay time reported by RTCP. |
|
Call time |
If the call is Finished, this field represents the call length, measured from the 200 OK message of the INVITE transaction until the first BYE message. If the call is Established, this field represents the time elapsed since the call establishment (the arrival of the 200 OK message of the INVITE transaction) and it is updated on each refresh. If the call is not yet Established, this field is empty. This field has a precision of milliseconds but cannot be filtered for unless the call is Finished. |
|
Call-Transfer |
True if this call has been transferred using the call transfer capabilities in SIP. |
|
Callee |
The user to which the call is addressed. This is usually taken from the To header field of the first call leg. |
|
Callee codecs |
The comma delineated list of codecs proposed in the SDP body by the UAS. Usually this appears in the responses from INVITE transactions and the UAS includes a single codec in the answer, and this is the codec used in the call. On each re-INVITE from inside the dialog, this field is updated to the last proposed list of codecs. By default, this column is hidden. |
|
Callee Initial codecs |
The comma delineated list of codecs proposed in the SDP body by the UAS, usually in the first response from the 'INVITE' transaction. Unlike the Callee codecs, this field is not updated on re-INVITEs. By default, this column is hidden. |
|
Callee IP Address |
The IP address of the called user that connected first. It is possible to filter this column by IP address or IP address mask. By default this column is hidden. |
|
Callee User Agent |
The User-Agent string advertised in the 200 OK message of the last call leg. This string usually contains the brand and the firmware version of the SIP device answering the call. If the User-Agent header is not present, the string is taken from the 'Server' header if present. By default, this column is hidden. |
|
Caller |
The user making the call. This is usually taken from the From header field of the first call leg. |
|
Caller codecs |
The comma delineated list of codecs proposed in the SDP body by the UAC, usually in the 'INVITE' message. On each re-INVITE from inside the dialog, this field is updated to the last proposed list of codecs. For example, this is useful for detecting T.38 calls. By default, this column is hidden. |
|
Caller Initial codecs |
The comma delineated list of codecs proposed in the SDP body by the UAS, usually in the first 'INVITE' message. Unlike the Caller codecs, this field is not updated on re- INVITEs. This is useful for gathering statistics about the supported codecs. By default, this column is hidden. |
|
Caller IP Address |
The IP address of the device initiating the call. It is possible to filter this column by IP address or IP address mask. By default this column is hidden. |
|
Caller User Agent |
The User-Agent string advertised in the 'INVITE' message from the first call leg. This string usually contains the brand and firmware version of the SIP device making the call. By default, this column is hidden. |
|
Code |
The SIP response code of the last received message from the 'INVITE' transaction. For Failed calls, this represents the SIP error code. |
|
Diversion |
Diversion URI of first Diversion header in call. |
|
Diversion Type |
Diversion type of first Diversion header in call. Possible values are:
|
|
DPC |
Destination Point Codes (DPC) contains the address of the destination for the ISUP call. This is always taken from the first ISUP leg seen by Operations Monitor. |
|
DTMF |
Displays 'Yes' if the there is DTMF information available for this call. Unless the user has the correct rights this field will not be available. |
|
Egress device(s) |
This field contains a comma delineated list of the egress devices for the call, that is through which the call leaves the platform. |
|
End timestamp |
The timestamp of the message that closes the main leg of the call (usually the first BYE message). |
|
Gateway Devices |
As the MEGACO Gateway column contains the IP address of the MEGACO Gate- way, the Gateway Devices column contains its name. |
|
Ingress device(s) |
This field contains a comma delineated list of the ingress devices for the call, that is through which the call enters the platform. |
|
Initiator device |
If the call was started from a SIP device of the platform (for example, a media server), this field contains the name of this device. The call must not be relayed by this device, but actually created by it. Otherwise, the field is empty. By default, this column is hidden. |
|
Max RTCP delay |
The maximum round-trip delay time reported by RTCP. |
|
Media |
Indicates if RTP recordings were requested for this call. |
|
Media types |
Indicates the media types that were negotiated in the call. Multiple media types are separated by a comma (for example: audio, video). |
|
MEGACO Commands |
Commands placed by the MEGACO Gateway Controller to the MEGACO Gateway in a transaction. For example, Commands exist to add/modify/subtract Terminations from the Context. See Figure 4-25. |
|
MEGACO Context ID |
Defines an identifier for each MEGACO connection. See Figure 4-25. |
|
MEGACO Gateway |
IP address of the MEGACO Gateway. |
|
MEGACO Gateway Controller |
IP address of the MEGACO Gateway Controller. |
|
MEGACO Termination ID |
A MEGACO TerminationID is defined for a PSTN line, a channel in a Trunk or rtp stream. Their format is a string like: line/1 or rtp/1 for RTP streams. See Figure 4-25. |
|
MEGACO Transaction IDs |
A MEGACO Transaction is identified by a Transaction ID. See Figure 4-25. |
|
MGCP Call IDs |
Hexadecimal strings of maximum of 32 characters that identify uniquely a call. See Figure 4-26. |
|
MGCP Capabilities |
Defines the capabilities of the endpoints. See Figure 4-26. |
|
MGCP Connection IDs |
The connection identifier is encoded as a hexadecimal string, at most 32 characters in length. See Figure 4-26. |
|
MGCP Gateway IP |
IP address of the MGCP Gateway. |
|
Min. MOS |
The minimum value of the voice quality estimation for Finished calls. If Operations Monitor does not receive RTP traffic, or the RTP module is not loaded, this field is empty. The value is displayed in green, orange, or red depending on the thresholds set in the system options High Threshold for MOS and Low Threshold for MOS. For more information on how Operations Monitor estimates the MOS value of a call, see " Voice Quality ". |
|
OPC |
Originating Point Codes (OPC) contains the address of the originator for the ISUP call. This is always taken from the first ISUP leg seen by Operations Monitor. |
|
P-Asserted-ID |
The content of the P-Asserted-ID header from the initial INVITE SIP request. |
|
Preferred Callee Number? |
The number of the callee determined by the configurable number determination mechanism, if available. |
|
Preferred Caller Number? |
The number of the caller determined by the configurable number determination mechanism, if available. |
|
Prefix Group |
Prefix Tags matching this call (0 to n tags). |
|
Q.850 Code |
Q.850 cause code for the ISUP call. |
|
Q.850 Details |
Q.850 Details for the ISUP call. |
|
Q.850 State |
Q.850 State for the ISUP call. |
|
Reason |
The content of the Reason header from the BYE, CANCEL, SIP request or from a failure SIP reply. |
|
Remote-Party-ID |
The content of the Remote-Party-ID or P-Preferred-Identity header from the initial INVITE SIP request. |
|
RTCP streams |
The number of RTCP streams belonging to the call. |
|
Segments |
The number of call legs in this call. By default, this column is hidden. |
|
Setup Delay |
This field represents the time elapsed between the initial' INVITE' message and the first valid network response, like '180 Ringing', '183 Session in progress', '480 Temporarily Unavailable', etc. It fulfills Session Request Delay for RFC6076. If the call contains ISUP, Setup Delay is computed on the first SIP leg. This field has a precision of milliseconds. By default, this column is hidden. |
|
Setup Delay Type |
Shows the type of Setup Delay computed. Can be 'Successful Session Request Delay' or 'Failed Session Request Delay'. By default, this column is hidden. |
|
Setup time |
If the call is Established or Finished, this field represents the time elapsed between the initial INVITE message and the call establishment, marked by the 200 OK answer in the INVITE transaction. If the call is not yet Established, this field is empty. This field has a precision of milliseconds. By default, this column is hidden. |
|
Start timestamp |
The timestamp of the first INVITE or IAM message from the call. |
|
State |
A short text representation of the call state. For more information on the possible values for this field, see " Call States ". |
|
State details |
Extra details about the call state. For example, the state of a call can be Proceeding, and this field adds the information: ACK seen, but no final answer. For more information on the possible values for this field, see " Call States ". |
|
Terminator device |
If the call was ended by a SIP device (for example a media server), this field contains the name of the device. The call must not be relayed by this device, but actually terminated by it. Otherwise, the field is empty. By default, this column is hidden. |
Figure 4-25 shows examples of MEGACO call details in the Recent Calls panel.
Figure 4-25 MEGACO Details in the Calls Panel

Description of "Figure 4-25 MEGACO Details in the Calls Panel"
Figure 4-26 shows examples of MGCP call details in the Recent Calls panel.
Figure 4-26 MGCP Details in the Calls Panel

Description of "Figure 4-26 MGCP Details in the Calls Panel"
Note:
To save horizontal space, several columns are hidden by default. To enable the hidden columns, click the drop-down menu of any column header and select the columns menu sub-menu. For more information, see " Tables ".
Filtering
You can filter the columns of the Recent calls table for specific criteria. When you apply a single filter, the Filters toolbar displays the label SIMPLE.
Use a simple filter to filter the Recent calls table for one specific criteria.
Filter Properties
- Search on Enter Key
- Filter the record after the user presses the Enter key rather than as the user types. This option is checked by default but disabled for Advanced Filter.
Note:
The Search on Enter Key checkbox is also available for both the User Calls window in the User Tracking section and the Calls window in the IP Tracking section.Applying a Simple Filter
To apply a simple filter:
-
From the navigation list, select Calls.
-
On the Recent calls table, select the list of options on a desired column.
-
Select the Filters option.
-
Enter or select the filter criteria for the filter.
The table is filtered for the criteria and the toolbar displays the label SIMPLE.
Figure 4-27 shows an example of a filter applied to the Call time column of the Recent calls table. In the example, a filter value has been entered as criteria.

Changing a Simple Filter to an Advanced Filter
To change a simple filter to an advanced filter:
-
On the Filters toolbar, click Edit Advanced.
The (Unnamed Filter) dialog box appears.
-
Click +.
A list of filter fields appears.
-
Select the fields to include in the advanced filter.
-
Click Save.
The Save filters dialog box appears.
-
Enter a name for the filter.
-
Click Save.
The dialog box now displays the name you assigned the advanced filter.
-
Click Hide which closes the dialog box.
Text-Based Filter Fields
Some text-based filter fields can accept queries. In text-based filter fields, you can enter REGEX pattern matching or SQL pattern matching to filter recent calls. REGEX filtering provides slower search times than SQL filtering.
To enter REGEX pattern matching to filter calls, enter the .* character combination before the search values.
When regular expressions are filtered, expressions supported are the same as MySQL 5.5.
The following example uses the REGEX filter:
.*[0049]
To enter SQL pattern matching to filter calls, there are two methods. SQL filtering is faster and more efficient than the REGEX pattern matching. SQL pattern matching is triggered as follows:
-
Entering the SQL wildcard character % into the search field. It can be placed in front of or following the filter value.
-
Entering ^ at the beginning of a string.
Table 4-3 describes the SQL search filters and provides examples of usage.
Table 4-3 SQL Filter Conditions
| Search Filter | Search Example | Description |
|---|---|---|
|
(none) |
|
Filters for strings that contain 0049. |
|
^ |
^ |
Filters for strings that begin with 0049. |
|
% |
or % |
Filters for strings that begin with 0049. Filters for strings that end with 0049. |
Figure 4-28 shows an example of filtering that selects all finished calls. After the filter is set and the view is refreshed, the total number of finished calls is displayed in the bottom-right corner.

The filtered columns can also be combined to provide more precise answers. For example, to limit the table to all finished calls initiated by SuperTrunk, set the following filters:
-
State to Finished.
-
Ingress device to SuperTrunk.
-
Start timestamp to after 11:00.
-
End timestamp to before 12:00.
See also Figure 4-29.
In this table, filtering can be set from the right-click menu. For more information, see "Right-Click Menu".
Figure 4-29 Filter Finished Calls Initiated by SuperTrunk Between 11:00 and 12:00

Description of "Figure 4-29 Filter Finished Calls Initiated by SuperTrunk Between 11:00 and 12:00"
Filtering for this field is done in seconds.For example, in Figure 4-30, all calls that lasted less than 5.5 seconds are selected.
Note:
When filtering for call length, only the finished calls are considered. Thus, it is not possible to filter for all the established calls with a certain call length.
To filter the calls list for calls that contain RTP streams, use Media types filter. You can set the Media types filter to list the calls that contain audio, video, text, image, application, message, or other media type.
When Media types filter is used, any call that contains any of the media types is listed. For instance, when the filter is set to audio, any call where audio is one of the media types that was negotiated in the call is listed, for example, a call containing audio and video.
When multiple media types are set in the filter, for example image and video, any call where image or video is one of the media types that was negotiated in the call is listed, for example, a call containing image and audio.
Advanced Filtering
You can create advanced filters to filter the Recent calls table for specific combinations of results. Advanced filters enable you to select a specific combination of columns from the Recent calls table, then enter criteria against which to filter for matching calls.
See Table 4-2 for details on the metrics available in the Recent calls table columns.
Some filter types require that you customize the logic that is applied in the filter. You can customize the logic by toggling options or entering specific criteria to be matched in each advanced filter you create. The logic that can be customized depends on the combination of filters selected.
When an advanced filter has been created, the Filters toolbar displays the label ADVANCED.
Note:
Advanced filtering requires higher resource consumption. Complex advanced filters utilize more system resources and may impact overall system performance.
Working with advanced filters involves the following tasks:
Creating an Advanced Filter
To create an advanced filter:
-
From the navigation list, select Calls.
-
On the Filters toolbar, click Clear which removes any applied filters.
-
On the Filters toolbar, click Edit Advanced.
The (Unnamed Filter) dialog box appears.
-
Click +.
A list of filter fields appears.
-
Select fields to include in the advanced filter.
-
Click Save.
The Save filters dialog box appears.
-
In the Name field, enter a name for the filter.
-
Click Save.
The (Unnamed Filter) dialog box is now named the title you assigned the advanced filter.
-
Click Hide which closes the dialog box.
Adding Criteria to an Advanced Filter
To add criteria to an advanced filter:
-
From the Filters list, select an advanced filter.
-
Click Edit Advanced.
A filter dialog box appears.
-
Click +.
-
Select fields to include in the advanced filter.
Repeat this step to add additional fields.
Tip:
You can drag column headings from the Recent calls table into the dialog box.
-
In the filter dialog box, customize the logic of the filter you choose by entering or selecting logic values to filter for.
-
Click Save.
-
Do one of the following:
-
Click Apply Now which applies the filter to the Recent calls table.
-
Close the dialog box and apply the saved filter at a later time.
-
Adding Scope to an Advanced Filter
You could create an expression with criteria a, b, and c. You can include brackets in the filter criteria to isolate terms that are dependent on each other, such as:
(a = 2 AND b = 4) OR c = 10
or
a = 2 AND (b = 4 OR c = 10)
To add scope to an advanced filter:
-
From the Filters list, select an advanced filter.
-
Click Edit Advanced.
The filter dialog box appears.
-
Click () in the row you want to add scope to.
-
Click + in the same row and insert filter conditions.
Note:
You can move filter criteria within a dialog box by dragging it to a new area.
Tip:
You can drag criteria in to or out of bracketed statements.
-
Click Save.
-
Do one of the following:
-
Click Apply Now to apply the filter to the Recent calls table.
-
Close the dialog box and apply the saved filter at a later time.
-
Editing an Advanced Filter
To edit and advanced filter:
-
From the Recent calls window, select an advanced filter.
-
Click Edit Advanced.
The filter dialog box appears.
-
Edit the filter criteria.
-
Click Save.
-
Do one of the following:
-
Click Apply Now to apply the filter to the Recent calls table.
-
Close the dialog box and apply the saved filter at a later time.
-
Applying an Advanced Filter
To apply an advanced filter:
-
From the Recent calls window, select an advanced filter.
-
Click Edit Advanced.
A filter dialog box appears.
-
Click Apply Now and close the dialog box.
Clearing Advanced Filters
To clear advanced filters:
-
From the Filters toolbar, select Clear.
Toolbar
The Recent calls table has, in order, the actions as listed in Table 4-4.
Table 4-4 Recent Calls Table Actions
| Actions | Description |
|---|---|
|
Details |
Opens the Call Details window for the selected call. See Figure 4-35. |
|
Filters: |
Select from the list of advanced filters. |
|
Edit Advanced... |
Opens the selected filter for editing. |
|
Save |
Saves the changes to the advanced filter. |
|
Clear |
Resets any selected filters. |
|
Message flow |
Shows the message flow diagram for the selected calls. You can select multiple calls in the call grid and show a combined message flow diagram. Use the Ctrl key on Windows/Oracle Linux machines and the Cmd key on Macintosh machines. For more information, see " Working with Message Flows ". |
|
Bulk export |
Exports the current calls grid contents (with the current set of filters applied) as a zip archive. The archive contains one .csv file which is similar to the one generated with the normal CSV export (see above), but with an additional column named pcap_filename. This references one of the pcap files included in the archive, which contains both SIP and RTP data for the call. If column filters are set, they are also applied to the exported CSV file. It is recommended to filter the calls list to the set of interest before exporting the CSV file. |
|
CSV export |
Exports the calls data content in CSV format, for post-processing purposes. If column filters are set, they are also applied to the exported CSV file. The CSV files are truncated to 50 thousand records. It is recommended to filter the calls list to the set of interest before exporting the CSV file. |
|
View saved calls |
Shows the list of already saved calls in Operations Monitor. In order to save a call, the Save option from the calls details page must be used. |
|
Show in Dashboard |
Adds a reduced version of the Recent calls table to the Dashboard. |
|
Auto-Refresher |
From the Refresh menu, the table can be set to auto-update, in order to display the most recent calls and their state changes in real-time. You can set the table to auto-update from the Refresh menu in order to display the most recent calls. The state changes in real-time. For more information, see " Refresh Button ". The default auto-refresh interval for this table is 5 seconds. |
Right-Click Menu
Right-clicking a row in the Recent calls table shows the following contextual options:
-
Track caller and Track callee
Choosing one of these two options opens the User Tracking page, pre-filled with the caller or the callee user of the selected call. For more information, see " User Tracking ".
-
Create trace with
Choosing this option opens the Traces page, pre-filled with the caller or the callee user of the selected call. For more information, see " Traces ".
-
Record media of caller and Record media of callee
Choosing one of these two options opens the Record media for a new user window. For more information, see " Media Recording ".
-
Call details window
Choosing this option opens the Call Details Window. For more information, see " Call Details Window ".
-
Message Flow
Shows the message flow diagram for the selected call. For more information, see " Working with Message Flows ".
-
PDF report
Creates a PDF report for the selected call. A dialog appears that allows the user to select the information to include, and to provide a comment to add to the report (see Figure 4-31).
-
Filter table for ...
Shortcut to column filters. This gives a convenient way of finding calls that are similar with the one selected. See Figure 4-32.
Figure 4-32 Filter Using the Right-Click Menu

Description of "Figure 4-32 Filter Using the Right-Click Menu"

Paging
The paging bar allows you to navigate the entries. With the Newer and Older buttons you can step to the next page of newer respective older entries (see Figure 4-33).
The Now button takes you to the first page, showing the newest entries. The date picker allows you to chose an arbitrary first date and time of the time period you want to view (see Figure 4-34).

The loading bar will show when entries are being fetched. To fill up a page while applying filters, this might require several calls to the server and might take some time. The blue bar in the loading bar shows the range that has been searched.
The refresh button to the right reloads the current entries and shows their updated states.
You can also set the refresh button to auto-refresh mode.
Note:
The auto-refresh mode in combination with filtering of a grid can lead to longer refresh times than selected.
Call Details Window
To open the call details panel (see Figure 4-35), double-click on a row from the Recent Calls table or click the Details button from the toolbar. You can also access the call details panel from the Media Summary page. For more information, see "Voice Quality".

Note:
It is possible that the number of segments for a call in the Call Info screen are more than the number of calls shown in Recent Calls screen. This is because the information displayed in Call Info screen is obtained by connecting to other nodes in order to retrieve the external segments from other nodes.
The top section contains a brief identification of the call: the numbers involved, current state, starting time, ringing, and call duration. Right-clicking on the numbers or user names shows a contextual menu, as shown in Figure 4-36. For more information on these options, see "User Tracking".
Figure 4-36 Right-Click Menu for the Caller and Callee

Description of "Figure 4-36 Right-Click Menu for the Caller and Callee"
The bottom section contains four tabs: Segments, Media Summary, Media Details and Messages.If the current user has ISR permissions, then an additional tab, ISR appears.
Segments
The Segments tab (see Figure 4-35) shows details about each call leg within the call, including:
-
State, per call leg.
-
Call-ID.
-
From and To tags.
-
Request-URI.
-
Caller and callee devices.
-
Source and destination devices set with Platform Devices. For more information, see "Platform Devices".
ISR
The ISR tab shows the recording details and allows to play and download the recordings available in ISR for a call.
Note:
To access ISR recordings, you must have Oracle Communications Interactive Session Recorder (ISR) with Operations Monitor.
You must have ISR and Operations Monitor to troubleshoot sessions and listen to recordings.
Operations Monitor uses the ISR FACE API to request recordings for known UCIDs. You need to configure FACE API IP Credentials in Operations Monitor to have an option to play a recording and query the ISR to stream the audio. For this, Operations Monitor calls the ISR's REST API (FACE) to retrieve metadata and the audio stream of a call which is visible in Operations Monitor and has been recorded by ISR.
From ISR screen, you can:
-
Click Play to listen the recording. Click Pause to hold the play.
-
Click Download to download the recording.
Figure 4-37 ISR Tab

For more information on configuring ISR with Operations Monitor, see "Configuring Operations Monitor with Interactive Session Recorder".
Messages
The Messages tab shows a table representation of the messages from the call.
Table 4-5 Messages Table
| Column | Description |
|---|---|
|
Date and Time |
The absolute time when this message was seen by Operations Monitor. |
|
Details |
In case of SIP messages, it is equal to Request-URI for SIP requests, or the reason phrase for SIP replies. In case of ISUP messages, it is equal to point codes. In case of ENUM messages, an example might be 8.4.1.1.7.7.9.7.9.7.4.4.e164.arpa. In case of MEGACO messages, an example might be Add or Modify. |
|
Dst IP |
The destination IP address and port number. |
|
Dst MAC |
The destination hardware address. This column is hidden by default. |
|
Dst PC |
The destination PC address. This column is hidden by default. |
|
Message |
In case of SIP messages, it is equal to the SIP method for SIP requests, or the response code for SIP replies. In case of ISUP messages, it is equal to one of the ISUP method types: IAM, ACM, RLC, etc. In case of MEGACO messages, it is equal to either MEGACO Request or MEGACO Reply. In case of ENUM messages, it is equal to either ENUM Query or ENUM Answer. |
|
Proto |
The transport layer protocol. The supported transport protocols are UDP and TCP. |
|
Src IP |
The source IP address and port number. |
|
Src MAC |
The source hardware address. This column is hidden by default. |
|
Src PC |
The source PC address. This column is hidden by default. |
Figure 4-38 Call Details Messages Tab

Click the Expand Messages button to view the raw messages as seen on the network. The raw messages can be also viewed in context in the message flow diagram.
Media Summary
The Media Summary and Media Details tabs display the voice quality summary of the finished calls. It displays the source and destination devices when set in Platform Devices. For a Skype for Business call, along with the other details, the Media Type and the Codec used are also displayed.
Figure 4-39 Call Details Voice Quality Tab

Call Details Toolbar
You can save the call details for debugging later.
Click the Save button to save all the call details, including the raw messages and voice quality information.
Click the PCAP button to download the raw signaling messages and the media streams of a call into PCAP file format. See "Downloading Call Details to a PCAP File" for more information.
Click the PDF button to create a PDF report for the call with details about segments, raw messages and voice quality information.
Click the Message flow button to open the message flow diagram.
Downloading Call Details to a PCAP File
You can save the raw signaling messages and the media streams of a call to a PCAP file. When a call has multiple media streams, a single PCAP file is created containing all the streams.
To save the call details to a PCAP file:
-
In the call details panel, click the PCAP button.
The PCAP download dialog box appears, as shown in Figure 4-40.
If the media stream is not already saved on the Operations Monitor system, it is downloaded from the Probe.
Note:
If the media packets are no longer available on the Probe, the PCAP file will not contain the packets of those streams.
-
Select the media streams you want to save. The content available for downloading depends on your user permissions.
Note:
Downloading media streams from the Probe generally takes more time than downloading from the Operations Monitor system.
-
Click the Download button.
The Export status dialog box appears, which contains a link to the PCAP file that is generated for the call.
-
Click the PCAP file link.
-
Select the option to save the file, and click OK.

Device Visibility in Realms
Device visibility in a realm works as a whitelist for visible devices and a blacklist for hidden devices. By default (if no realm is set in the realm visibility settings for a particular device), realm users will not view the related information (messages/segments) for legs via that device.
If the user belongs to a realm which has limited device visibility (only some devices are visible to the realm):
-
Information about call segments between visible devices are shown.
-
Information about call segments between visible devices and hidden devices are not shown.
-
Information about call segments between visible devices and unknown hosts are shown. An unknown host is a host that does not belong to any device. To hide this information from the realm, create a new device for the respective unknown host and set it as hidden for this realm.
This behavior affects the call information on the Segments and Messages tabs, in the message flow diagram, PCAP, and PDF generation.
Note:
To set a device as visible or hidden to a realm, under Platform Devices, click Realms. The Realm Assignation dialog box opens. Select the required checkboxes to assign one or more realms to a single device.
For matching devices, the IP or IP range along with the VLAN information, is considered. As a result, if the VLAN information does not match the device definition, the unmatched device will appear in the diagrams identified by its IP and VLAN. VLAN = 0 implies there is no VLAN, so it matches only the IP of the device.
Following are examples to understand the device visibility:
Example 1
In the following example, User A belongs to Realm A, for which Dev A is shown and Dev B is hidden.
Assume that you will have a call with four legs as shown in the Figure 4-41. There are no VLANs involved in the call.
Figure 4-41 Device Visibility Example 1
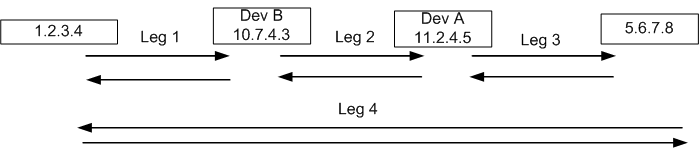
In all the possible views that User A could use to see at call flows or call messages (except for the Traces feature and PI (Packet Inspector)):
-
Leg 1 - Hidden (because Dev B is hidden)
-
Leg 2 - Hidden (because Dev B is hidden)
-
Leg 3 - Visible (because it is between a visible device and an unknown IP)
-
Leg 4 - Visible (because it is between an unknown IP and another unknown IP)
Example 2
In the following example, User A belongs to Realm A, for which Dev A is shown and Dev B is hidden.
Dev B is defined as 5.6.7.8(VLAN=1000) and Dev A is defined as 4.5.6.7(VLAN=1000) 11.2.4.5(VLAN=2000).
Assume that you have a call with three legs as shown in the Figure 4-42 in which Leg 1 and Leg 2 have VLAN=1000, and Leg 3 has VLAN=2000.
Figure 4-42 Device Visibility Example 2
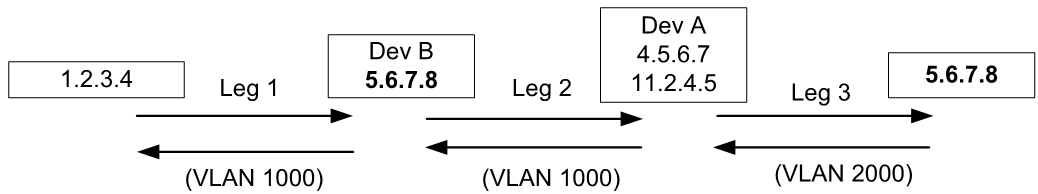
In all the possible views that User A could use to look at call flows or call messages (except for the Traces feature and PI):
-
Leg 1 - Hidden (because Dev B is hidden)
-
Leg 2 - Hidden (because Dev B is hidden)
-
Leg 3 - Visible (because for this leg the VLAN tag is 2000 and not 1000, Leg 3 does not match Dev B (even though it has the same IP address). For this reason, Leg 3 is considered to be a leg between Dev A and an unknown host.)