Alerts
Operations Monitor has a notification system to warn you of important events called alerts. You can prioritize alerts and configure them to trigger certain actions. The Alerts page displays all alerts that have been raised.
Table 3-2 Alerts
| Alert Name | Description |
|---|---|
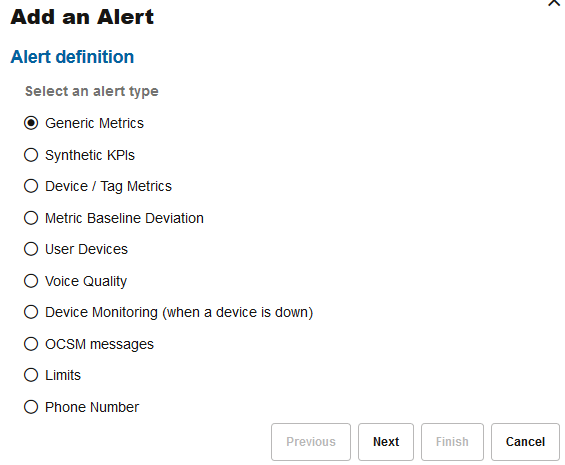
| Generic Metrics | Statistics metrics exceed or fall below certain thresholds. |
| Device/Tag Metrics | Statistics metrics exceed or fall below certain thresholds. |
| Synthetic KPIs | Value for a synthetic KPI exceeds or falls below the given threshold. |
| Metric Baseline Deviation | Allows comparison between a current KPI value and a previously captured KPI value. An alert is generated based on the difference between the two values. |
| User Devices | A certain user device is detected by the system. |
| Voice Quality | The quality for a percentage of calls falls beyond a MOS threshold. |
| Device Monitoring (when a device is down) | A device is down. |
| Oracle Communications Session Monitor messages | Messages sent from Session Monitor |
| Limits | An internal soft limit within Operations Monitor was passed. |
| Phone Number | A certain phone number placed or received a call. |
The Alerts table displays notifications. You can create or edit an alert definition in the Alert Definitions tab.
Alerts Table
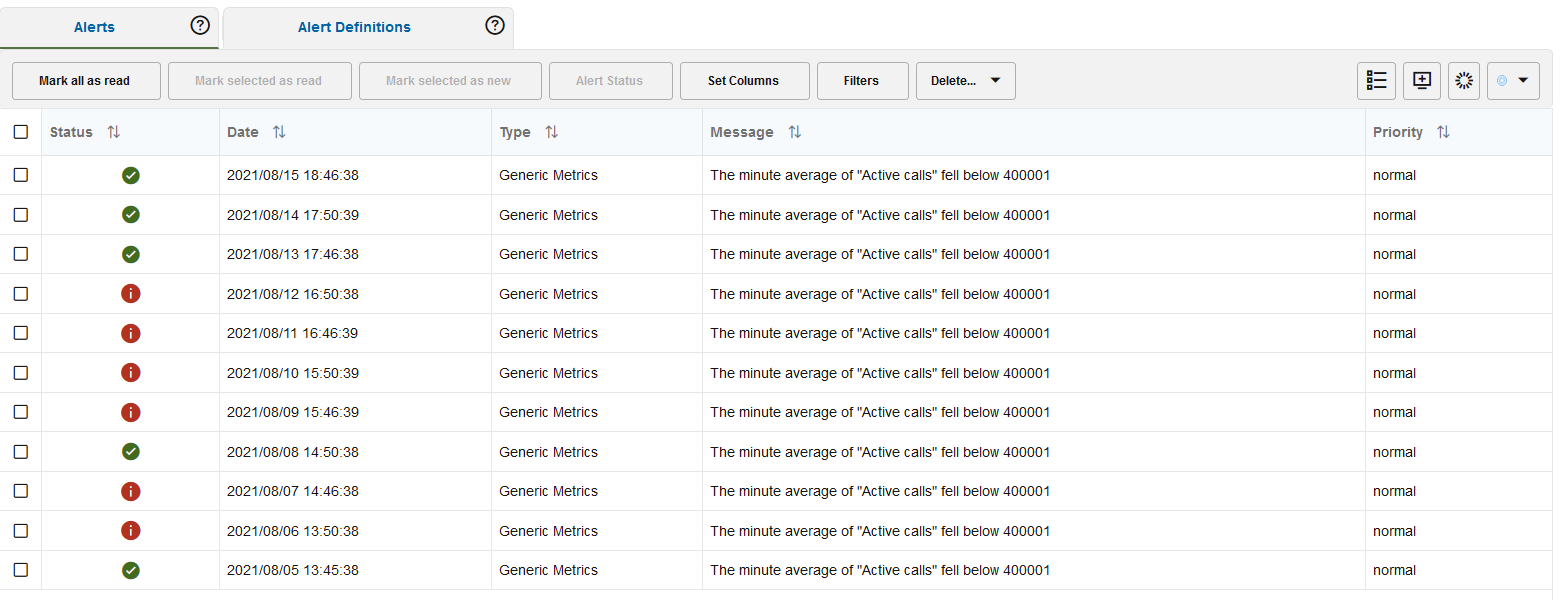
Click Alerts in the navigation pane to display the alerts panel, as shown in the following figure.
Figure 3-22 Alerts page
The following table lists the Alerts panel table columns:
Table 3-3 Alerts Table
| Column | Description |
|---|---|
| Status | Unread alerts are marked with a red icon. Alerts that have been viewed or read are shown with a green icon. Clicking the icon toggles the status as read/unread. |
| Date | The date when the alert was raised. |
| Type | The type of the alert. This columns allows for easy filtering. |
| Message | The alert message explains why the alert was raised. |
| Priority | Setting priority ranks the alerts. The alert entries with high priority are highlighted by a red background. Low priority alerts are displayed in a lighter color. |
Figure 3-23 Alert Status dialog box
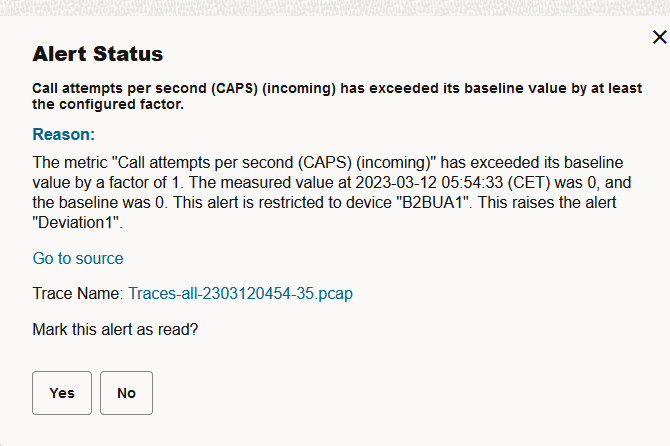
- Reason: The reason why this Alert got triggered.
- Go to Source: Takes you to the source where this Alert got triggered.
- Trace Name: Displays the link for the name of the trace
file associated with this alert. Click the link to take you to the Traces page.
Note:
You can see the link to the Trace file only if you have set a value for the Create a trace field value in the Alert definition. If the Create a trace field value is not set in the Alerts definition, you will not see any Trace file name and link in the Alert status dialog box. - Mark this Alert as Read: Click Yes to mark this Alert as read.
In Alerts page, the Mark all as read button respects table filters, and can be helpful when treating similar alerts. For example, to mark all statistic threshold alerts, enable Filters in the Type column and click Mark all as read. The Delete drop-down menu allows you to delete either:
- Selected alerts (the check box in the first column is marked).
- Alerts marked as read.
- All alerts.
Upon initial installation of Operations Monitor, the only alerts raised are related to licenses. You must create Alert definitions to receive further notifications.
Note:
To avoid being inundated with alerts (for example Number of active calls exceeded 5000), Operations Monitor creates duplicate alerts only when the previous one has been deleted, marked as read, or when 1 day has passed.Alert Definitions Tab
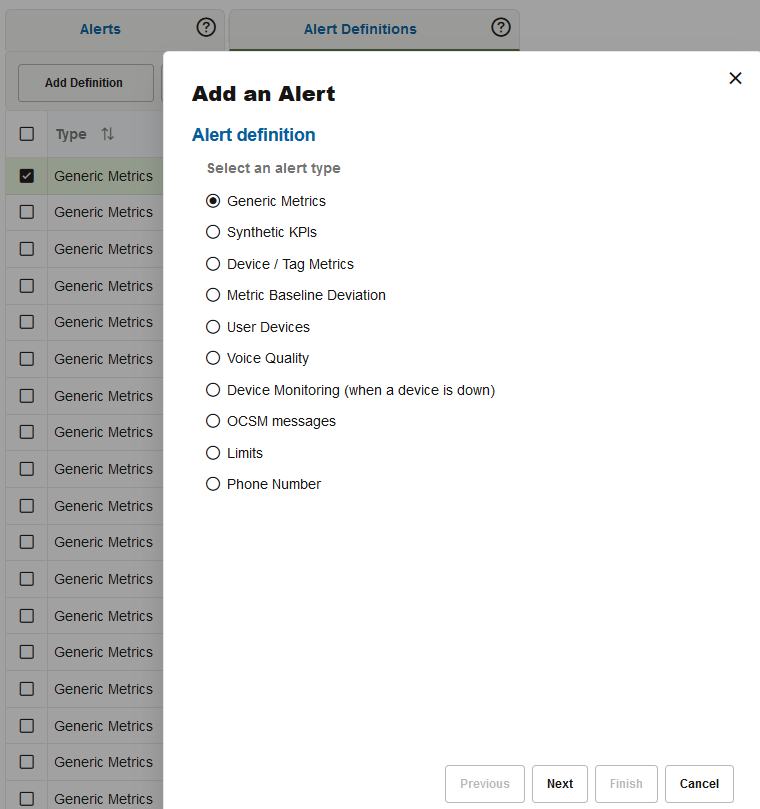
Alert definitions establish which events on the system raise a notification. On the Alerts page, click the Alert Definitions tab to add a new alert definition. You can also add Alert definitions for the KPIs provided for Non-Call messages such as SUBSCRIBE, NOTIFY, and PUBLISH.
Figure 3-24 Add an Alert Definition
Actions
Figure 3-26 Actions
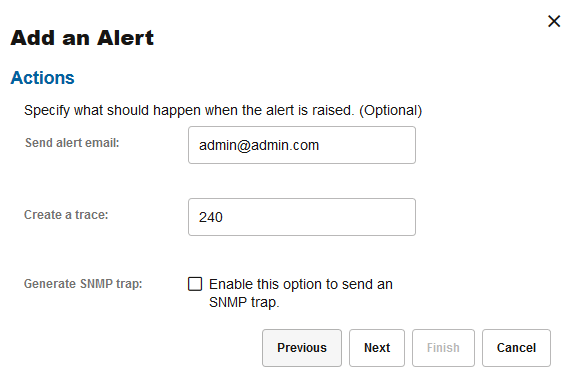
Table 3-4 Fields in the Alerts Definition Table
| Fields | Description |
|---|---|
| Send alert e-mail |
Sends an e-mail about the alert to the specified address. SMTP access needs to be configured before. For more information about configuring SMTP, see Configuring SMTP Settings. For most alert types, a deep link to the source of the alert marked as "URL to source" is provided in the alert e-mail. To receive this link, you must first configure the External IP/hostname. For more information, see External IP/hostname. For Traces, if only the Send alert e-mail field has a value, an e-mail notification is sent when an Alert is raised. You can also see the Alert on the Alerts page. The Alert will not have any link to the Trace file. |
| Create a trace |
Creates a trace of the current SIP traffic when the alert is raised. Enter an appropriate time span (in seconds) for packet capture to tell Operations Monitor how far back in time the trace should go. When this field along with Send alert e-mail has valid values, an Alert is raised on the Alerts page, and an e-mail notification is received. Both - the Alert and the e-mail will have the Trace filename and a link maked as URL to trace. If a value is specified only in the Create a trace field, the Alert raised is only visible on the Alerts page. No email notification is sent. The Alert status dialog box has the name and the link to the Traces file. |
| Generate SNMP trap |
Sends an SNMP trap to a configured SNMP target. When this is enabled, Operations Monitor alerts can be tracked and analyzed by an SNMP manager in the network. For more information, see "SNMP Options". |
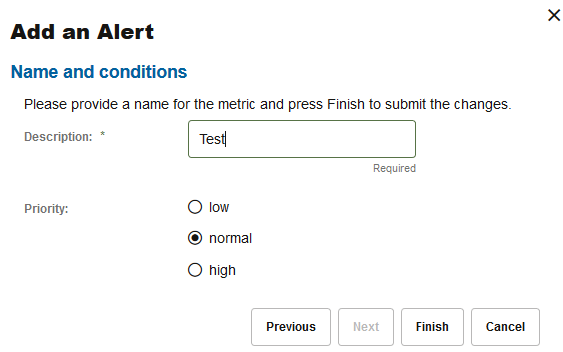
Alert Name and Priority
Note:
The Minimum active calls condition is checked at the time of the alert generation, which is (depending on server load) one to several minutes later than the actual alert condition.Figure 3-27 Alert Name and Priority
Editing and Deleting Alert Definitions
To edit a definition, perform one of the following actions:
- Select the entry and click Delete.
- Double click the entry.
To delete a definition, select the entry and click Delete definition. Once an alert has been deleted, Operations Monitor no longer raises a notification for this definition.
Parameters
The following sections describe the various parameters for each alert type.
Statistics Metrics
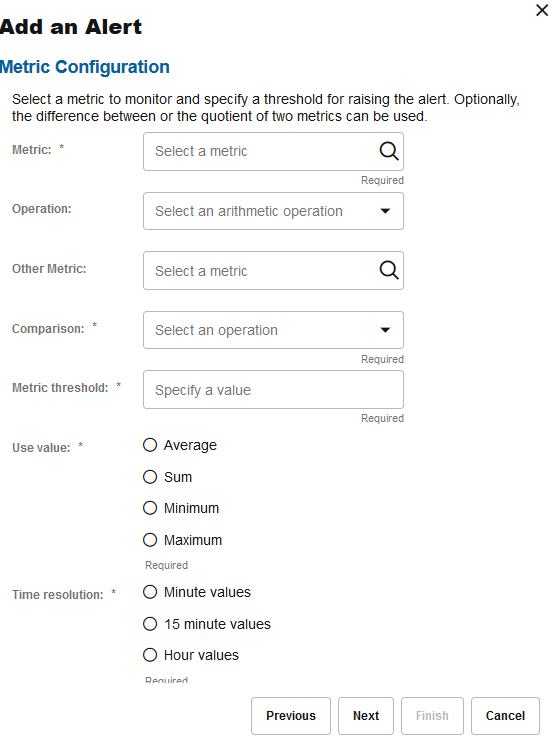
Alerts can be defined with either one or two metrics. The metrics are compared to a threshold value using a comparison operator (for example =, <, > or not).
When you input one metric, the alert is triggered if the metric exceeds or falls below the given threshold value, depending on the comparison operator provided. This is suited for alerts such as 'The number of registered users exceeds 20,000.' In this example, an alert is sent when the number of registered users exceeds 20,000. If you would like a second alert to notify you if the value falls below 20,000, you must create a second definition.
When you provide two metrics, Operations Monitor considers the difference of the two metric values to a given threshold value, and therefore allows for more sophisticated alerting scenarios. For example, a statistics metric value deviates too much from its average value.
The example in the following figure shows the metric configuration of the alert scenario 'The number of registered users fell by 1,000 in the last week'. For using this alert definition, you must set the regular value for the metric as well as its average metric. For more information, see "KPI/Metrics".
Figure 3-28 Metric Configuration for Alerts
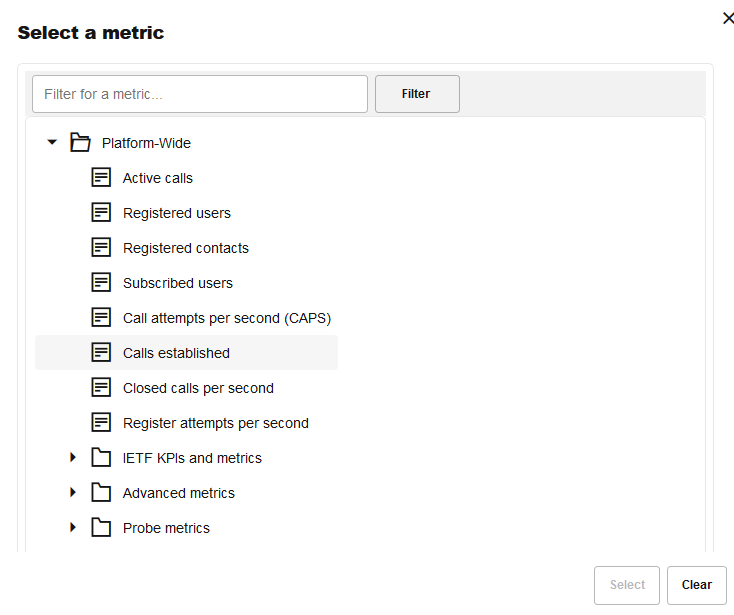
Clicking in the Select a metric field for a metric displays the metrics dialog box (see the following figure), where you can choose a metric:
Figure 3-29 Select a Metric
Synthetic KPIs
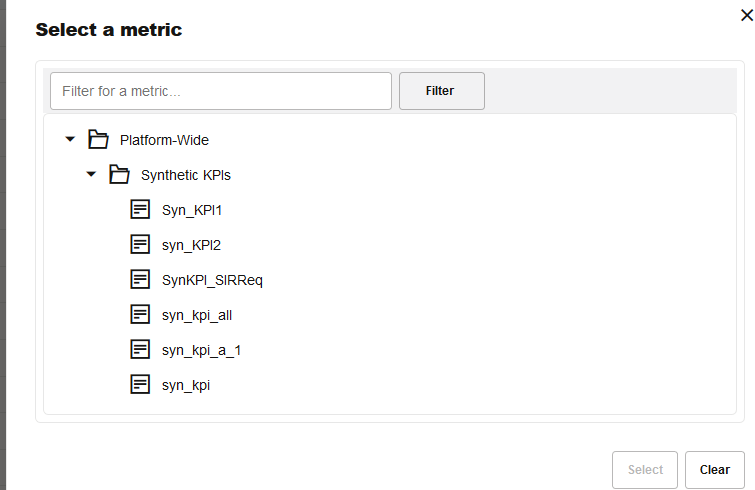
Synthetic KPI alerts comprise a synthetic KPI metric, a comparison operation, and a threshold value as illustrated in the following figure . An alert gets triggered when the value for a synthetic KPI exceeds or falls below the given threshold. For more information on creating synthetic KPI, see "About Synthetic KPIs".
Figure 3-30 Select a Metric
User Agent
Operations Monitor keeps track of all user devices that are registered on the platform and raises an alert depending on the desired option.
Highlighted Devices
If a list of disapproved devices has been configured in User Devices, and Operations Monitor notices a user device from that list, an alert is sent. This option is recommended if User Devices is frequently updated so that the list can be centrally managed there. For more information, see "User Devices".
Alert on match
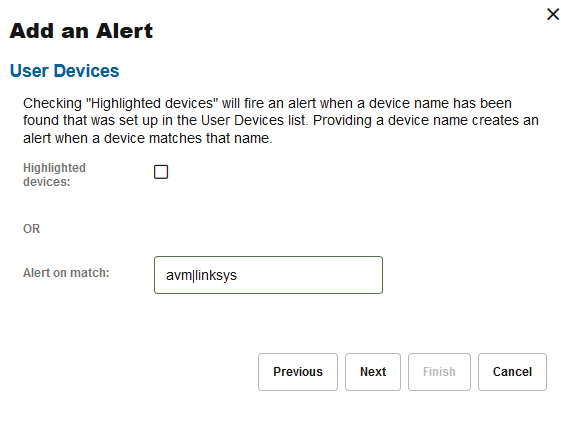
This option is intended for a more ad-hoc tracking of user devices. A regular expression can be entered to raise an alert when a matching user device is found. For every expression to track you need to add another alert definition.
The following figure shows an example configuration for detecting any AVM or Linksys devices.
Figure 3-31 Sample configuration for detecting any AVM or Linksys devices
Device Monitoring
This alert type refers to Device Monitoring and does not need additional parameters. Whenever a monitored device is down, an alert is raised. Only one alert definition of this type is needed. For more information, see "Device Monitoring".
Phone Number Alerting
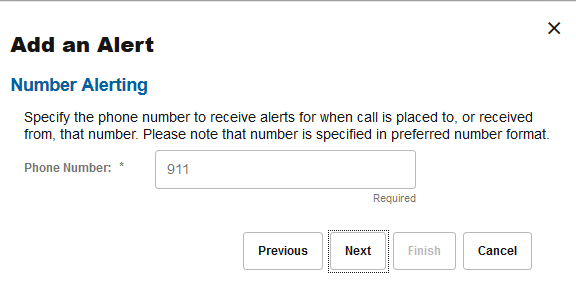
The Phone Number type provides the possibility to alert on a specific phone number. The alert will be triggered when a call to or from a configured number is detected. To use this alert type the user needs to have the Number Alerting permission. Without this permission the Phone Number option will not be shown.
Phone numbers are configured in preferred number format. If the Use User Domains system setting is set to true then a phone number should be provided as a SIP user, that is, with a domain name: for example, 00403077811-call@example.com. If not, the phone number should be provided without domain (and without the @ sign). For more information, see "Use User Domains".
Note:
Only one number per alert can be defined. No wild cards are allowed.A good strategy for setting up a number alert is to place a phone call to the desired number and look in the calls grid for the callee to get the exact SIP address/phone number to use for the alert definition.
The search for predefined phone numbers happens two times per minute, with calls that are at least 10 seconds old (in the early stages of a call, not all information needed is available). This means that a call in best case is detected after 10 seconds, in worst case after 40 seconds.
Figure 3-32 Phone Number Alert
