Traces
The Traces page allows you to capture, store and download packet traces of the SIP traffic. Downloads are done in the industry-standard PCAP format, which contains the complete messages as monitored on the network.
The PCAP file format can be interpreted by most of the available protocol analyzers, including open source tools. Any stored message contains TCP/UDP headers, an IP header, and layer 2 headers, as well as the time stamp at which Operations Monitor received it. All messages are written to the disk before any processing is performed. The filter defining, which traffic the traces, can be set in the Signaling Protocols section in the Platform Setup Application.
Packets are captured from the moment a trace is started. With Operations Monitor, you can also trace events in the recent past. For more information, see "Packet Buffer".
You can restrict traces to a single SIP user or an IP.
Note:
If you restrict the traces to a SIP user, only UDP packets will be captured.Packet Buffer
In order to create traces with packets received prior to the current time, Operations Monitor keeps an in-memory, rotating raw packet buffer with all the messages captured. The default size of this buffer is 1 GB including the message overhead. The buffer size system option allows you to change the size of this buffer.
Figure 3-33 Traces Info

The Traces page contains three panels: the first shows information about the raw packet buffer, the second panel can be used for creating a new trace, and the third panel shows the currently running and finished traces.
Traces Info Panel
The Traces Info panel displays details about the state of the raw packet buffer:
-
Number of frames in buffer
The total number of frames that are currently in the in-memory buffer.
- Size of the buffer
The total size in bytes of the raw packet buffer, including the overhead needed for indexing the messages.
- Max size of the
buffer
The maximum size in bytes to which the buffer can grow. When this limit is reached, old packets are discarded.
- First frame in buffer
The timestamp of the oldest packet still in the buffer. Traces cannot capture messages before this point in time.
-
Last frame in buffer
The timestamp of the newest packet in the buffer. This information is provided in order to approximate the capacity of the buffer in seconds.
Signaling Traffic Capture Panel
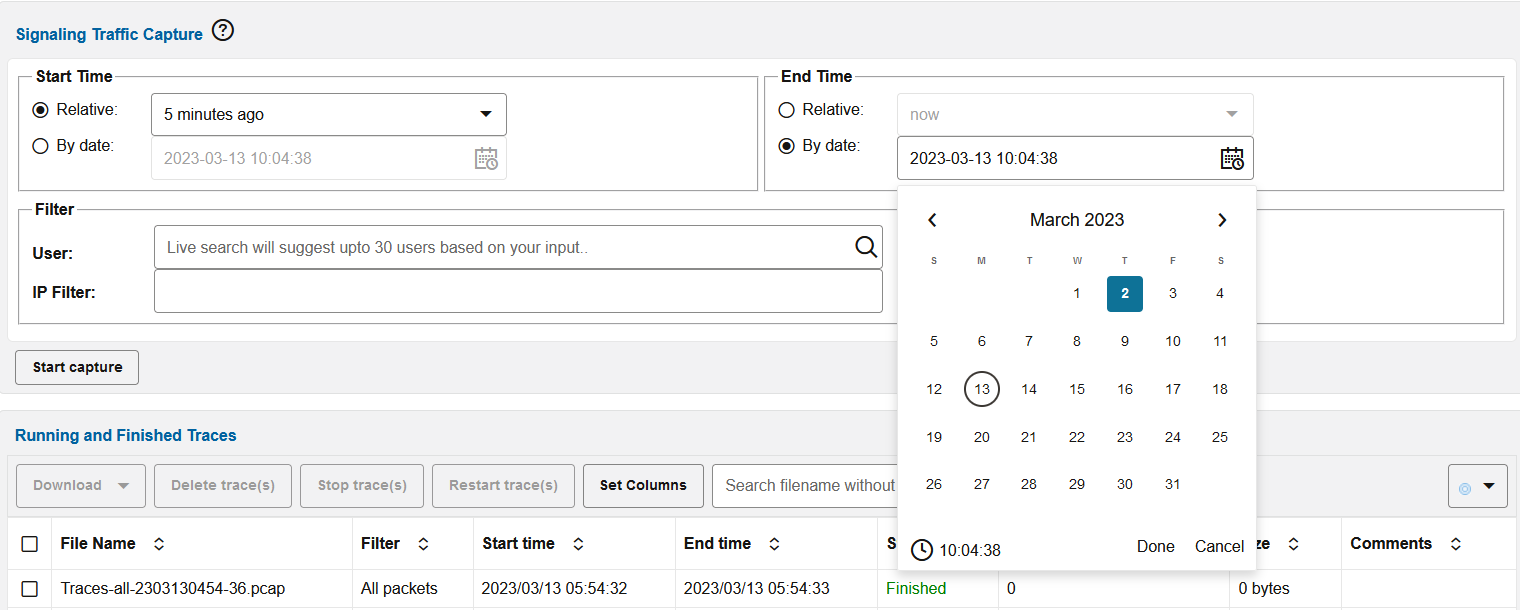
The Signaling Traffic Capture panel allows you to capture signaling traffic and save the data to a PCAP file. If you click Start Capture immediately, a trace begins with default settings. This provides a trace for activity in the last five minutes including non-call related messages such as OPTIONS and PUBLISH.
This panel allows you to configure time ranges, and filter SIP traffic by user or IP.
You can specify the Start time, End time, and the Filters used for a new trace in the Signaling Traffic Capture panel. Start and end times can either be set relative to the current time or by using absolute times. If the start time lies before the current time, the trace contains packets from the raw buffer. If the end time lies after the current time, the trace is started and write the packets received until the selected end time or until the user stops the trace.
Note:
Traces are limited to durations up to 24 hours. Set traces to a duration shorter than 24 hours. After 24 hours of capturing, no further packets are traced.A Filter restricts captured messages to a single user, a single Operations Monitor network port, an IP address, or a combination of these. The User field has a live auto-complete feature: while typing the first characters of a user name or number, Operations Monitor suggests user names and numbers containing those characters from the set of known users.
The number of traces running simultaneously is limited to 3 by default and are configurable depending on the license. If the limit is exceeded, an error message is displayed.
Examples
The following figure shows a new trace created for a past transaction using absolute times (from 10:18:56 to 12:24:00). No filter is selected: all messages received by Operations Monitor in the given time interval are included in the trace.
Figure 3-34 New Trace Created for a Past Transaction

In the following figure, a new trace is created for all messages from user '123000020343' from the last 5 minutes. Here, we use a relative start and end time.
Figure 3-35 New Trace Created for all Messages from a User

The following figure illustrates a trace created for all messages, which have either the source or destination IP address in the 62.220.32.0/24 network range. The IP filter field accepts both a host IP address in dotted format (a.b.c.d) or a sub-network address with the net mask appended (a.b.c.d/e).
Figure 3-36 Trace Created for all Messages with Source or Destination IP Address

Running and Finished Traces Panel
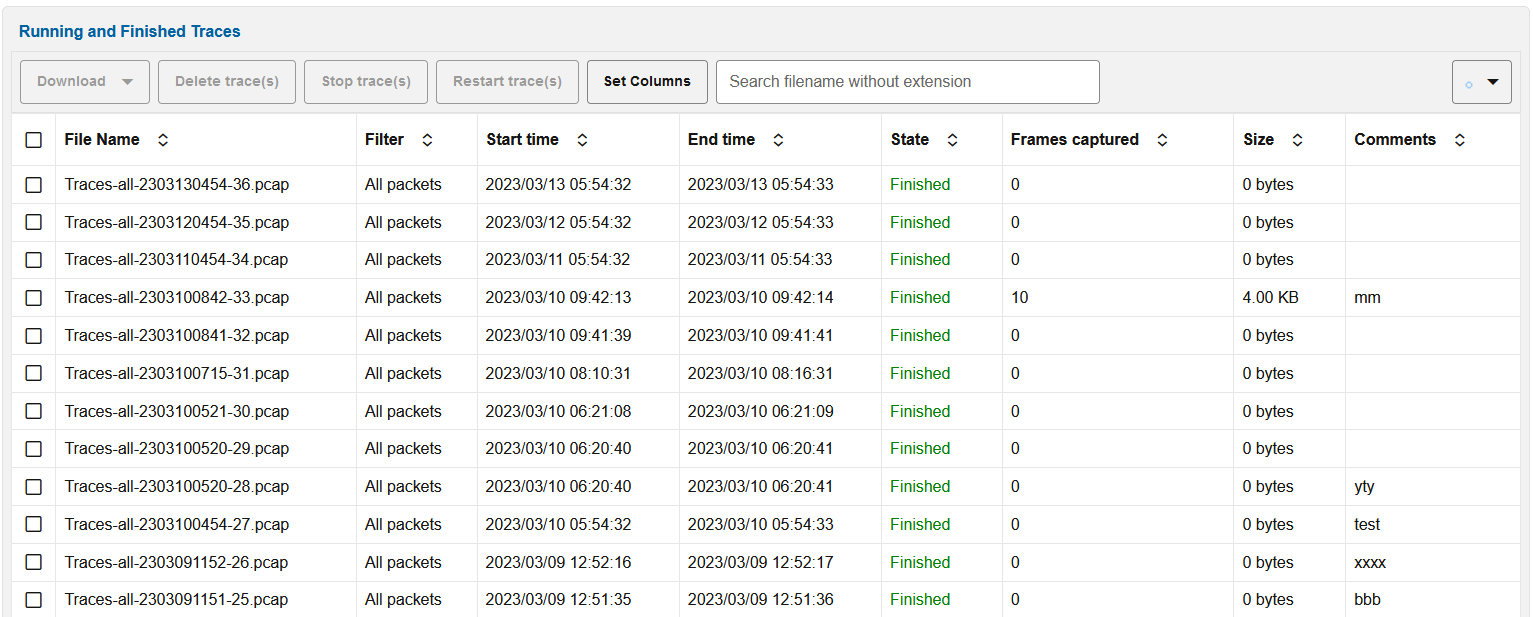
The last panel on the page lists all traces that are stored on the disk and offered for download. Traces that are currently in progress are also listed and may be stopped before their scheduled end time. The following figure illustrates the panel.
Figure 3-37 Running and Finished Traces

The following information is :
Table 3-5 Information presented for every trace
| Column | Description |
|---|---|
| File name | The name of the PCAP file on disk. This will be also used as the proposed filename when downloading the trace. |
| Filter | Short description of the filter used for the trace. |
| Start time | The date and time the packet trace began. This can lie before the time at which the user has requested the trace. |
| End time | The date and time when the trace was stopped, or the time it is scheduled to stop in the case of running traces. |
| State | The current state of the trace is one of the following:
|
| Frames captured | The number of packets stored in the trace. For running traces, this value is the number of packets written thus far |
| Size | The size in bytes of the capture file. |
| Comments | Remarks on the Trace. |
All columns of in the Running and Finished Traces can be sorted. For example, you can click the Size column to sort the traces by size.
By default, the table is refreshed every five seconds, which can be changed using the Auto Refresher drop-down menu at the top right corner of the table.
When you select a trace from the list, the following actions are available from the toolbar above the table:
- Download
- Downloads the selected trace. This only works when selecting one trace at a time. Traces are compressed in a .gzip format in order to speed up the download.
- Delete trace(s)
- Deletes the selected traces from Operations Monitor storage.
- Stop trace(s)
- Stops the selected traces if they are currently running.
- Restart trace(s)
- Starts a trace with the same parameters as the selected trace, but with the time shifted to present. This only works for traces with relative start and end times.
Note:
The total size of storage space, which all traces can use is limited. When the space is full, the oldest trace is automatically deleted. The default value of this limit is set to 40 GB on a standard Operations Monitor server, with the traces being stored in a compressed form.