Flow Analytics
Learn about Unified Assurance Flow Analytics. This section is intended for trained Unified Assurance administrators and consultants to plan, run, and support a Flow Analytics deployment.
Introduction
Unified Assurance Flow Analytics is a complete solution to collect, analyze, and provide real-time visibility into whom and what are consuming network bandwidth.
Flow Analytics lets you:
- See which users, devices, and applications are using the most bandwidth
- Discover traffic patterns and device performance
- Prioritize business-critical applications
- Validate the effectiveness of class-based quality service (CBQoS) policies
Architecture
With all Unified Assurance solutions, the components are broken down into three layers: collection, database, and presentation. The majority of the solution resides in the collection layer on a dedicated server. If multiple data centers or multiple managed customers will be exporting flows, Oracle recommends installing separate collection servers in each data center to get as close to the exporting devices as possible. Raw flow data should not have to consume bandwidth traversing WAN links if possible.
The architecture layers provide the Flow Analytics end-to-end functionality as follows:
-
Collection layer: Devices send flow data into the collection servers where they are processed. See Flow Collector in Unified Assurance Implementation Guide for more information.
-
Database layer: Flows are stored in the Elasticsearch database.
-
Presentation layer: Users interact with flow diagrams in the Kibana UI inside the Unified Assurance UI. You can see the default dashboards from the navigation menu by selecting Analytics, then Flow, then Dashboard. The overview dashboard has several tabs allowing you to drill into different visualizations of flow data.
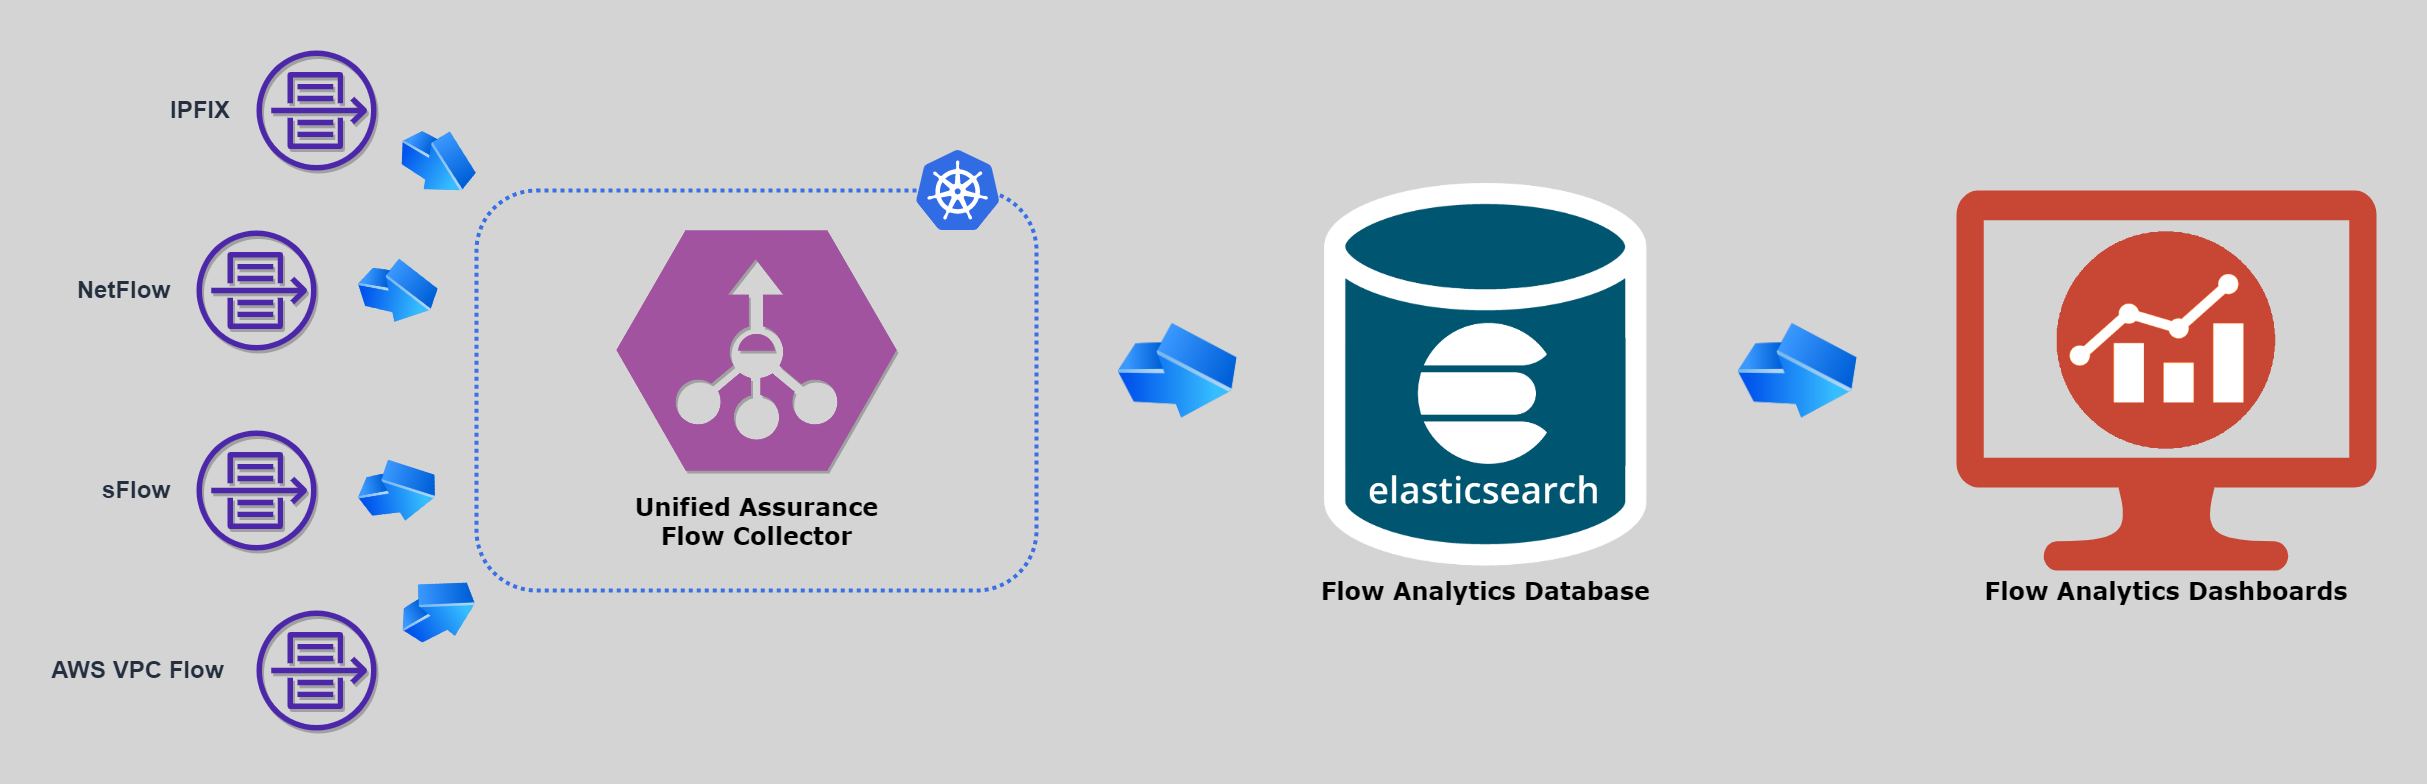
Description of illustration flow-analytics-architecture-diagram.png
Enriching Flow Data
Flow records can be enriched with additional data not sent from the devices exporting flows. By default, enrichment is not enabled.
To enable enrichment, add the following files to the cluster node running the Flow Collector microservice:
-
Manual host name resolution: $A1BASEDIR/etc/flow/hostname/user_defined.yml
Example contents:
'192.0.2.1': 'host1' '192.0.2.2': 'host2' -
GeoIP autonomous systems: $A1BASEDIR/etc/flow/maxmind/GeoLite2-ASN.mmdb
-
GeoIP locations: $A1BASEDIR/etc/flow/maxmind/GeoLite2-City.mmdb
-
Devices and network interfaces: $A1BASEDIR/etc/flow/metadata/netifs.yml
Example contents:
10.0.0.1:
  1:
    ifName: lo
    ifDescr: lo
    ifAlias: lo
    ifType: 24
    ifSpeed: 10000000
    tags:
      - router_mgmt
    metadata:
      sec.zone.name: network
  3:
    internal: false
    ifName: eth0
    ifDescr: eth0
    ifAlias: internet
    ifType: 6
    ifSpeed: 1000000000
    cirIn: 200000000
    cirOut: 12000000
    tags:
      - verizon
    metadata:
      sec.zone.name: internet

10.0.0.2:
  501:
    ifName: vlan
    ifDescr: vlan
    ifSpeed: 1000000000
  502:
    ifName: ge-0/0/0
    ifDescr: ge-0/0/0
    ifSpeed: 1000000000
To enable DNS resolution, set the value of the FLOW_PROCESSOR_ENRICH_IPADDR_DNS_ENABLE configuration parameter to true in the Flow Collector microservice's helm chart. You can use either the Helmcharts microservices user interface or the a1helm install command with the --set configData flag.
See Flow Collector in Unified Assurance Implementation Guide for more information about Flow Collector configuration parameters.
Machine Learning Overview
Flow Analytics Machine Learning provides anomaly detections to automatically identify a variety of performance, availability, and security conditions.
Machine learning policies must train a model on your current datafeed. Oracle recommends a minimum of two weeks to two months of data to provide the best detection accuracy.
After a model is trained and set to run continuously, an Elasticsearch Watcher Policy catches identified anomalies and sends them to a Unified Assurance Webhook Aggregator to generate events. Multiple anomalies are sent in batches at the same time and separated into unique events in the aggregator rules.
To enable the aggregator to generate events, you must copy the latest version of the webhook include rules for Elasticsearch from the RO_LOCKED branch to your default branch.
To find the rules:
-
From the Configuration menu, select Rules.
-
Expand the Core Rules (core), Default read-only branch (RO_LOCKED), collection, event, webhook, and vendor folders to find the elastic.include.rules file.
-
Copy the file to the same path in the default read-write branch.
Machine Learning Policies
Flow Analytics includes machine learning policies with anomaly detections for the following areas:
- Network availability. See Network Availability Anomaly Detections.
- Network performance. See Network Performance Anomaly Detection.
- Network security. See Network Security Anomaly Detections.
Network Availability Anomaly Detections
Flow Analytics includes the following anomaly detections for network availability:
- Failed TCP sessions (private)
- Failed TCP sessions (public)
Network Performance Anomaly Detections
Flow Analytics includes the following anomaly detections for network performance:
-
Unusual Destination ASN Traffic Volume
-
Unusual Source ASN Traffic Volume
-
Unusual Network Interface Egress Traffic Volume
-
Unusual Network Interface Ingress Traffic Volume
Network Security Anomaly Detections
Flow Analytics includes the following types of anomaly detections for network performance:
-
Access anomalies. See Network Security Access Anomalies.
-
Activity anomalies. See Network Security Activity Anomalies.
-
Amplification attacks. See Network Security Amplification Attack Anomalies.
-
Flood attacks. See Network Security Flood Attack Anomalies.
-
Reconnaissance anomalies. See Network Security Reconnaissance Anomalies.
Network Security Access Anomalies
A Brute Force Access Attempt (CLI) anomaly indicates a potential brute force login attack. This occurs when there are a high number of failed connection attempts to remote ports, such as SSH or telnet.
Network Security Activity Anomalies
Flow Analytics detects rarely occurring network traffic, which can indicate malicious activity, such as malware exfiltration or communication with a command and control server. Although it does not always indicate malicious activity, these anomalies warrant further investigation.
The following network security activity anomalies are detected:
-
Rare Client-Side Autonomous System: Client-side traffic to or from a rare autonomous system.
-
Rare Server-Side Autonomous System: Server-side traffic to or from a rare autonomous system.
-
Rare Conversation (inbound): Rare inbound public to private conversations.
-
Rare Conversation (outbound): Rare outbound private to public conversations.
-
Rare Conversation (private): Rare private conversations.
Network Security Amplification Attack Anomalies
Flow Analytics detects reflection-based volumetric distributed denial-of-service (DDoS) attacks.
In this type of attack, an attacker sends requests to open services that act as reflectors, with the target IP address forged as the source. The reflector services send large responses to the target, resulting in amplified traffic to target servers or networks. The volume of data and traffic overwhelms the target, making the server and surrounding infrastructure unavailable.
The following amplification attacks are detected:
-
Generic DDoS Attack (UDP Amplification): An attack on open UDP services.
-
CHARGEN Amplification Attack: An attack on open Character Generator Protocol (CHARGEN) services.
-
DNS Amplification Attack: An attack on open DNS resolvers.
-
Kad Amplification Attack: An attack on open Kademlia DHT peers.
-
LDAP Amplification Attack: An attack on open LDAP servers.
-
mDNS Amplification Attack: An attack on open mDNS resolvers.
-
Memcached Amplification Attack: An attack on open Memcached servers.
-
MSSQL Amplification Attack: An attack on open MSSQL servers.
-
NETBIOS Amplification Attack: An attack on open NETBIOS services.
-
NTP Amplification Attack: An attack on open NTP services.
-
QOTD Amplification Attack: An attack on open Quote of the Day (QOTD) services.
-
Quake Amplification Attack: An attack on open Quake services.
-
RADIUS Amplification Attack: An attack on open RADIUS services.
-
RIP Amplification Attack: An attack on open Routing Information Protocol (RIP) enabled routers.
-
RPC Amplification Attack: An attack on open Remote Procedure Call (RPC) services.
-
Sentinel SPSS Amplification Attack: An attack on open SPSS (Sentinel RMS) License Manager services.
-
SNMP Amplification Attack: An attack on open SNMP services.
-
SSDP Amplification Attack: An attack on open SSDP services.
-
Steam Amplification Attack: An attack on open Steam services.
-
TFTP Amplification Attack: An attack on open Trivial File Transfer Protocol (TFTP) services.
-
WSD Amplification Attack: An attack on open Web Services for Devices (WSD) services.
Network Security Flood Attack Anomalies
Flow Analytics detects distributed and direct DOS flood attacks. In this type of attack, an attacker sends high volumes of requests directly to target servers. The volume of traffic overwhelms the target, making the server and surrounding infrastructure unavailable to legitimate traffic.
The following flood attacks are detected:
-
Generic DDoS Attack (TCP): A DDoS attack consisting of high volumes of TCP traffic from multiple sources to a TCP listener.
-
ICMP Flood DDoS Attack: A DDoS attack consisting of high volumes of ICMP echo-request packets from multiple sources.
-
ICMP Flood Direct Attack: A DoS attack consisting of high volumes of ICMP echo-request packets from a single source.
-
SYN Flood DDoS Attack: A DDoS attack consisting of high volumes of initial connection synchronization request (SYN) packets from multiple sources.
-
SYN Flood Direct Attack: A DoS attack consisting of high volumes of SYN packets from a single source.
Network Security Reconnaissance Anomalies
Flow Analytics detects reconnaissance anomalies, which can indicate an attacker gathering network information to prepare for subsequent attacks. Detecting this kind of attack can give you an early warning of potential threats before a full attack occurs.
The following reconnaissance anomalies are detected:
-
Port Scan (fast): A client sent requests to a very high number of ports, compared to other clients, in a short time period.
-
Port Scan (slow): A client sent requests to a very high number of ports, compared to other clients in a long period of time.