Understanding the Discovery Pipeline
Learn about how the discovery microservice pipeline works in Oracle Communications Unified Assurance.
About Device Discovery
Device discovery is the process of connecting Unified Assurance to the devices on your network. The term device is general, and can include physical or virtual machines, interfaces, or anything the software interacts with. After discovering devices and adding them to the database, you can leverage the full Unified Assurance monitoring capabilities, including fault management, performance management, and topology views.
Unified Assurance supports multiple ways to perform device discovery:
-
Using the guided Network Discovery UI, with microservice architecture.
See Using the Guided Network Discovery Flow in Unified Assurance Network Performance Management Reporting Guide.
-
Making REST API calls, with microservice architecture.
The REST API for Unified Assurance microservices includes legacy (v1) endpoints and v2 and Web API endpoints. See REST API for Unified Assurance Microservices and Accessing the Network Performance Management Web API in Unified Assurance Network Performance Management Reporting Guide for more information.
-
Using Service-Oriented Architecture (SOA) applications.
See Discovering Devices in Unified Assurance Implementation Guide.
Note:
To access the v1 endpoints, you must set the ENABLE_LEGACY_API_ENDPOINTS configuration parameter to true when deploying the Discovery Service microservice. It is set to false by default.
About the Discovery Microservice Pipeline
The discovery microservice pipeline consists of the following components:
-
Microservices:
-
Discovery Service
-
Aruba Central Poller
-
Cisco DNA Poller
-
Cisco Meraki Poller
-
gNMI Collector
-
Ping Poller
-
SNMP Poller
-
VMware Poller
-
DOM Processor
-
Graph Sink
-
Web API
-
-
Apache Pulsar topics, where X represents the device zone number:
-
aruba-central-poller-zoneX
-
cisco-dna-poller-zoneX
-
cisco-meraki-poller-zoneX
-
gnmi-collector-zoneX
-
ping-poller-zoneX
-
snmp-poller-zoneX
-
vmware-poller-zoneX
-
discovery-service-zoneX
-
dom-processor-zoneX
-
assure1/graph/sink
-
The pipeline adds data to the Graph database and the Assure1 database. All other pipelines related to devices rely on the discovery pipeline; without discovered devices, there is nothing to monitor for events, performance, or topology.
The following flows use the pipeline:
Device Discovery Flow
The following figure shows the discovery flow.
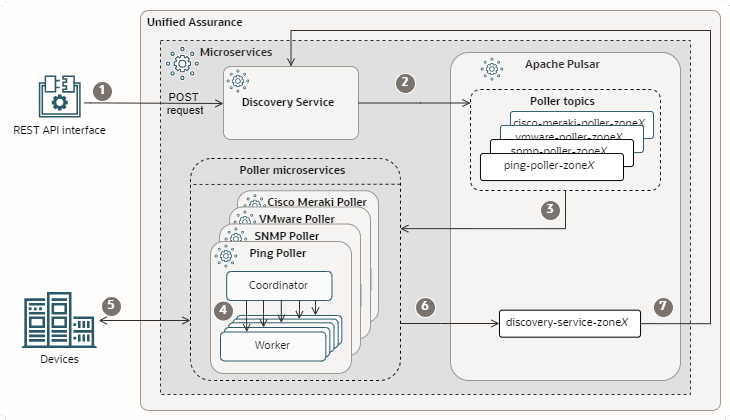
Description of microservice-discovery-flow.png
For simplicity, a subset of poller microservices and topics are grouped in the image, and single arrows represent communication between them. In the actual flow, there are separate subflows connecting separate microservices and topics for each device type. For example, for SNMP-enabled devices, the Discovery Service publishes the request to the snmp-poller-zoneX topic, to which the SNMP poller coordinator subscribes, and individual SNMP poller workers poll the devices and publish the response to the discovery-service-zoneX topic. Additional poller microservices, such as the Ping Poller, participate in the pipeline in the same way.
Note:
The Cisco Meraki Poller, the Aruba Central Poller, and the GNMI Collector do not use the worker/coordinator design. Instead, a single pod performs all tasks described for the worker and coordinator pods.
The flow is as follows:
-
Through the REST API interface on your network, submit a POST request to the Discovery Service at the Create a Discovery Job v1 or v2 REST API endpoint. The request must contain discovery configuration settings, configuration details about SNMP, ICMP, or REST configuration, and lists or ranges of IPs to perform discovery on.
The request may also need to contain the TenantID. If you have configured multiple tenants, the Discovery Service automatically determines the tenant based on the zone. However, if multiple tenants are assigned to the same zone, the tenant cannot be determined automatically, so the request must specify the appropriate TenantID.
-
The Discovery Service publishes the discovery request to the Pulsar topics for the Ping, SNMP, VMware , Aruba Central and Cisco Meraki pollers.
-
The poller coordinators for the poller microservices subscribed to the topics, read the discovery request from the topics.
-
The poller coordinators assign workers to devices.
-
The poller workers poll the devices for connection information.
-
The poller workers publish status information to the discovery service topic.
-
The Discovery Service, which is subscribed to the discovery service topic, reads the status from the topic.
Adding to Inventory Flow
After devices have been discovered, they can be added to the Unified Assurance Graph and Assure1 databases. This can be achieved using the following two flows:
Adding to Inventory Flow Using Legacy Endpoints
The following figure shows the inventory flow using legacy or v1 endpoints.
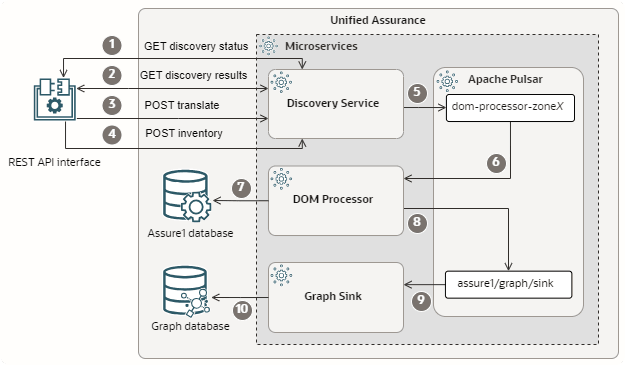
Description of microservice-inventory-flow.png
The flow is as follows:
-
Through the REST API interface on your network, you check the status of discovery jobs by submitting a GET request to the Discovery Service at the Get Discovery Status REST API endpoint.
-
For discovery jobs marked as completed in the status request response, you get the discovery results by submitting a GET request to the Discovery Service at the Get Discovery Results REST API endpoint.
-
You convert the discovery results response to the format expected for adding the devices to the inventory. You can do this automatically by sending a POST request to the Discovery Service at the Translate the Inventory Status REST API endpoint. This endpoint populates default data for expected fields, such as poll times.
You can alternatively handle this step manually, using your desired values instead of the defaults. Ensure that your payload matches the expected input format for the POST request at the Add Discovery Results to the Inventory REST API endpoint. See REST API for Unified Assurance Microservices for request details.
-
Using the discovery results to select discovered devices, you send a POST request with device inventory information to the Discovery Service at the Add Discovery Results to the Inventory REST API endpoint so that the devices can be added to the Graph and Assure1 databases further down the pipeline.
-
The Discovery Service publishes the inventory request to the Pulsar topic for the DOM Processor microservice.
-
The DOM Processor, which is subscribed to the topic, reads the inventory request.
-
The DOM Processor normalizes the device data and inserts the devices into the Assure1 database.
-
The DOM Processor publishes the normalized device data to the graph sink topic.
-
The Graph Sink microservice, which is subscribed to the topic, reads the device topology data.
-
The Graph Sink adds the device topology to the Graph database.
The devices are now monitored by the pollers at configured intervals.
Adding to Inventory Flow Using v2 Endpoints
The following figure shows the inventory flow using v2 endpoints.
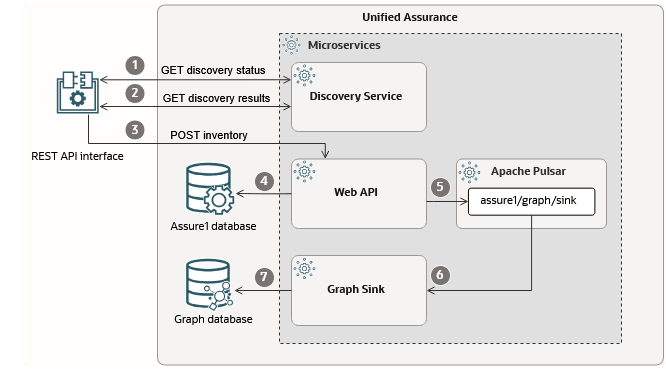
Description of microservice-inventory-flow-for-v2-endpoints.png
The flow is as follows:
-
Through the REST API interface on your network, you check the status of discovery jobs by submitting a GET request to the Discovery Service at the Get Discovery Status REST API endpoint.
-
For discovery jobs marked as completed in the status request response, you get the discovery results by submitting a GET request to the Discovery Service at the Get Discovery Results REST API endpoint.
-
Using the discovery results to select discovered devices, you send a POST request with device inventory information to the Web API microservice at Monitor Selected Devices for Legacy Flow REST API endpoint so that the devices can be added to the Graph and Assure1 databases further down the pipeline. The discovery results are then directly published to the Web API microservice through this POST request.
-
The Web API microservice normalizes the device data and inserts the devices into the Assure1 database.
-
The Web API microservice publishes the normalized device data to the graph sink topic.
-
The Graph Sink microservice, which is subscribed to the topic, reads the device topology data.
-
The Graph Sink adds the device topology to the Graph database.
The devices are now monitored by the pollers at configured intervals.
Rediscovery and Updating Inventory Flows
Rediscovery and updating the inventory are handled similarly to discovery and adding to inventory, but by calling different API endpoints.
For rediscovery, you submit a POST request at the Rediscover Devices v1 or v2 REST API endpoint depending on the inventory flow you want to leverage, containing discovery configuration settings, configuration details about SNMP, ICMP, or REST configuration, and lists or ranges of IPs to perform rediscovery on. The data flows through the pipeline in the same was as for the Device Discovery flow.
For updating the inventory, you can submit a PATCH request or a PUT request, depending on the situation, at the Add Discovery Results to the Inventory (v1) or a POST request at the Monitor Selected Devices for Legacy Flow (Web API endpoint part of the v2 flow) endpoint and the data flows through the pipeline in the same way as for the Adding to Inventory flow.
Note:
-
The Monitor Selected Devices for Legacy Flow endpoint only supports a POST request.
-
The Add Discovery Results to the Inventory endpoint only supports PUT and PATCH requests.
-
PATCH requests update only the properties included in the request. For example, you could use a PATCH request to change a device's ICMP performance polling interval.
-
PUT requests replace all of a specified device's interfaces with the new interfaces in the request.
-
POST requests replace all the existing information in the system with the information in the request.
For example, you have discovered the following devices and interfaces:
-
Device A
-
Interface A1
-
Interface A2
-
-
Device B
-
Interface B3
-
Interface B4
-
You submit a rediscovery request which reveals one of the following:
-
Interface A1 under Device A needs a property value to be updated.
To make this update in the inventory, you would use a PATCH request that specifies only that property under Interface A1 and Device A.
-
Device A has added interface A5, while Device B's interfaces remain unchanged.
To make this update in the inventory, you would use a PUT request that includes Device A with Interface A1, Interface A2, and Interface A5. You would not include Device B, because there are no changes to its list of interfaces. The list of interfaces under Device A would replace the existing list for Device A.
Because the PUT request replaces all items in the interfaces list, even if nothing about interface A1 and interface A2 has changed, you must specify them in the request, or they will be removed from Device A.
While processing the request, the current list of interfaces under Device A in the Graph database is compared to the list provided in the request. Interfaces that appear in the request but not in the database are added to the database. Interfaces that appear in the database but not in the request are removed from the database.
About Pipeline Components
This section provides details for the various pipeline components mentioned in the flows. Some components, like the pollers and the Graph Sink microservice, are also used by other pipelines.
REST API Endpoints
The REST API endpoints are your interface with the Discovery Service, where you send all requests to start the pipeline flows.
There are endpoints for creating discovery jobs, getting status of all or specific jobs, getting results for all or specific jobs, adding to and updating the inventory, translating inventory data to create defaults, and creating rediscovery jobs.
You are responsible for configuring the connections and requests from your network to the REST API, including determining when to check status and make inventory requests, and ensuring that the requests are in the expected format with all the required information.
For details about the REST API, including all available endpoints and expected request and response formats, see REST API for Unified Assurance Microservices and Accessing the Network Performance Management Web API in Unified Assurance Network Performance Management Reporting Guide.
Discovery Service Microservice
The Discovery Service microservice is the main component of all flows in the device discovery pipeline. It is responsible for managing device discovery by:
-
Accepting external requests through the discovery REST API for discovery, rediscovery, and inventory tasks.
-
Sending the request data to the appropriate microservices within Unified Assurance through Pulsar topics.
-
Reading the responses from the microservices through Pulsar topics.
-
Providing updates to external networks when requested.
It subscribes to the discovery-service-zoneX Pulsar topic where the pollers publish discovery status, and publishes to the ping-poller-zoneX, snmp-poller-zoneX, vmware-poller-zoneX, and dom-processor-zoneX topics.
Poller Microservices
As part of the Device Discovery and Rediscovery flows of the discovery microservice pipeline, the poller microservices are responsible for establishing the initial connection with devices and polling them at regular intervals for availability. The SNMP, Ping, and VMware pollers use a worker-coordinator design to balance workloads and allow for scaling. The coordinators control the workload, schedules, and balancing for the workers and can integrate with other microservices through Pulsar topics. The workers perform discovery and status polling tasks and send results back to the coordinator and to specified locations, such as Pulsar topics.
Load balancing and scaling are managed with Kubernetes Event-Driven Autoscaling (KEDA). See Configuring Autoscaling in Unified Assurance Implementation Guide for more information.
The poller microservices subscribe to the following Pulsar topics, where the Discovery Service publishes discovery request data:
-
aruba-central-poller-zoneX
-
cisco-dna-poller-zoneX
-
cisco-meraki-poller-zoneX
-
gnmi-collector-zoneX
-
ping-poller-zoneX
-
snmp-poller-zoneX
-
vmware-poller-zoneX
The poller microservices publish to the discovery-service-zoneX topic.
Other microservices also use these pollers. For example, as part of the event microservice pipeline, the pollers publish device availability updates to the assure1/discovery/rca topic. This topic is read by the Root Cause Analysis Availability Engine microservice, which analyzes outage events to determine their root cause. For more information about root cause analysis, see Understanding Root Cause Analysis and RCA Availability Engine in Unified Assurance Implementation Guide.
How Poller Workers are Assigned
Poller coordinators assign poller workers to either discovery tasks or polling tasks. By default, there are a minimum of two poller workers, with one assigned to discovery and one assigned to polling.
Autoscaling adjusts the total number of polling workers automatically according to the current polling worker throughput. You can set which percentage of polling workers are assigned to discovery tasks using the DISCOVERY_WORKERS_PERCENTAGE configuration parameter for the poller coordinators, and adjust this setting as needed. For example:
-
Set the discovery worker percent to a high number to speed up discovery.
-
During provisioning, set it to 100 to stop polling and dedicate all workers to discovery.
-
Set it to 0 to stop discovery and dedicate all workers to polling.
Generally, when calculating the number of discovery workers based on the percentage, numbers after the decimal place in the result are ignored. However, unless you set the percent to 0 or 100, there will always be at least one of each type of worker. For example, if you set the percent to 10%:
-
For 30 workers, the calculation is 30 x 0.1 = 3, resulting in 3 discovery workers and 27 polling workers.
-
For 25 workers, the calculation is 25 x 0.1 = 2.5. The .5 is ignored, resulting in 2 discovery workers and 23 polling workers.
-
For 8 workers, the calculation is 8 x 0.1 = 0.8. Ordinarily the .8 would be ignored, resulting in no discovery workers. But because the percent is not set to 0, the result is 1 discovery worker and 7 polling workers.
Note:
Autoscaling is decided based on polling worker throughput, not discovery worker throughput. If you are increasing discovery workers for provisioning and want to increase discovery throughput, you can temporarily disable autoscaling and manually increase the minimum and maximum replica counts in the microservices where you need increased throughput. See Configuring Autoscaling in Unified Assurance Implementation Guide for information about setting the replica counts and disabling autoscaling for microservices.
See the discussion of the following pollers for details about the discovery worker percentage configuration parameter:
DOM Processor Microservice
As part of the Adding to Inventory and Updating Inventory flows in the discovery microservice pipeline using legacy or v1 endpoints, the DOM Processor microservice is responsible for:
-
Taking discovery results, converting them to the normalized Unified Assurance format, and inserting them into the Assure1 database. It ensures that devices discovered using the microservices pipeline contain all the required data and are identical to those discovered using the user interface configurations.
-
Publishing normalized device data to the assure1/graph/sink Pulsar topic, where the Graph Sink microservice is listening.
It subscribes to the dom-processor-zoneX Pulsar topic where the Discovery Service publishes device data.
Web API Microservice
As part of the Adding to Inventory and Updating Inventory flows in the discovery microservice pipeline using v2 endpoints, the Web API microservice is responsible for:
-
Taking discovery results, converting them to the normalized Unified Assurance format, and inserting them into the Assure1 database. It ensures that devices discovered using the microservices pipeline contain all the required data and are identical to those discovered using the user interface configurations.
-
Publishing normalized device data to the assure1/graph/sink Pulsar topic, where the Graph Sink microservice is listening.
It receives discovery results through a POST REST API call from the Discovery Service.
Graph Sink Microservice
As part of the discovery microservice pipeline, the Graph Sink microservice is responsible for adding discovered devices to the Graph database and updating them when they are rediscovered. It subscribes to the assure1/graph/sink Pulsar topic where the DOM Processor microservice publishes device topology data.
It is part of the Adding to Inventory Flow and the Rediscovery and Updating to Inventory Flows.
Related Topics
For more information about installing and configuring the microservices in this pipeline, see the following topics in Unified Assurance Implementation Guide:
For information about the discovery REST API, see REST API for Unified Assurance Microservices and Accessing the Network Performance Management Web API in Unified Assurance Network Performance Management Reporting Guide.
For information about setting up device discovery using the UI, see Using the Guided Network Discovery Flow in Unified Assurance Network Performance Management Reporting Guide or Discovering Devices in Unified Assurance Implementation Guide.