About Network Performance Management
Learn about Oracle Communications Unified Assurance Network Performance Management (NPM) reporting, including its purpose, key features, intended audience, architecture layers, available report packs, and multitenancy concepts.
NPM Overview
NPM offers an integrated, service-centric approach to monitoring network performance and availability. This solution consolidates data, letting you correlate network behavior with business service delivery, improving visibility, responsiveness, and strategic decision-making. NPM includes report packs with dashboards designed to meet the needs of distinct user roles within your organization. Each report pack delivers targeted insights that support operational efficiency, service quality, and business alignment.
NPM provides an end-to-end framework that includes microservices, UIs, and APIs, including:
-
A guided UI workflow to set up device discovery
-
Microservice pipelines to collect metric data and monitor devices for threshold breaches
-
Dynamic dashboards to visualize and analyze the data in real time at many levels of granularity
-
Scheduled reports based on the dashboards
By combining real-time analytics with scheduled reporting, NPM enables both proactive management and long-term performance evaluation.
NPM enables a range of enterprise users:
-
Executives and business managers who need to assess network reliability and its impact on service delivery.
-
Network operations teams who need to monitor and resolve issues through immediate access to live data.
-
Network engineering teams who need to identify recurring performance bottlenecks and guide infrastructure optimization.
By connecting network metrics to business objectives, NPM delivers measurable improvements in service quality, uptime, and resource utilization. Is supports faster decision-making, reduced operational risk, and greater alignment between IT and business strategy.
Architecture
The following figure illustrates how the network performance management components are distributed across all levels of the Unified Assurance architecture.
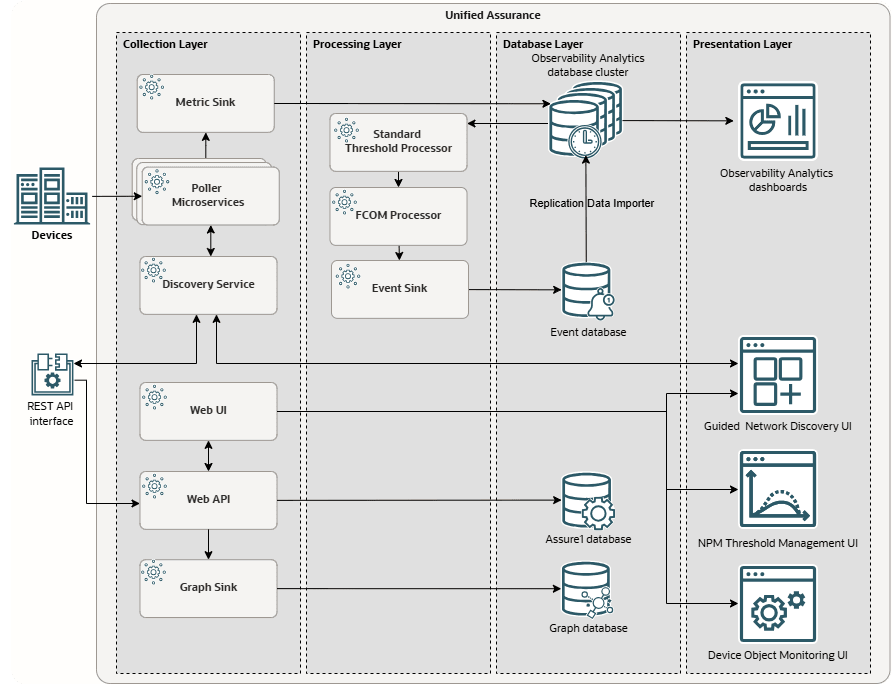
Description of npm-architecture.png
The major components are as follows:
-
Collection layer:
-
Discovery Pipeline: Microservices responsible for discovering devices and inserting them into the Assure1 and Graph databases.
See Understanding the Discovery Pipeline in Unified Assurance Concepts for more information about the pipeline flow and the microservices that make it up.
-
Metric Pipeline: Microservices responsible for collecting metrics from devices and inserting them into the Observability Analytics database
See Understanding the Metric Pipeline in Unified Assurance Concepts for more information about the pipeline flow and the microservices that make it up.
You can enable autoscaling for the microservice collectors to dynamically add more worker nodes as workloads increase, scaling up to a high level.
-
-
Processing layer:
-
Event Pipeline: Microservices responsible for reading metrics from the Observability Analytics database, evaluating them against thresholds, generating events for threshold breaches, normalizing the events, and inserting them into the Event database
See Understanding the Event Pipeline in Unified Assurance Concepts for more information about the pipeline flow and the microservices that make it up.
-
-
Database layer:
-
The Observability Analytics database, where metrics are stored.
You deploy a cluster of Observability Analytics database nodes, which you can scale up as needed by adding more nodes, and monitor across your entire operation from dashboards on a single presentation server. The cluster can house data from multiple tenants, and you can configure multitenancy permissions to isolate visibility for each tenant.
-
The Event database, where events generated from metrics that breach thresholds are stored. These events are also synchronized to the Observability Analytics database.
-
The Assure1 database, where information about discovered devices is stored
-
The Graph database, where topology information about discovered devices is stored
-
-
Presentation layer:
-
NPM dashboards to display metric data in real time and generate reports
-
NPM UIs to set up discovery, thresholds, and threshold mapping
-
Note:
The presentation layer also displays data from the Event and Graph databases in the traditional Unified Assurance event list and dashboards, as well as the Observability Analytics dashboards for events, though this is not shown in the figure. The primary NPM presentation components are the Observability Analytics dashboards delivered in report packs and the NPM UIs.
For information about how to set up the various components, see Enabling Network Performance Management and Reporting.
About the Report Packs and Dashboards
The NPM dashboards are delivered in licensed report packs, which are available in the separate Unified Assurance reporting package. Each report pack provides a variety of dashboards for specific purposes:
-
The Wireline Network Infrastructure report pack contains dashboards that give you insight into your network reliability and resolve issues through immediate access to live data. See About the Engineering Dashboards and About the Operations Dashboards for lists of the dashboards included, and links to the complete documentation for each dashboard.
-
The SDWAN report pack contains dashboards that give you insight into your SD-WAN infrastructure and quickly understand the inventory, health, and performance of SD-WAN devices and underlying WAN connectivity. See About the SDWAN Dashboards for lists of the dashboards included, and links to the complete documentation for each dashboard.
The dashboards are updated in real time. You can customize time ranges and filters, and drill down from network-wide views to specific devices and interfaces to understand all levels of granularity in your network.
You can also use the default dashboards to create your own dashboards, customized for the needs of your organization. See Creating Custom Dashboards.
About Reports
While dashboards provide a real-time view of the network, you can also generate reports based on the dashboards to get point-in-time references that you can include in presentations, emails, start-of-shift information, and use to evaluate overall performance over time. You can generate on-demand reports, or schedule regular reports using the Unified Assurance Reports UI.
See Scheduling NPM Reports for information about how to set up and schedule reports.
About Multitenancy
Multitenancy for NPM differs from traditional Unified Assurance multitenancy. In traditional multitenancy, you use restrictive properties on user groups to control which devices, events, and diagrams users can access.
For NPM, all metrics are stored in the same Observability Analytics database, and you configure advanced multitenancy to keep tenant data appropriately isolated. Instead of using restrictive properties, you set up tenant-specific user groups and device zones, then assign them to tenants using the Tenants UI. When you discover devices using the Guided Discovery UIs, you select the tenant-specific device zone to add the devices to. Finally, when a user accesses the NPM dashboards, they only see the devices that the pollers have tagged with their tenancy.
Network Performance Management Reporting Guide
G49449-02
Copyright © 2026, Oracle and/or its affiliates.