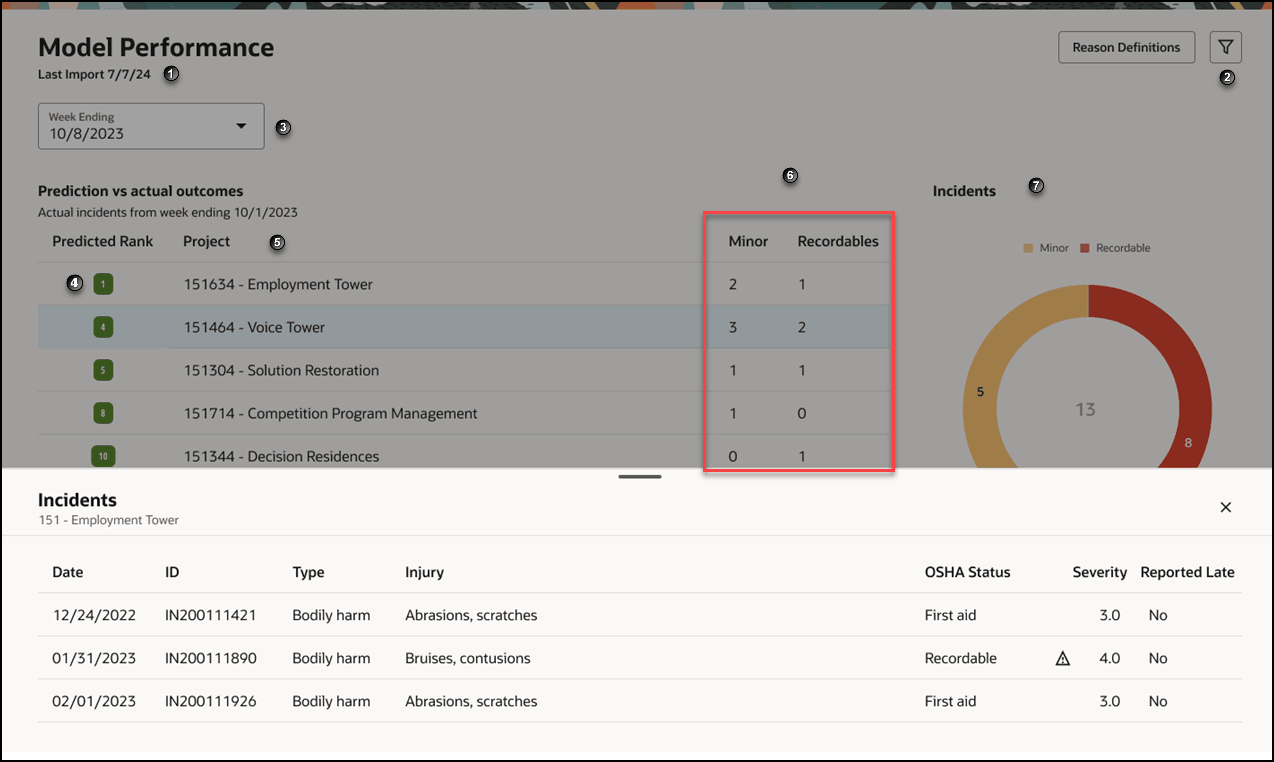
Model Performance
Use the Model Performance dashboard to assess if the risk models are accurately predicting incidents across projects.
You can use this dashboard to:
- Compare the risk predictions with the actual outcomes.
- View the types of incidents that were reported for a selected project and the rank of that project assigned by the model.
- Review if the recommended actions are helping to mitigate the risks.

The following screen elements are displayed on the Model Performance dashboard:
| Screen Elements | Description |
|---|---|
| 1 | Displays the day the data was last imported. |
| 2 | Filter button. Select to filter the projects list. |
| 3 | Week Ending drop-down. Select the week ending date you want to review. |
| 4 | The predicted rank for the project. |
| 5 | The name of the project. Click on the project name to open the Incidents panel. |
| 6 | Number of minor and recordable incidents reported for the project in the selected week ending. |
| 7 | Incident chart. Display the total number of minor and recordable incidents for all projects in a donut chart. The total number of incidents is displayed in the center. |
| Incidents panel |
Incidents panel. Select a project to display the Incidents panel. It displays all incidents reported for the project. The following details are displayed:
|
| Reason Definitions button |
Reason Definitions button. A dialog box displays the actionable and foundational reasons or features that the model uses to make predictions. Actionable reasons - Lists the features selected by the model as significant which can be acted on by the project team. The corrective course of action is also displayed. Foundation reasons - Lists the features selected by the model as significant but does not have any corrective course of action as these reasons cannot be acted on by the project team. |
| Weekly Risk Summary, Weekly Project Risk, Risk Report Card, and Model Performance tabs. | Tabs to navigate to the Weekly Risk Summary, Weekly Project Risk, Risk Report Card, and Model Performance pages are displayed at the bottom of the page. |
How to use the dashboard
- From the Week Ending drop-down list, select a week.
- Review the projected risk rank for all projects that have at least one minor or recordable incident. If all or most of your projects are in green, then the model is performing well. If most or all the project ranks are yellow, orange or red, it indicates that model did perform well for the selected week and may need to be retrained.
- Review the donut chart representing the total number of incidents (minor and recordable).
- Select a project to view the incident pane. Review the details of each incident from the pane.
- Select the chart to filter the incident table.