Risk Level vs Incident History
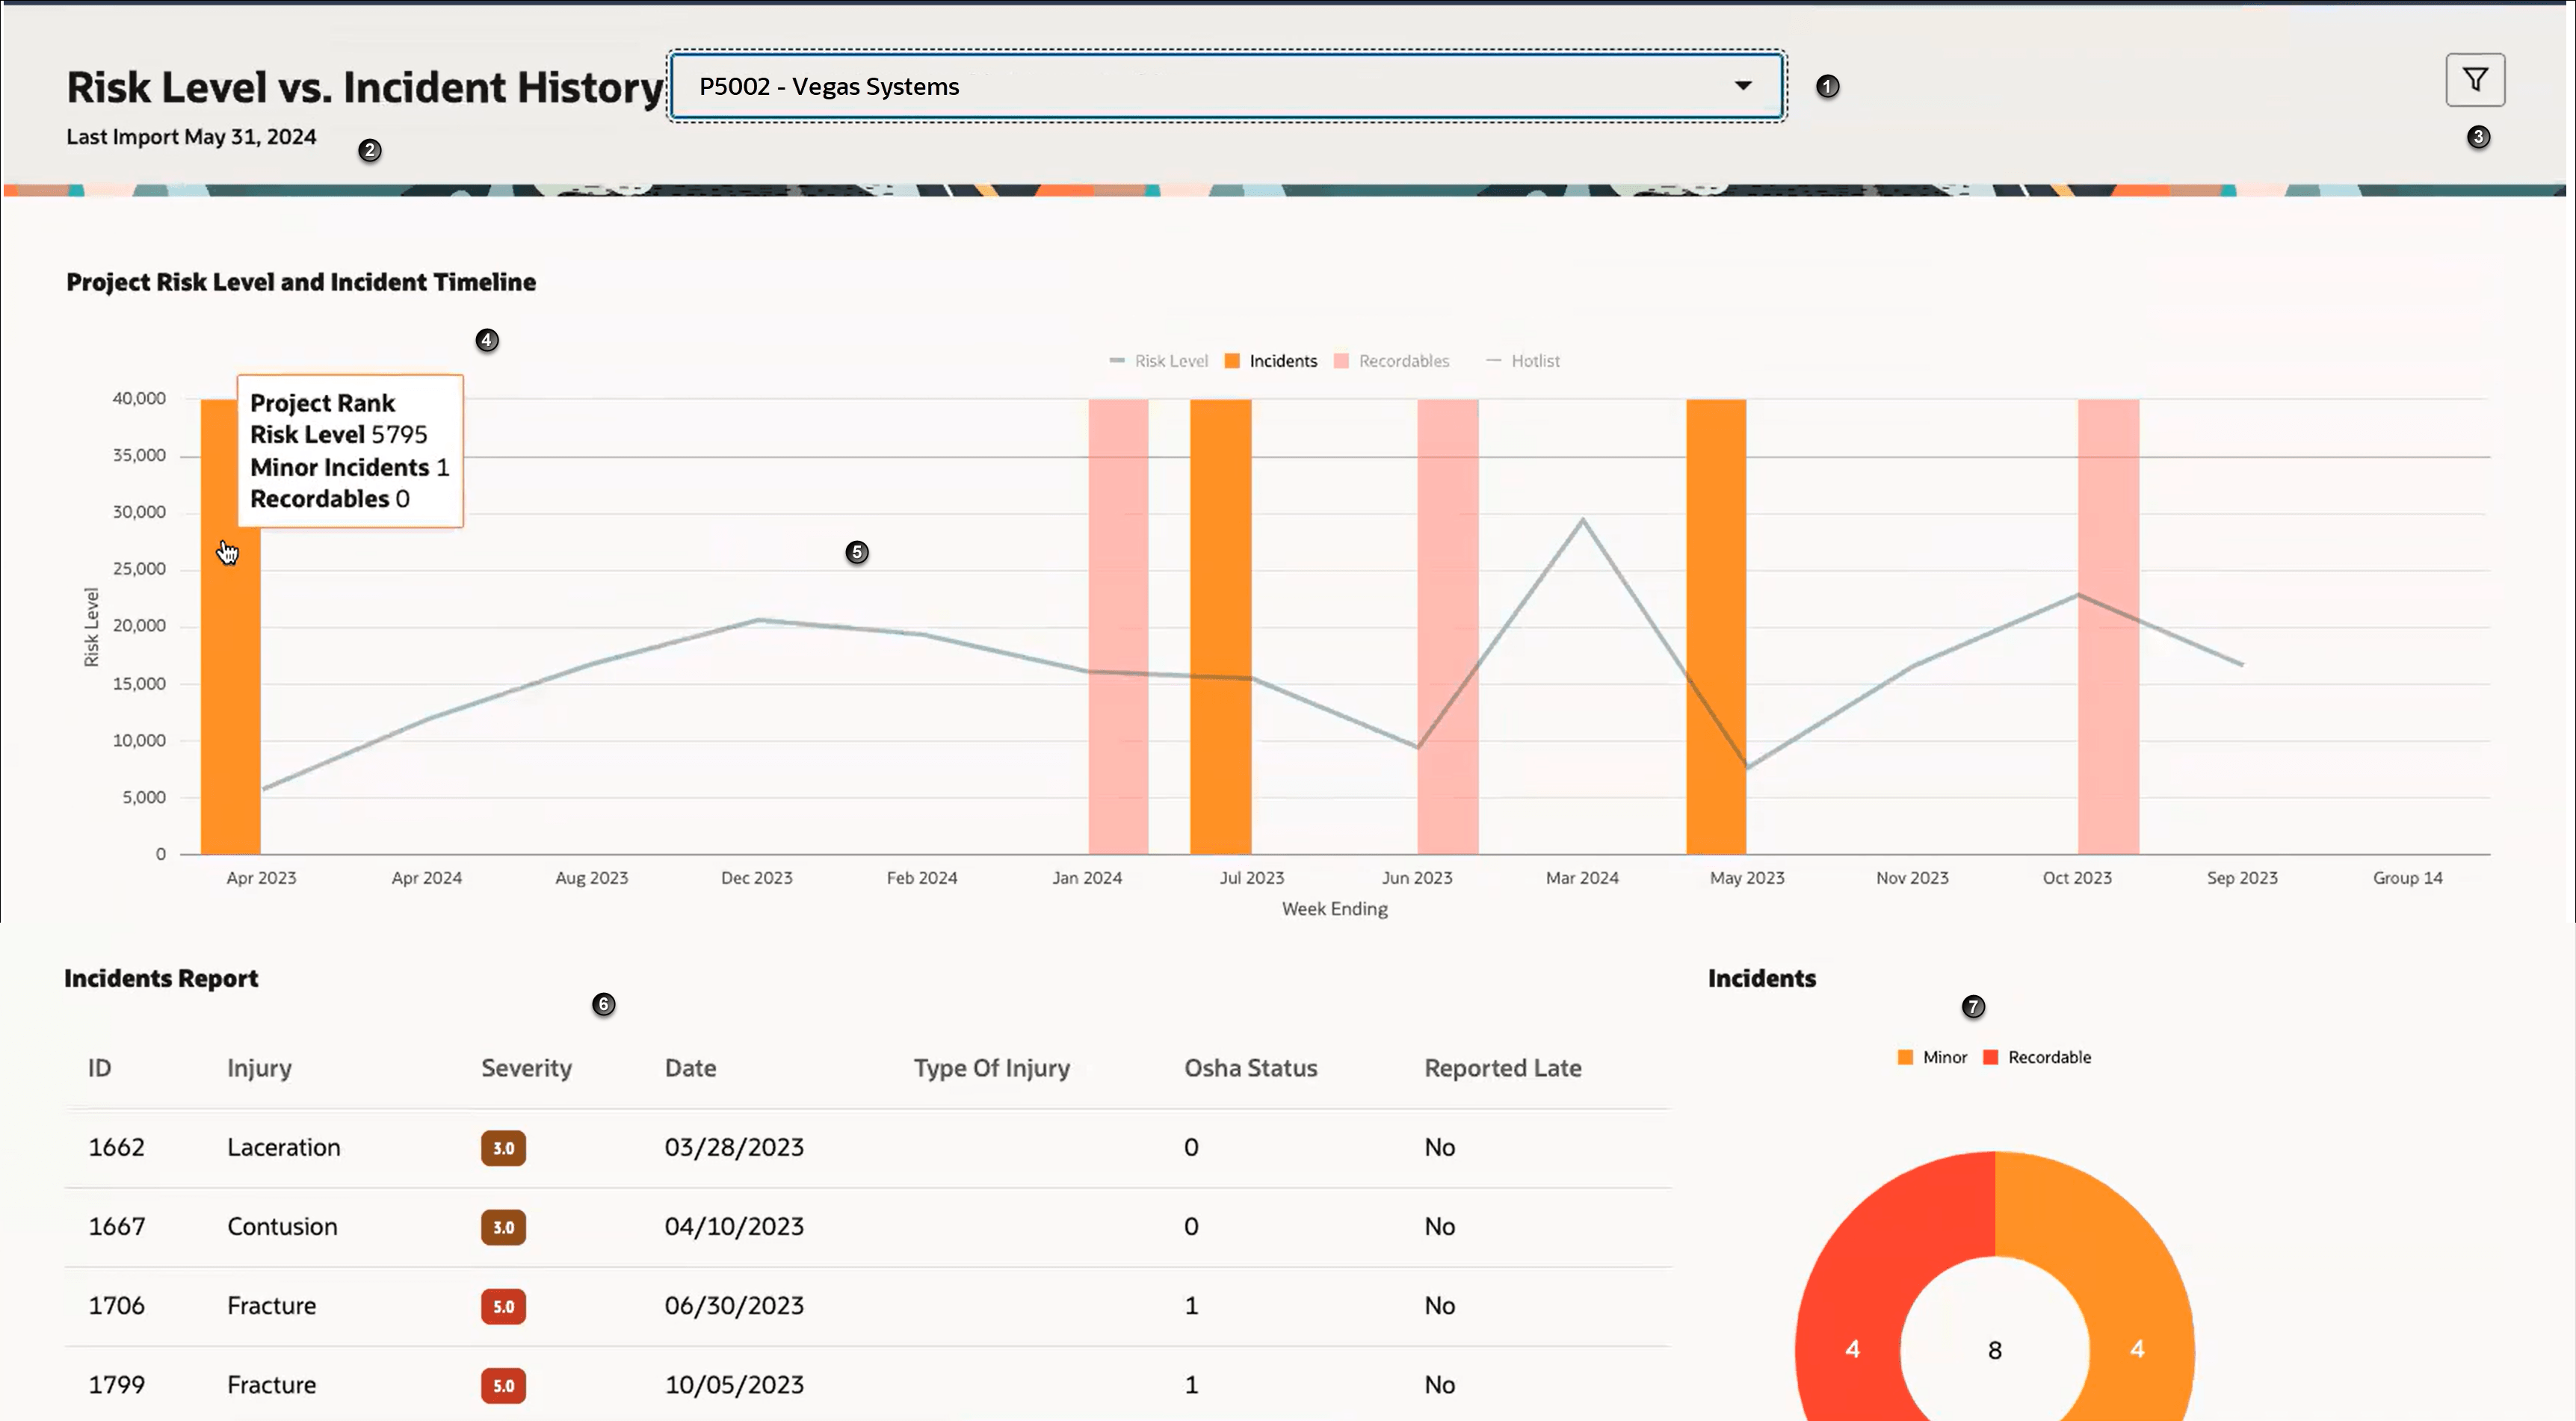
Use the Risk Level vs Incident History dashboard to view if the safety risks associated with your project were reduced compared to the previous weeks.
You can use this dashboard to:
- Track the risk level of a project over the duration of the project.
- Track the incidents reported on the selected project.
- Track if a project has made progress in reducing safety risks.

The following screen elements are displayed on the Risk Level vs Incident History dashboard:
| Screen Elements | Description |
|---|---|
| 1 | Project drop-down list. Displays the name of the project. Select the drop-down list to select a project. Only the projects you have access to are displayed. |
| 2 | Displays the day the data was last imported. |
| 3 | Filter button. Select to filter the projects list. |
| 4 | Incidents line chart. If an incident (minor or recordable) was reported for a week, a line chart is plotted to display the incident. A red line is displayed for recordables, and a yellow line is used to denote minor incidents. If a week has both minor and recordables, the line is displayed only in red. Click on an incident line on the graph to filter the table and the incident chart to only display incidents that are applicable to the selected week ending. |
| 5 | Project Risk Level and Incident Timeline graph. Interactive graph displays the risks levels along with the week endings. Risk level is a value between 1 and 100 expressed in percent. It reflects the percentage of projects that are ranked lower than the selected project. The higher the value of risk level, the higher the risk of the project have an incident. |
| 6 |
Incidents Report table. Display all the incidents for the project in increasing order of date. When the incident line is selected from Incident Line chart, the data is filtered to show the incidents for the selected week ending. The following details are displayed (if available):
|
| 7 | Incident chart: Displays a count of minor and recordable incidents. Click on the chart to filter the table to show incidents of the selected type (Minor or Recordables). |
| Weekly Risk Summary, Weekly Project Risk, Risk Report Card, Risk Level vs Incident History, and Model Performance tabs. | Tabs to navigate to the Weekly Risk Summary, Weekly Project Risk, Risk Report Card, Risk Level vs Incident History, and Model Performance pages. |
How to use the dashboard
- From the Project drop-down list, select a project.
- Review the Project Risk Level and Incident Timeline graph to see how many risks and incidents were reported on your project.
- Select the Incident line chart or the Incident chart to review the types of incidents that were reported.