Risk Report Card
Use the Risk Report Card dashboard to view if the safety risk metrics on projects have changed compared to the previous week.
You can use this dashboard to:
- Review the risk mitigation actions for the selected week and prior weeks.
- Compare how well a project performed at following and implementing the recommendations.
- View a project's risk ranking for a selected week and compare it with the prior week's ranking.

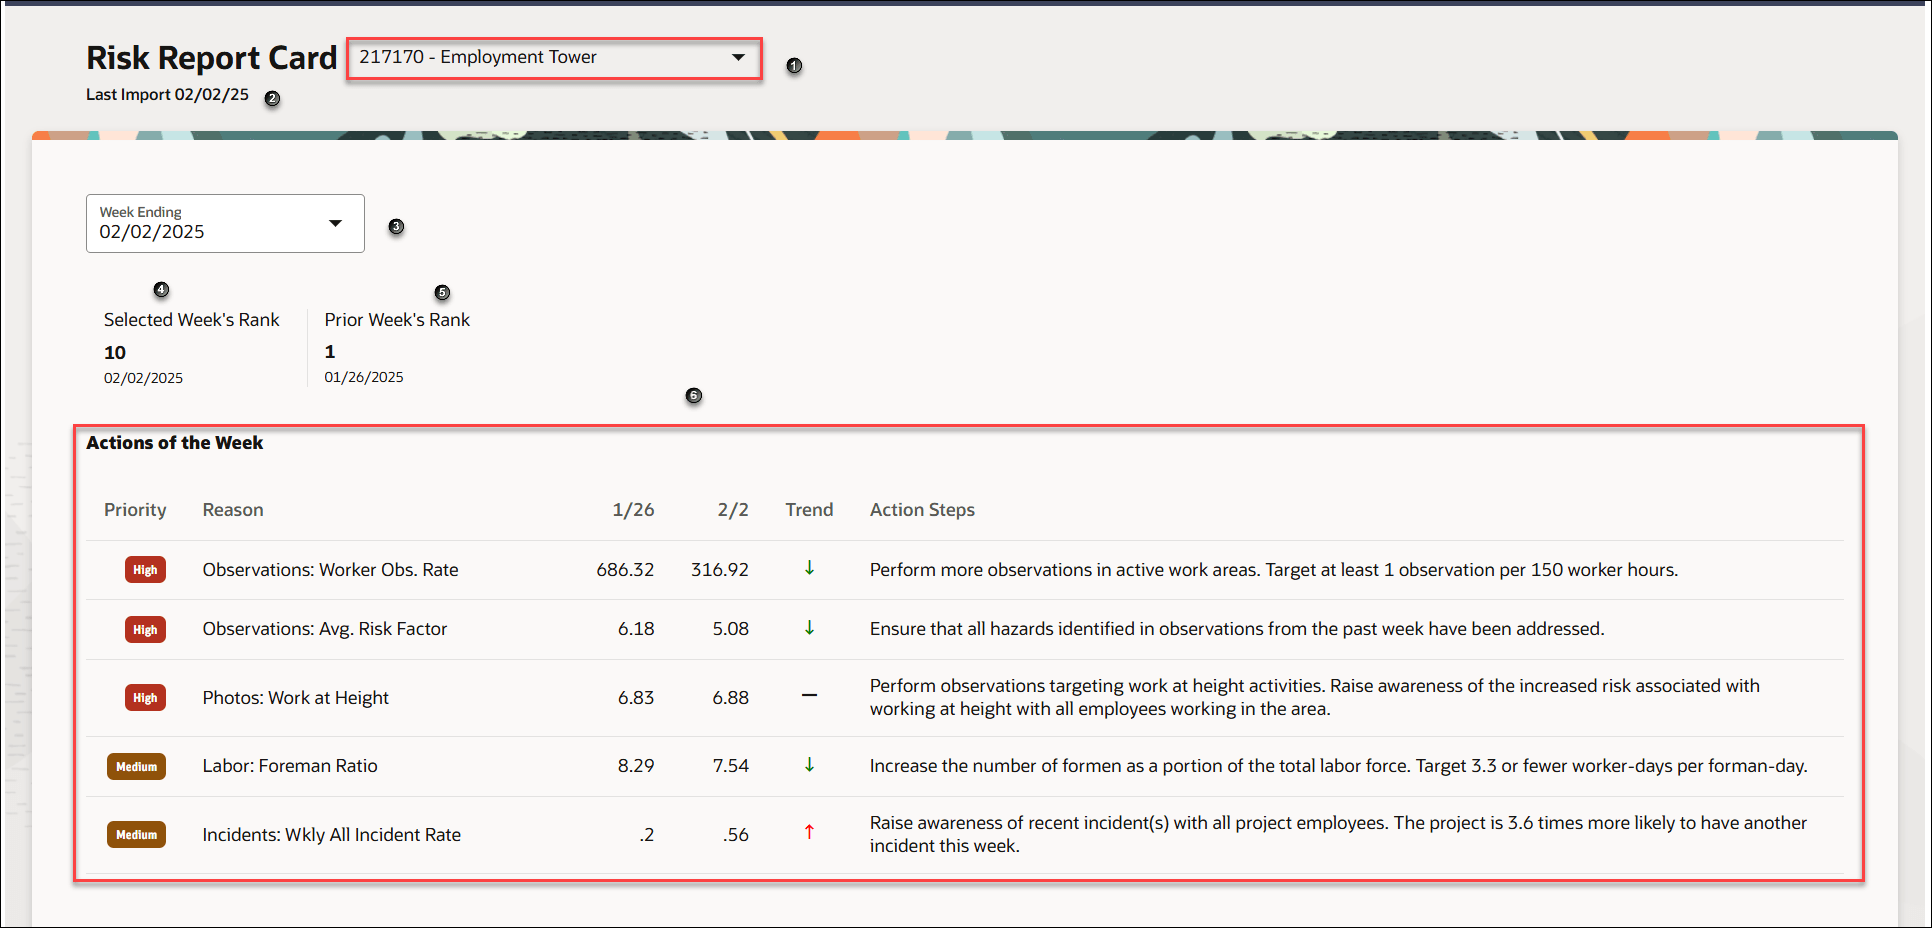
The following screen elements are displayed on the Risk Report Card dashboard:
| Screen Elements | Description |
|---|---|
| 1 | Project drop-down list. Select the drop-down list to select a project. |
| 2 | Displays the day the data was last imported. The risk rank is from the predictions made prior to the week ending date specified. |
| 3 | Week Ending drop-down list. Select the week ending you want to review. |
| 4 | Selected Week's Rank. Displays the rank of the selected project, the change in rank from the previous week, a red or green arrow indicating if the risks have increased or decreased, and the date of the selected week ending. |
| 5 | Prior Week's Rank. Displays the rank of the selected project for the week prior to the selected week ending, and the week ending date. |
| 6 | Actions of the Week. Displays the priority (High, Medium, or Low), the risk trend (Up or Down arrow), and the recommended actions to mitigate the risks. |
| Weekly Risk Summary, Weekly Project Risk, Risk Report Card, and Model Performance tabs. | Tabs to navigate to the Weekly Risk Summary, Weekly Project Risk, Risk Report Card, and Model Performance pages. |
How to use the dashboard
- From the Project drop-down list, select your project.
- From the Week Ending drop-down list, select a week ending date.
- Review the risk rank for the selected week and the prior week. Note if there was an improvement in the ranking.
- Monitor if the project risk drivers are trending in the right direction.
- Review the priorities and actions that were recommended for the selected week ending.