Weekly Project Risk
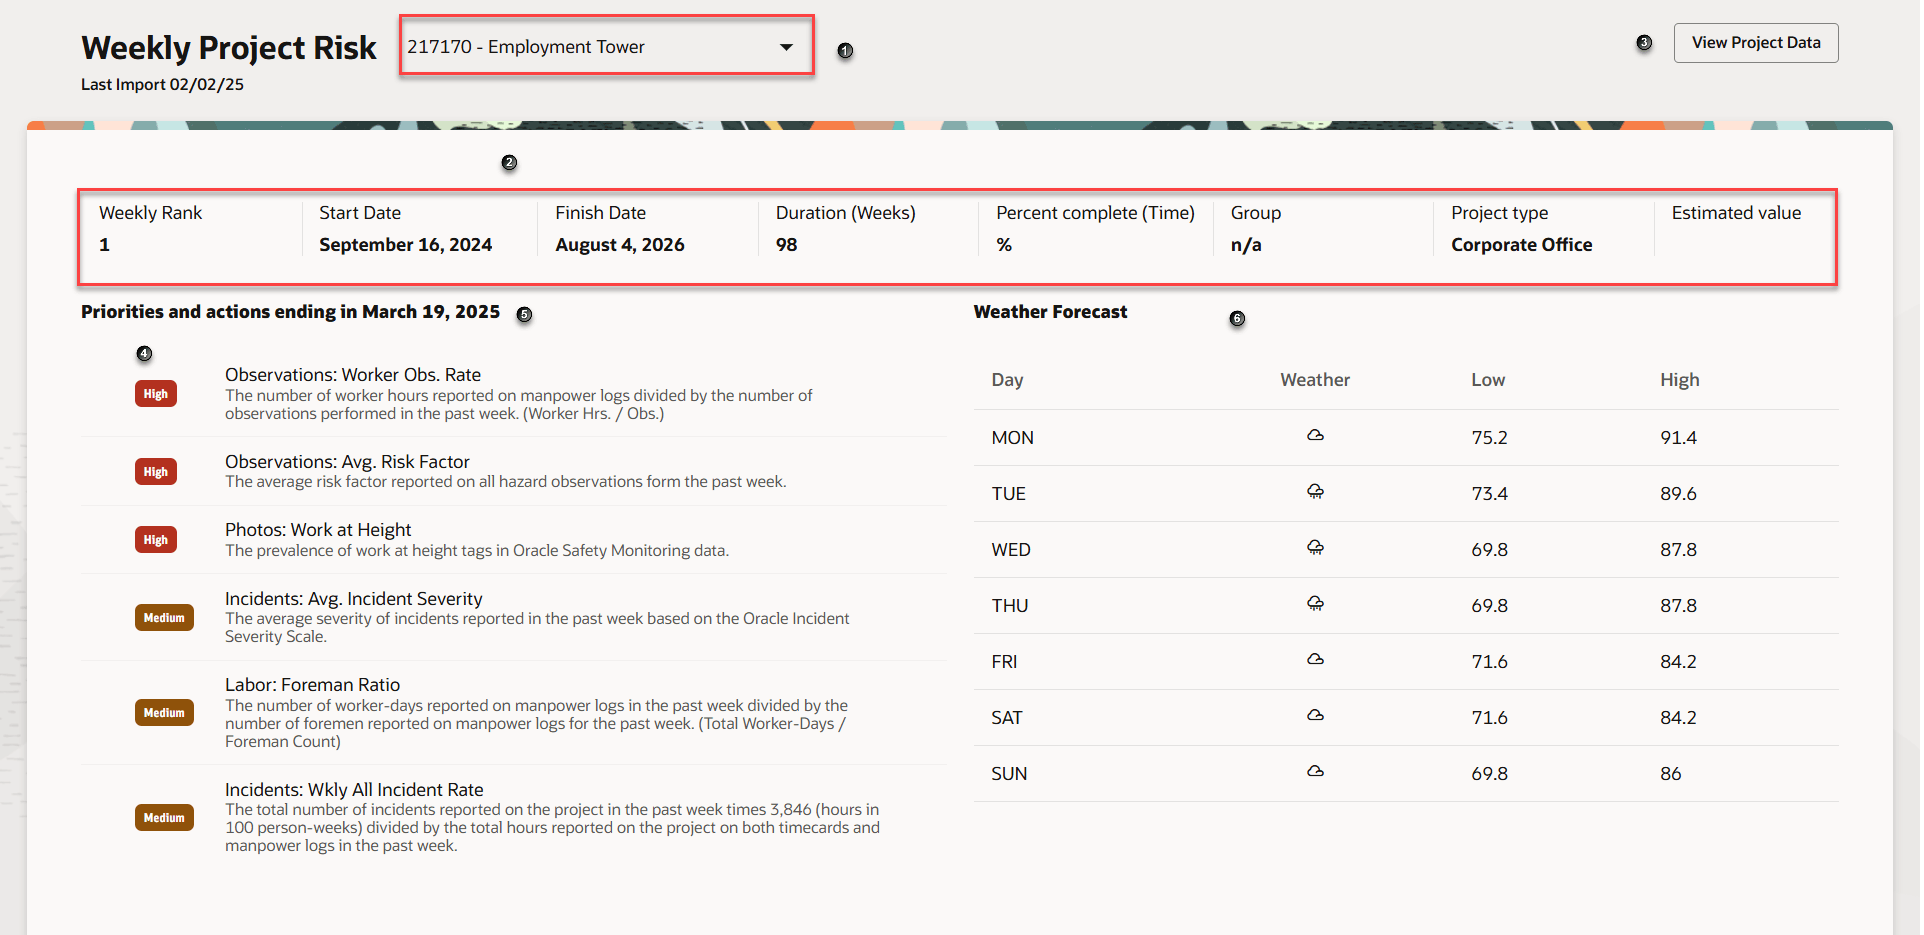
Use the Weekly Project Risk Summary dashboard to view the risk predictions for a single project.
You can use this dashboard to:
- View risk predictions for one project at a time.
- View the risk ranking.
- Review your project priorities and the actions you can take to mitigate potential safety risks.
- View project details, and the weather forecast for the week.
- View the data that was used to display the risk predictions.

The following screen elements are displayed on the Weekly Project Risk dashboard:
| Screen Elements | Description |
|---|---|
| 1 |
Project drop-down list. Select the drop-down list to select a project. Note: Some users may only have access to a single project. |
| 2 |
Project information and weekly rank. The following project information is displayed:
|
| 3 |
View Project Data button. Select to view the data used to generate the dashboard. The following metrics is displayed in the dialog box:
|
| 4 | Displays the priority of the actions to take. |
| 5 | Feature priority and actions for the week ending. |
| 6 | Displays the weather forecast of the current week |
| Weekly Risk Summary, Weekly Project Risk, Risk Report Card, and Model Performance tabs. | Tabs to navigate to the Weekly Risk Summary, Weekly Project Risk, Risk Report Card, and Model Performance pages. |
How to use the dashboard
- From the Project drop-down list, select a project.
- Review the project details and the weekly rank.
- View the priorities and actions that must be taken on the selected project.
- Hover over the Tool Tip icon to view a description of the metrics.
- View the metrics detail that was used to generate the risk predictions. Click the View Data button.