Review Crop Production Data
Open the Crop Production Panel
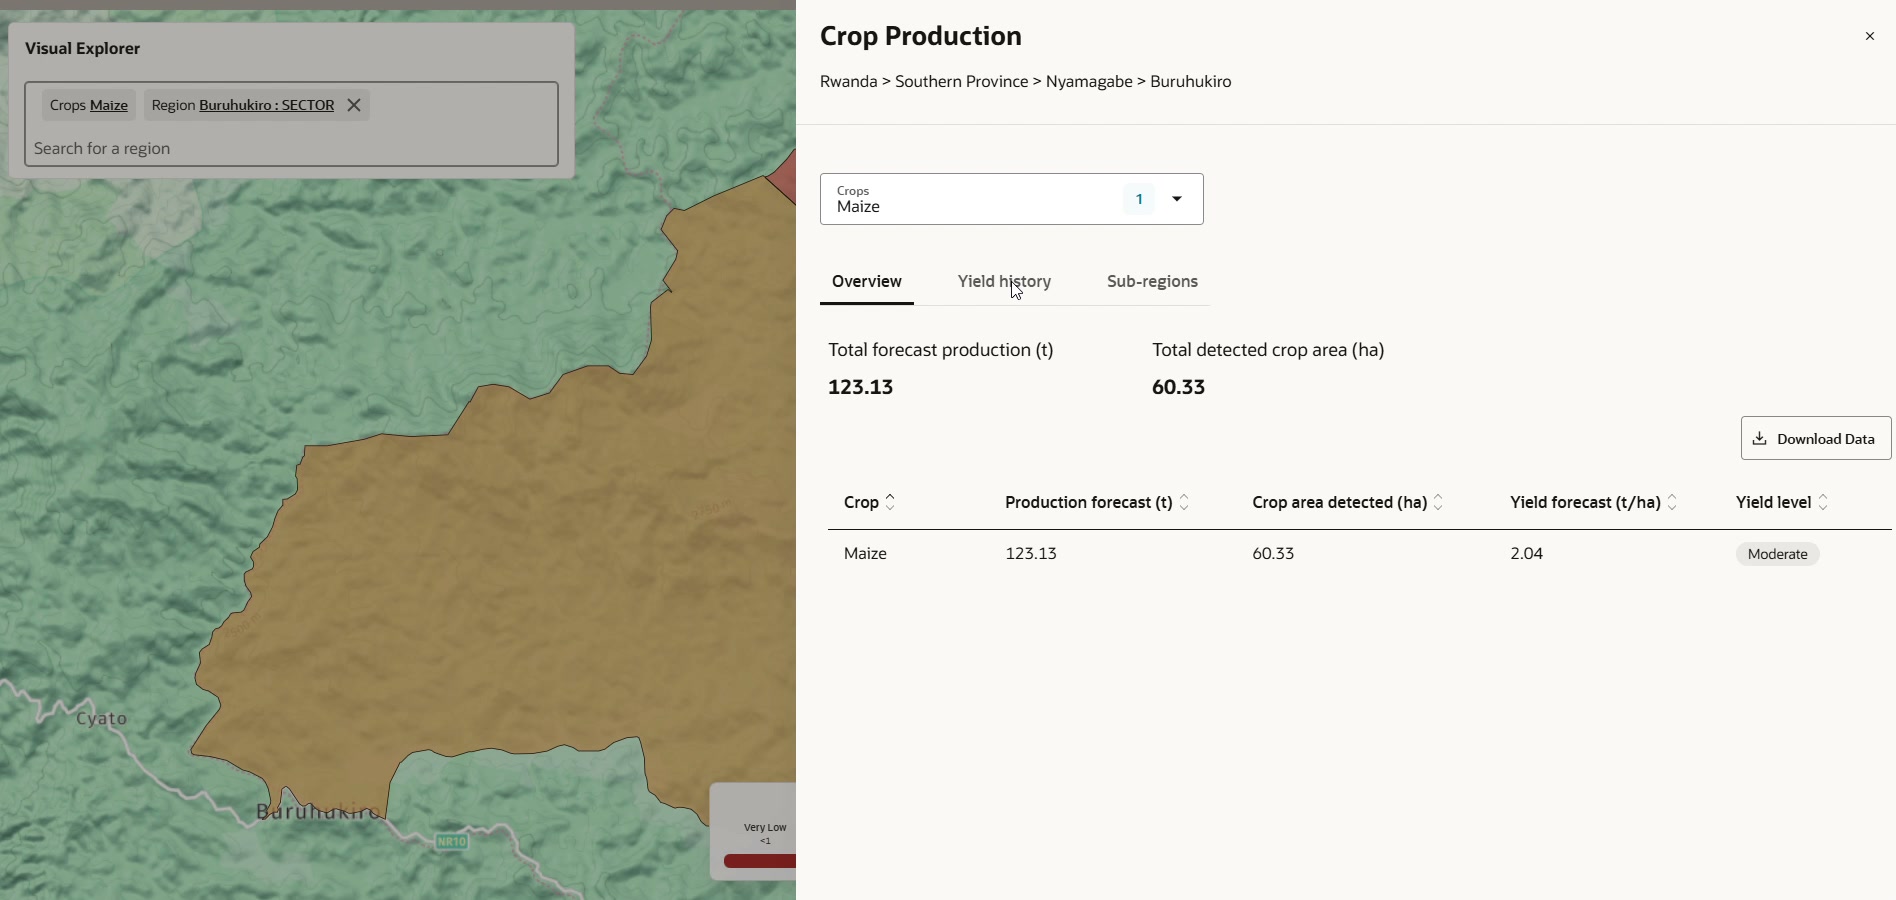
Select a region on the Crop Production map to open the data panel. The panel keeps your map context while providing regional production information.
Depending on the selected context, the Overview view presents:
- total forecast production;
- total detected crop area;
- crop production forecast;
- crop area detected;
- yield forecast; and
- yield category.
Values are based on the currently selected region, crop, and available dataset.
Review Historical and Sub-Region Data
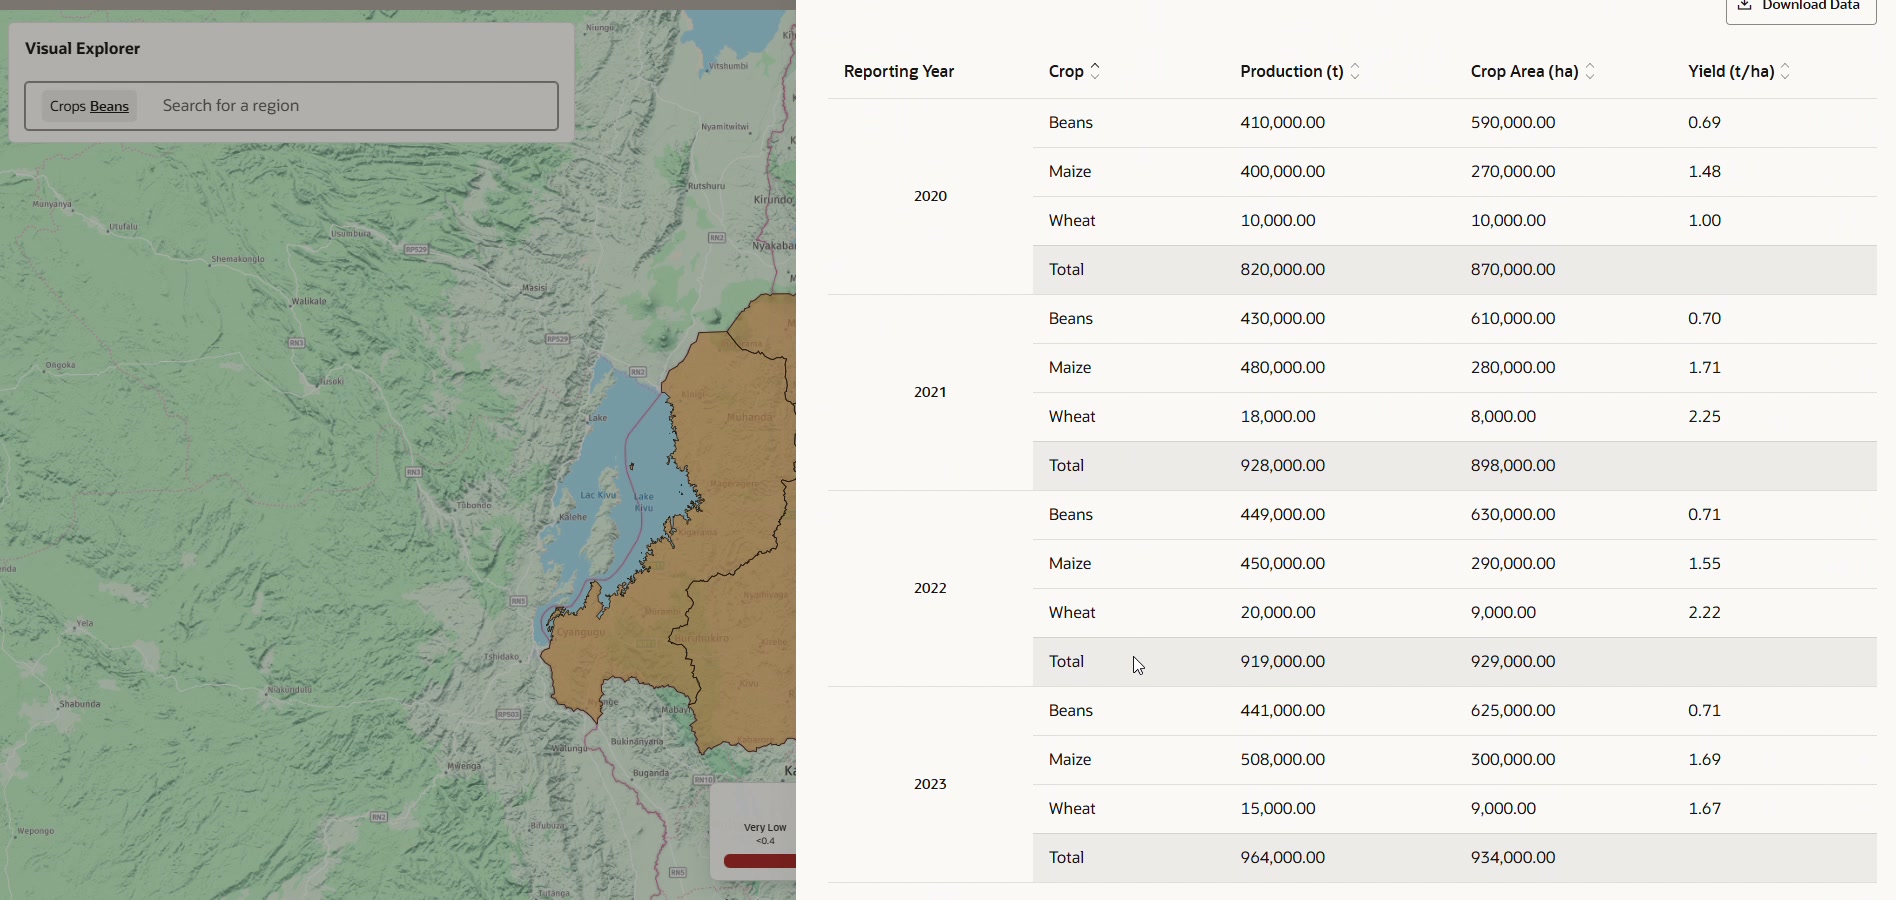
Use Yield history to review available historical production context for the selected region and crop. Historical production information can differ in source, timing, and methodology from a current model-derived forecast; use it as context rather than as a direct like-for-like comparison.
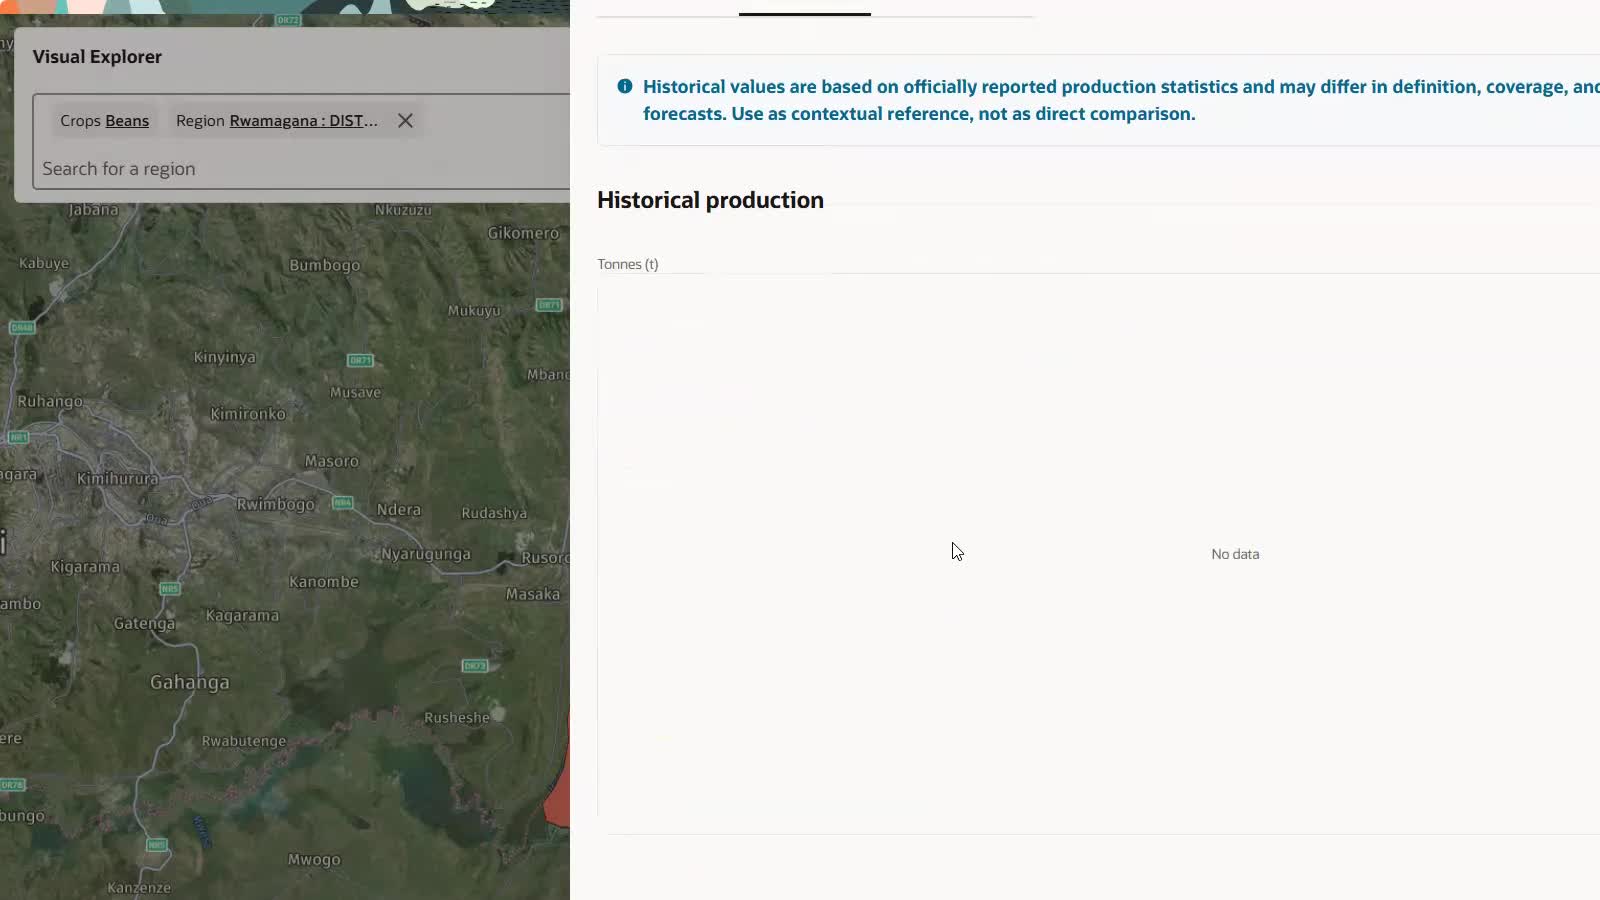
Historical production might not be available for every selected region and crop. When the panel shows no data, confirm the selected context and use the available information as context rather than assuming a missing value is a production result.
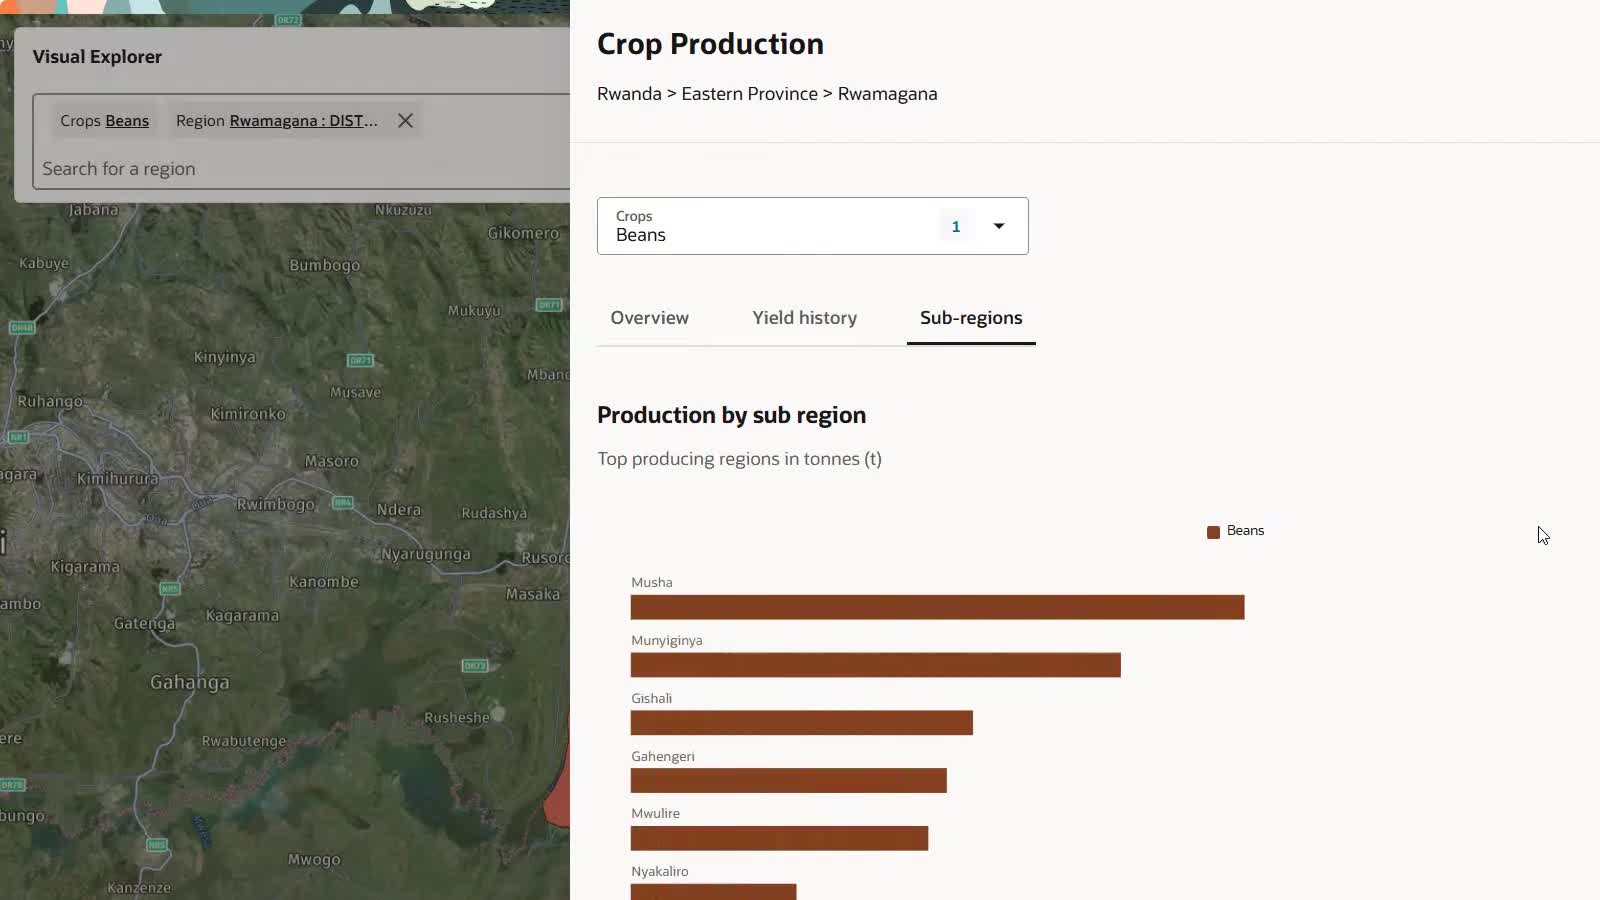
Use Sub-regions to compare lower-level areas within the selected region. You can review the table for exact values or switch to the chart view to compare results visually.
Download Data
When Download Data is available in the panel, select it to export the data currently represented by the applicable view. Confirm the selected region, crop, and dataset before downloading so that the export reflects your analysis context.
Use Tooltips for a Quick Check
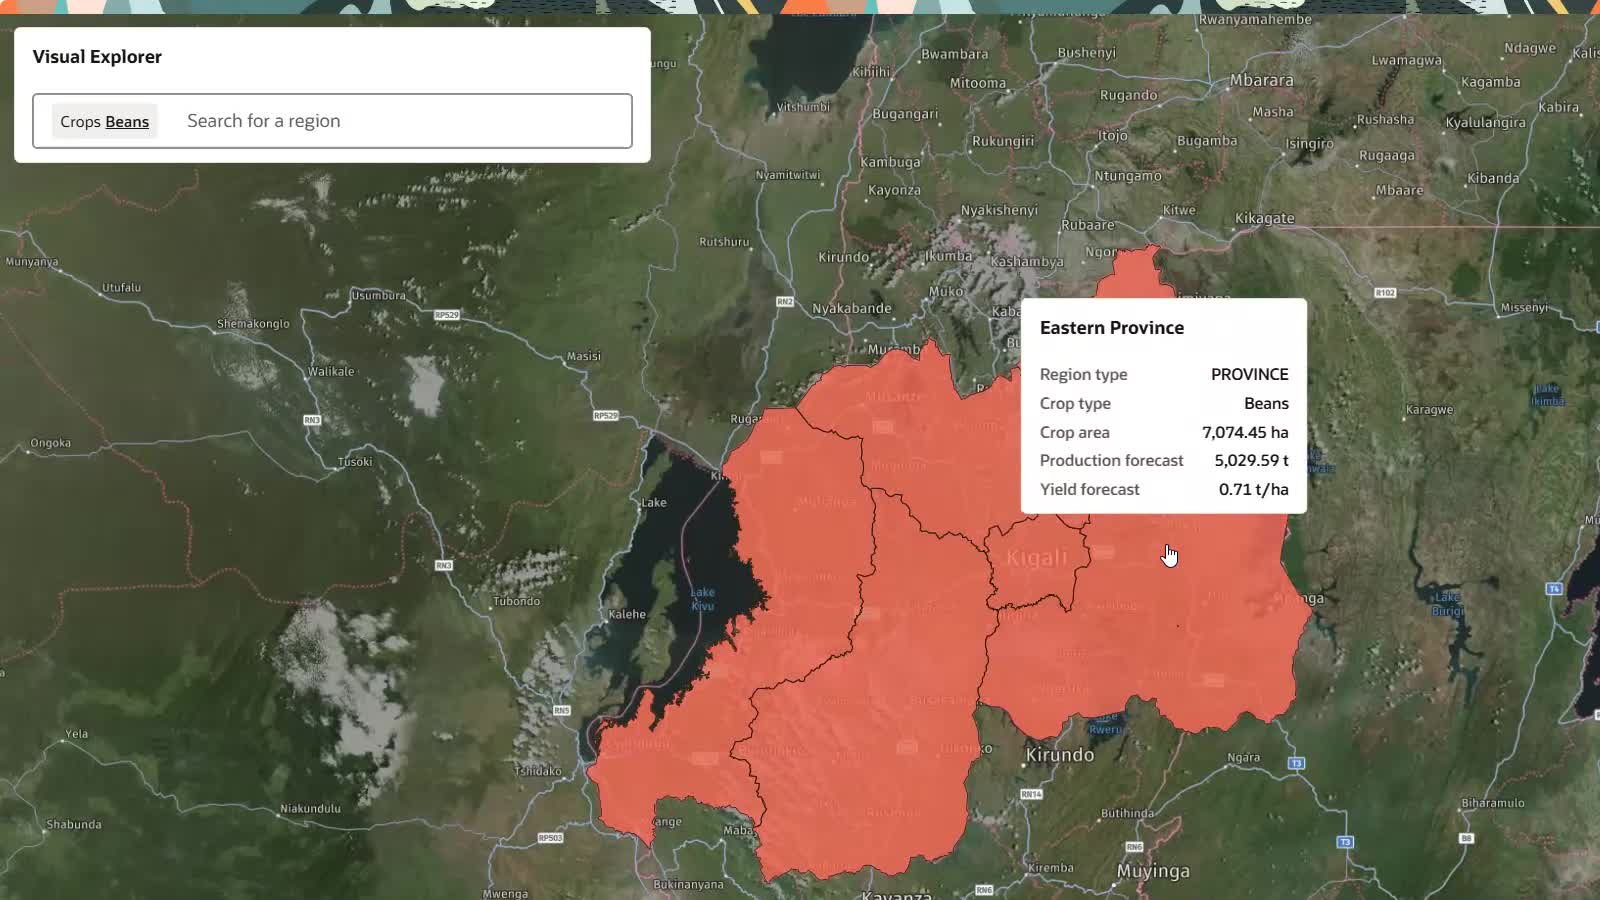
For a quick check without opening the full data panel, select or hover over a map feature and review its tooltip. Tooltip content varies by layer and zoom level.
For task-based guidance on using these views, see Common Tasks. For guidance on interpreting layer values at the appropriate scale, see Interpret Layers and Scale.