
Detailed Examples of Outage Storm Mode
Scenario 1: Meter is marked estimation ineligible, then metered data is received with outage events
The following configuration settings should be assumed for this example:
|
Master Config option |
Value |
|
Check Widespread Outages |
Yes |
|
Read Percentage Days to Examine |
7 |
|
Percent Drop From Norm - Estimation Ineligible |
30.0% |
|
Minimum Device Count For Ineligibility |
100 |
|
Days Before Becoming Ineligible |
0 |
|
Fill Missing Data With Zero |
No |
|
Days Before Filling Zero |
|
|
Maximum Estimation Ineligibility Days |
3 |
|
Percent Within Norm - Resume Estimation |
5.0% |
Diagram:
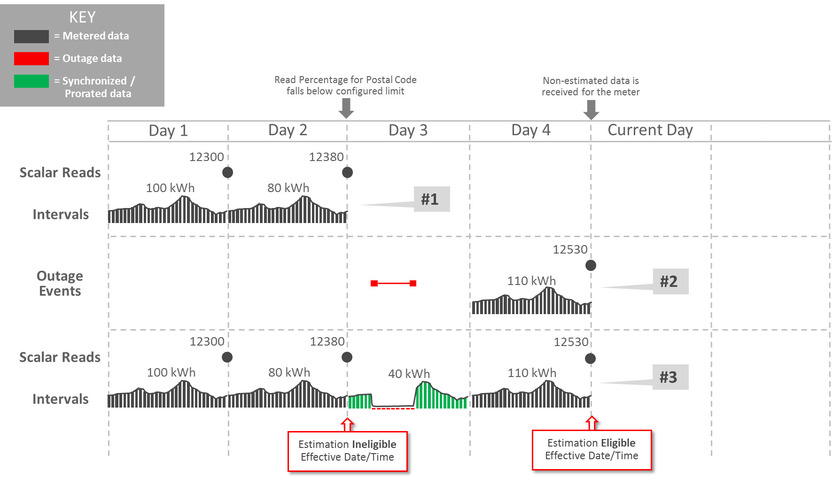
Explanation for diagram:
- The meter was communicating consistently but then a widespread outage occurs in the same postal code so the meter has an estimation suppression created.
- Two events are received...a Power Down event and a Power Up event. Also, Regular usage data is received from the meter. The reception of non-estimated data marks the meter as eligible for estimation again.
- Oracle Utilities Meter Data Management estimates data and takes the two events into account. Intervals marked as outage and filled with zeros are created during the outage period by the D1-SMMTR batch.
Scenario 2: Meter is marked estimation ineligible, is filled with zeros, then receives actual data
The following configuration settings should be assumed for this example:
|
Master Config option |
Value |
|
Check Widespread Outages |
Yes |
|
Read Percentage Days to Examine |
7 |
|
Percent Drop From Norm - Estimation Ineligible |
30.0% |
|
Minimum Device Count For Ineligibility |
100 |
|
Days Before Becoming Ineligible |
0 |
|
Fill Missing Data With Zero |
Yes |
|
Days Before Filling Zero |
0 |
|
Maximum Estimation Ineligibility Days |
3 |
|
Percent Within Norm - Resume Estimation |
5.0% |
Diagram:
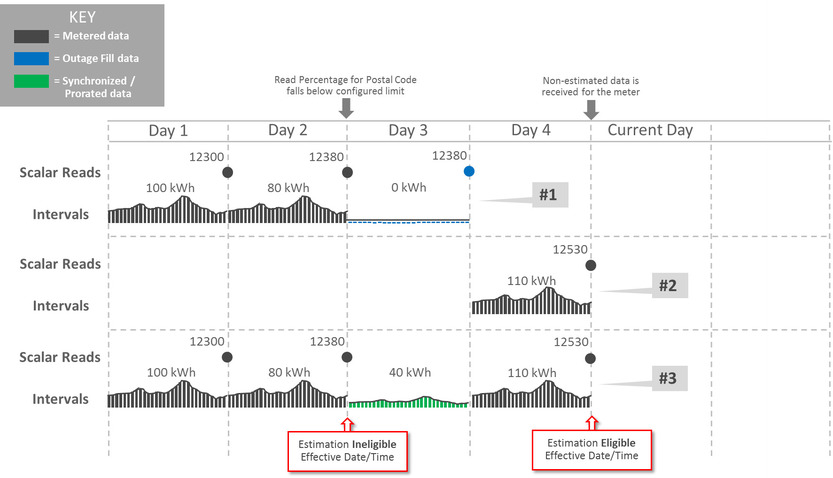
Explanation for diagram:
- The meter loses communication and periodic estimation fills in outage intervals.
- The meter reestablishes communication and sends in the latest readings and interval data.
- Oracle Utilities Meter Data Management creates new data that's synchronized to fall in line with the new data from the meter by the Consumption Sync batch. This data replaces the outage measurements as it balances out to the scalar and interval data.