View
You can view point fact data from the View page. When you open the page, by default, the Point Type Code, Electric Meter is selected and a list of meters appears. Any meter or entity you view will appear under the History tab located on the right side of the page. When you sign out of Analytics Insights, your view history resets, so when you sign back in, there will be no meters listed under the History tab.
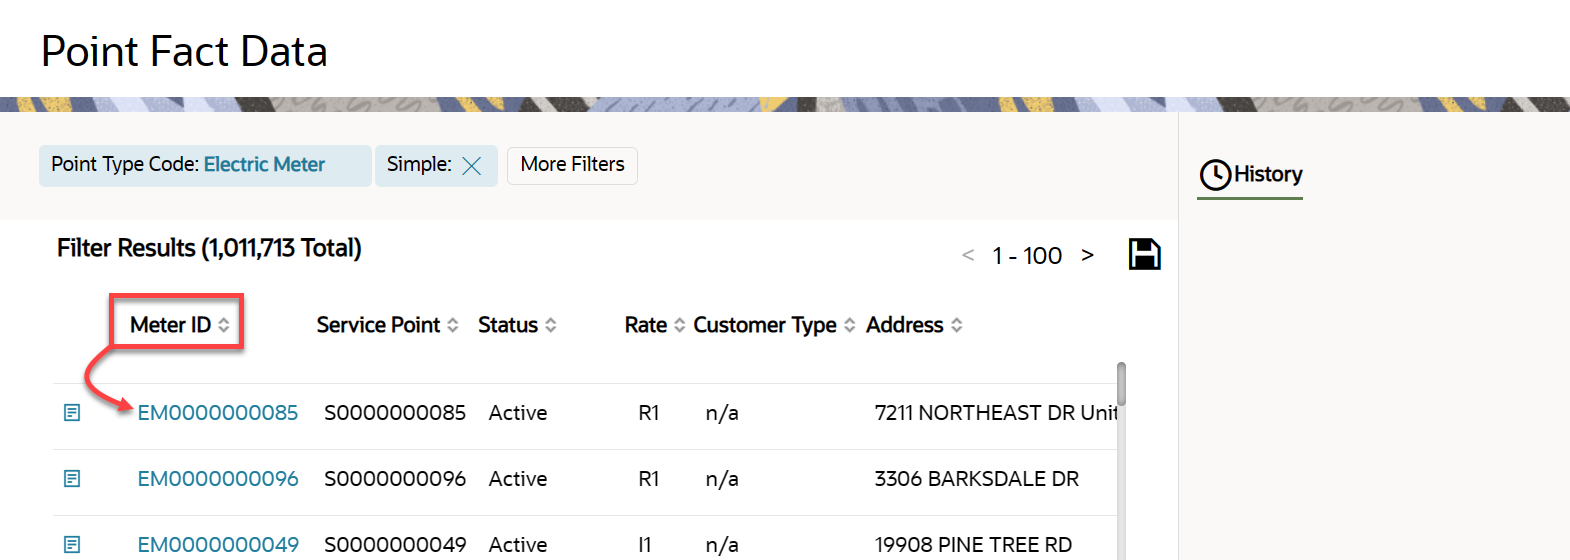
View Information About an Entity
You can click the ID of an entity to view information about it. For example, in the following image, you would click one of the ID numbers under Meter ID.
When you click the entity ID, a new page opens and you will see the Data Info Panel on the right side of the page. Use the Date Controls at the top of the page to specify the date range for the data you need based on the Fact you select from the Facts tab.
You can view the data using the chart view or the table view by toggling the Grid Mode icon. The chart view gives you a graphical representation of the data, and the table view displays the data on a table. The table view includes a search field and a drop-down where you can select the number of entries to view on the page (All, 50, 100, 500, 1000). This is beneficial when your search returns several pages of entries.
Export Search Results
You can export the data by clicking the Export icon, which will export a PNG file from the chart view and a CSV file from the table view.