Page Elements
When you sign into Oracle Utilities Analytics Insights, you are taken to the Filter Results Dashboard. The dashboard displays a list of entities available based on selected filters. An entity is any point or item that can be displayed on the dashboard and analyzed, such as for example, meters and line transformers. Selecting the ID of an entity in the dashboard opens the Detailed Data Dashboard for that entity.
On this page:
Filter Results Dashboard
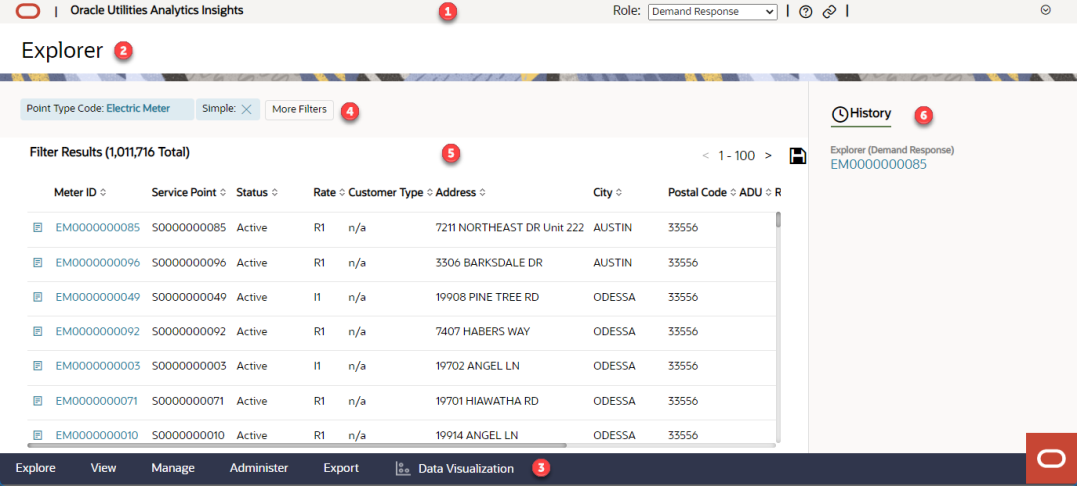
The Filter Results Dashboard is the first page you see after signing into the user interface. The following are images and descriptions of the dashboard.
Note: The following image displays the interface for a power user. Only power users will see the Administer or Manage menu items.
Dashboard Descriptions
The following are descriptions of the various sections on the Filter Results dashboard.
| Image Number | Element | Description |
|---|---|
|
1 | Heading |
The heading is visible on every page as you navigate the user interface and includes the following elements:
|
| 2 | Current Page | Name of the current page. |
|
3 | Menu Bar |
The menu bar is located at the bottom of the screen and visible on every page throughout the user interface. Menu options are visible based on user permissions. For example, only power users have access to the Manage and Administer menu options. |
| 4 | Filters |
In the filters section, you can select a point type from the Point Type Code drop-down. You can also filter meters using Simple, Algorithm or Advanced filters by clicking More Filters. |
|
5 | Filter Results |
This section displays all entities available to you based on the Point Type Code and filter selections. The Filter Results section has several columns which include a column that displays the ID of an entity, for example, Meter ID or Line Transformer ID. Click one of the ID numbers to open the Data Dashboard for that entity. It also includes the Work Order List column. This column will display the name of a list on which the entity is included. A list is a group of entities experiencing the same issues. Export: You can export filter results by clicking the Export icon. |
|
6 | History |
Use the History tab, located on the right side of the page, to quickly access recently viewed entities. |
Data Dashboard
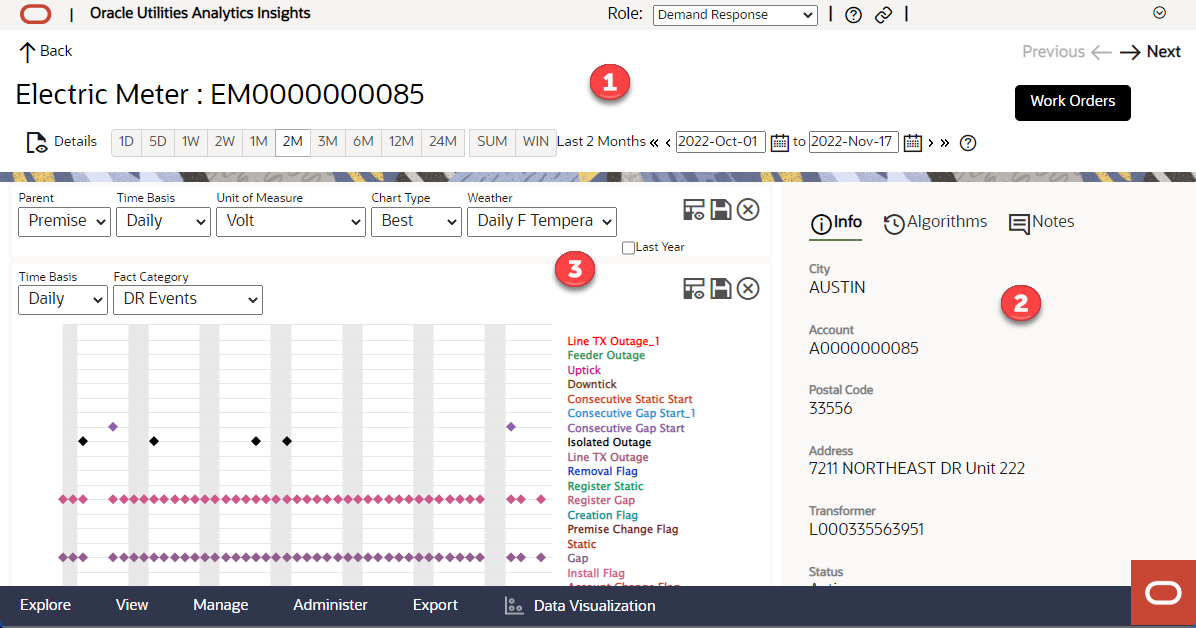
When you open one of the entities from the Filter Results Dashboard, the Data Dashboard opens. This dashboard gives you detailed information about the entity.
Note: The following image displays the interface for a power user. Only power users can see the Administer or Manage menu items.
The following is an image of the Data Dashboard:
Dashboard Descriptions
The following are descriptions of the three main areas of the Data Dashboard.
| Image Number | Element | Description |
|---|---|
|
1 | Heading |
The heading includes:
|
| 2 | Data Info Panel | The Data Info Panel includes three tabs: Info, Algorithm, and Notes. See Data Dashboard for more information. |
|
3 | Data Panels |
You can access several data panels to give you in-depth details about the entity. See Data Panels for more information. |