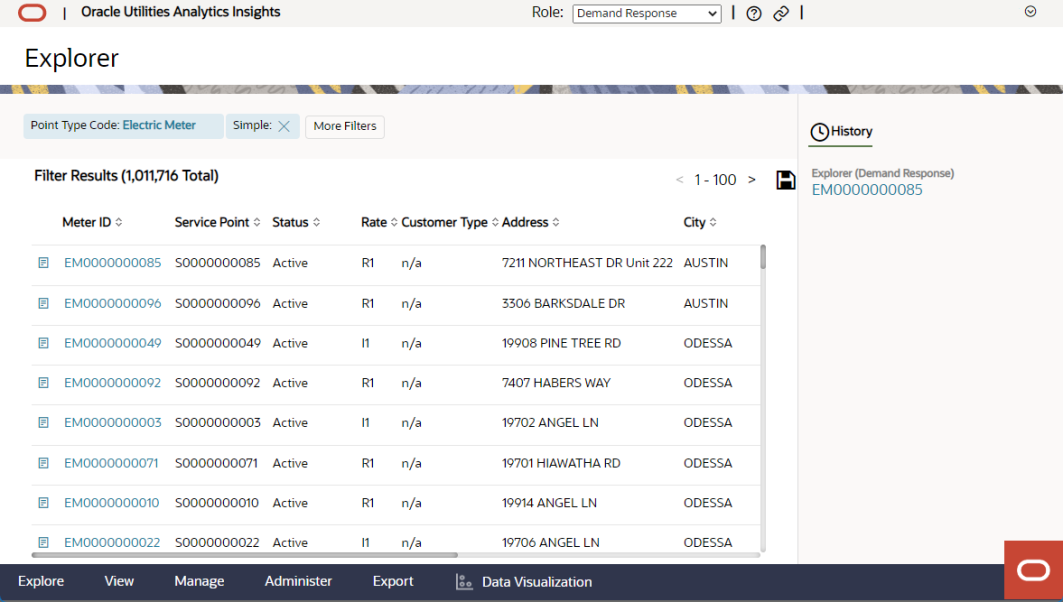
Explore Menu
You can access the Explorer from the Explore menu. The Explorer allows you to search for, analyze, and visualize data for a selected object, and it will automatically update based on the filters you select. It includes a Filter Results list with configurable columns and data panels determined by the object type. The following image shows the default configuration.

Data Panels may be configured to open automatically when an entity is selected. For example, if you select Electric Meter from the Point Type Code drop-down, buttons for three panels, Metric, Event, and Map, appear. When the corresponding data loads, the first point is highlighted and the Metric, Event, and Map panels open and display the meter's data.
When you sign into Analytics Insights for the first time, by default the Demand Response role is selected with Electric Meter as the Point Code Type. You can select the relevant role and Point Code Type, and when you sign out of and then back into Analytics Insights, the role and Point Code Type used from your previous session remain the same. In addition, after you sign in, the filter results grid and saved panels pre-populate.
Note: If a user makes any changes to the environment, role, or point type, the filter results grid and saved panels will automatically reload.
In this section: