TOU HBA Main Insight Module
This module shows customers what portion of their energy use occurs during on-peak periods, provides details about the cost of energy use during peak periods, displays usage charts for weekdays and weekends, and encourages them to shift their energy usage to off-peak hours.
Notes:
-
This section describes only the TOU HBA Main Insights module and does not cover additional modules that are delivered within the High Bill Alert AMI Email communication. See the Oracle Utilities Opower Proactive Alerts Cloud Service Product Overview for more information about the other modules.
-
This is an updated version of the BLS High Usage module. Oracle recommends using this updated version of the module, as it provides additional details for your customers.
Design
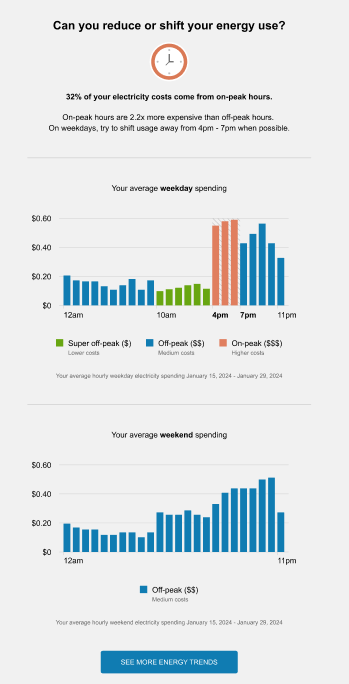
This image shows an example of the TOU HBA Main Insight module:

User Experience Variations
This section discusses the user experience variations in the TOU HBA Main Insight module.
Usage Variation
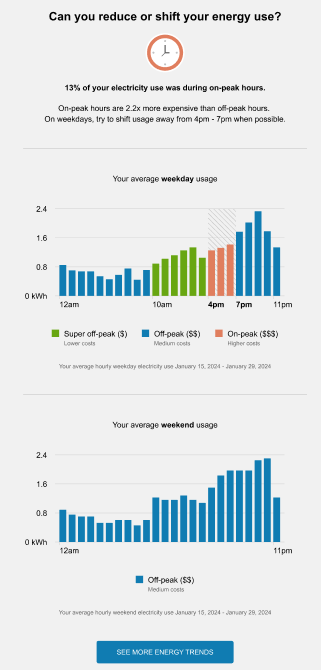
This image shows an example of the usage version of the TOU HBA Main Insight module:

The usage version of the module varies from the cost version as follows:
Insight Statement 1: The statement below the graphic tells the reader what percentage of their energy use was during on-peak hours. For example, the statement might say, "32% of your electricity use was during on-peak hours."
Weekday Chart Title: The title of the first chart informs the user that the data is related to their weekday energy usage.
Weekday Bar Chart: The chart depicts the average weekday electricity usage during each hour of the day. The different peak periods are color coded, and described in the legend below the chart, to enable readers to easily identify when they are using the most electricity.
Weekday Date Range Statement: This statement identifies the date range that is used to determine the information in the bar chart. For example, the statement might say, "Your average hourly weekday electricity use January 15, 2024 - January 29, 2024".
Weekend Chart Title: The title of the second chart informs the user that the data is related to their weekend energy usage.
Weekend Bar Chart: The chart depicts the average weekend electricity use during each hour of the day. Utilities typically do not have peak periods on weekends, therefore, this chart is typically shown in a single color with a legend below. The data helps readers understand when they are using energy on the weekends.
Weekend Date Range Statement: This statement identifies the date range that is used to determine the information in the bar chart. For example, the statement might say, "Your average hourly weekend electricity use January 15, 2024 - January 29, 2024".
Tiered TOU Plans
For tiered TOU plans, the module varies in the following way:
Insight Statement 2: This statement explains how much more expensive energy is during peak hours compared to off-peak hours, and asks the reader to try and shift usage away from the on-peak time period. The tier with the highest cost ratio is used when calculating the price ratio in the statement, which might say, "On-peak hours are up to 2.2x more expensive than off peak hours. On weekdays, try to shift usage away from 4pm - 7pm when possible."
Demand Rate Plans
For demand rate plans, the module varies in the following way:
Insight Statement 2: For Demand TOU plans, the cost ratio is already stated in the Demand TOU 101 module. Therefore, the first sentence of the statement is removed. The statement might say, "On weekdays, try to shift usage away from 4pm - 7pm when possible."
Multiple High Cost Periods
If there are two or more highest costs periods, the module varies in the following way:
Insight Statement 2: The last sentence of the statement varies for multiple high-cost periods to tell the user that there are multiple time periods when they should shift their energy use, as follows:
-
Two high-cost periods: The statement might say, "On-peak hours are up to 2.2x more expensive than off peak hours. On weekdays, try to shift usage away from 7am - 10am and 4pm - 7pm when possible."
-
Three or more high-cost periods: The statement uses the name of the highest cost period, and might say "On-peak hours are up to 2.2x more expensive than off peak hours. On weekdays, try to shift usage away from on-peak when possible."
Low Peak Usage
If the percentage of peak usage is below a certain threshold, the module varies in the following ways:
Module Title: The title of the module changes to "Can you reduce your energy use?"
Module Graphic: No graphic is included.
Insight Statement 1: Not included in the module.
Insight Statement 2: Not included in the module.
TOU Hours the Same on Weekdays and Weekends
If TOU hours are the same during weekdays and weekends, only one chart is included in the module. The chart encompasses both weekdays and weekend days.
The chart title and the date range statements are changed as follows for cost variations:
- Chart title: "Your average hourly cost"
- Date range statement: "Your average hourly electricity spending January 15, 2024 - January 29, 2024"
The chart title and the date range statements are changed as follows for usage variations:
- Chart title: "Your average hourly usage"
- Date range statement: "Your average hourly electricity use January 15, 2024 - January 29, 2024"
Holiday Variation
When a holiday is included in the time period, the module is updated as follows for cost variations:
Chart titles: "Your average <weekend or weekday> and holiday spending"
Date range statements: "Your average hourly <weekend or weekday> and holiday electricity spending January 15, 2024 - January 29, 2024"
The module is updated as follows for usage variations:
Chart titles: "Your average <weekend or weekday> and holiday usage"
Date range statements: "Your average hourly <weekend or weekday> and holiday electricity use January 15, 2024 - January 29, 2024"
Configuration Options
For each element listed in the table, indicate the desired configuration in the Input Value column. If you do not provide an input for optional configurations, the default will be used.
| Configuration Option | Input Value |
|---|---|
|
Color in Graphic By default, the color of the clock graphic is set to use the utility's On Peak color. |
Optional Choose one of the following: Use the default color. Work with your Delivery Team to specify other colors. |
|
Low Usage Threshold If the customer only has a small percentage of their usage during peak hours, the module is adjusted to remove some peak hour information. By default, the threshold is set to 0.05 (5%). |
Optional Choose one of the following: Use the default threshold. Use this threshold: |
|
Chart Legend Indicators You can specify whether to include the dollar sign indicators next to the peak period names in the legend. The indicators are included by default using the Config Show Legend TOU Period Dollar Signs configuration. For example:
|
Optional Choose from the following: Display the indicators. Do not display the indicators. |
|
Chart Legend Labels You can specify whether to include labels under each item in the chart legend. The labels are included by default using the Config Show Legend TOU Period Sub-Label configuration. For example:
|
Optional Choose one of the following: Display the labels. Do not display the labels.
|
|
Show Weekend Chart Separately You can configure the charts to display weekday and weekend days as two separate charts, or to combine the days into a single chart. You can not combine the charts if the TOU periods are different on weekdays and weekends. By default, the charts are set to display separately. |
Optional
Choose one of the following: Display separate charts. Do not display separate charts. |