BLS High Usage Module
This module shows customers how much money they spent on off-peak and on-peak hours over a specific time frame, encouraging them to shift their energy usage to off-peak hours.
Note that dual fuel customers might receive the dual fuel High Bill Alert AMI email that contains the BLS High Usage Period module and the standard High Usage Period module. The BLS High Usage Period module shows electric usage and the different pricing periods through the day that are associated with the electric TOU or demand rate plan. The standard High Usage Period module shows a single price for the day and displays gas usage.
Notes:
-
This section describes only the BLS High Usage Period module and does not cover additional modules that are delivered within the High Bill Alert AMI Email communication. See the Oracle Utilities Opower Proactive Alerts Cloud Service Product Overview for more information about the other modules.
-
This module is considered a legacy version. Before using this, be aware that Oracle recommends using the TOU HBA Main Insight module instead. While this module is still available, utilities starting a new deployment should use the TOU HBA Main Insight module, and utilities currently using the BLS High Usage Module are encouraged to upgrade to the TOU HBA Main Insight module. Contact your delivery team if you have questions about which module to use.
Design
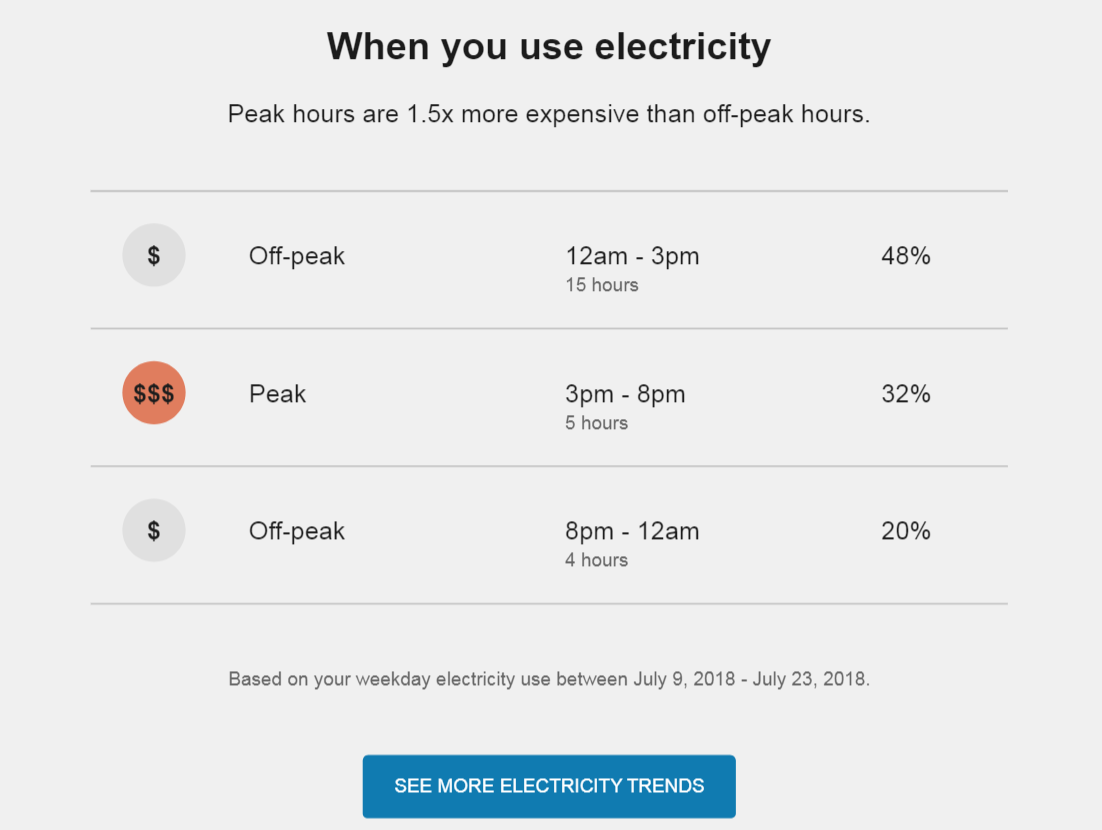
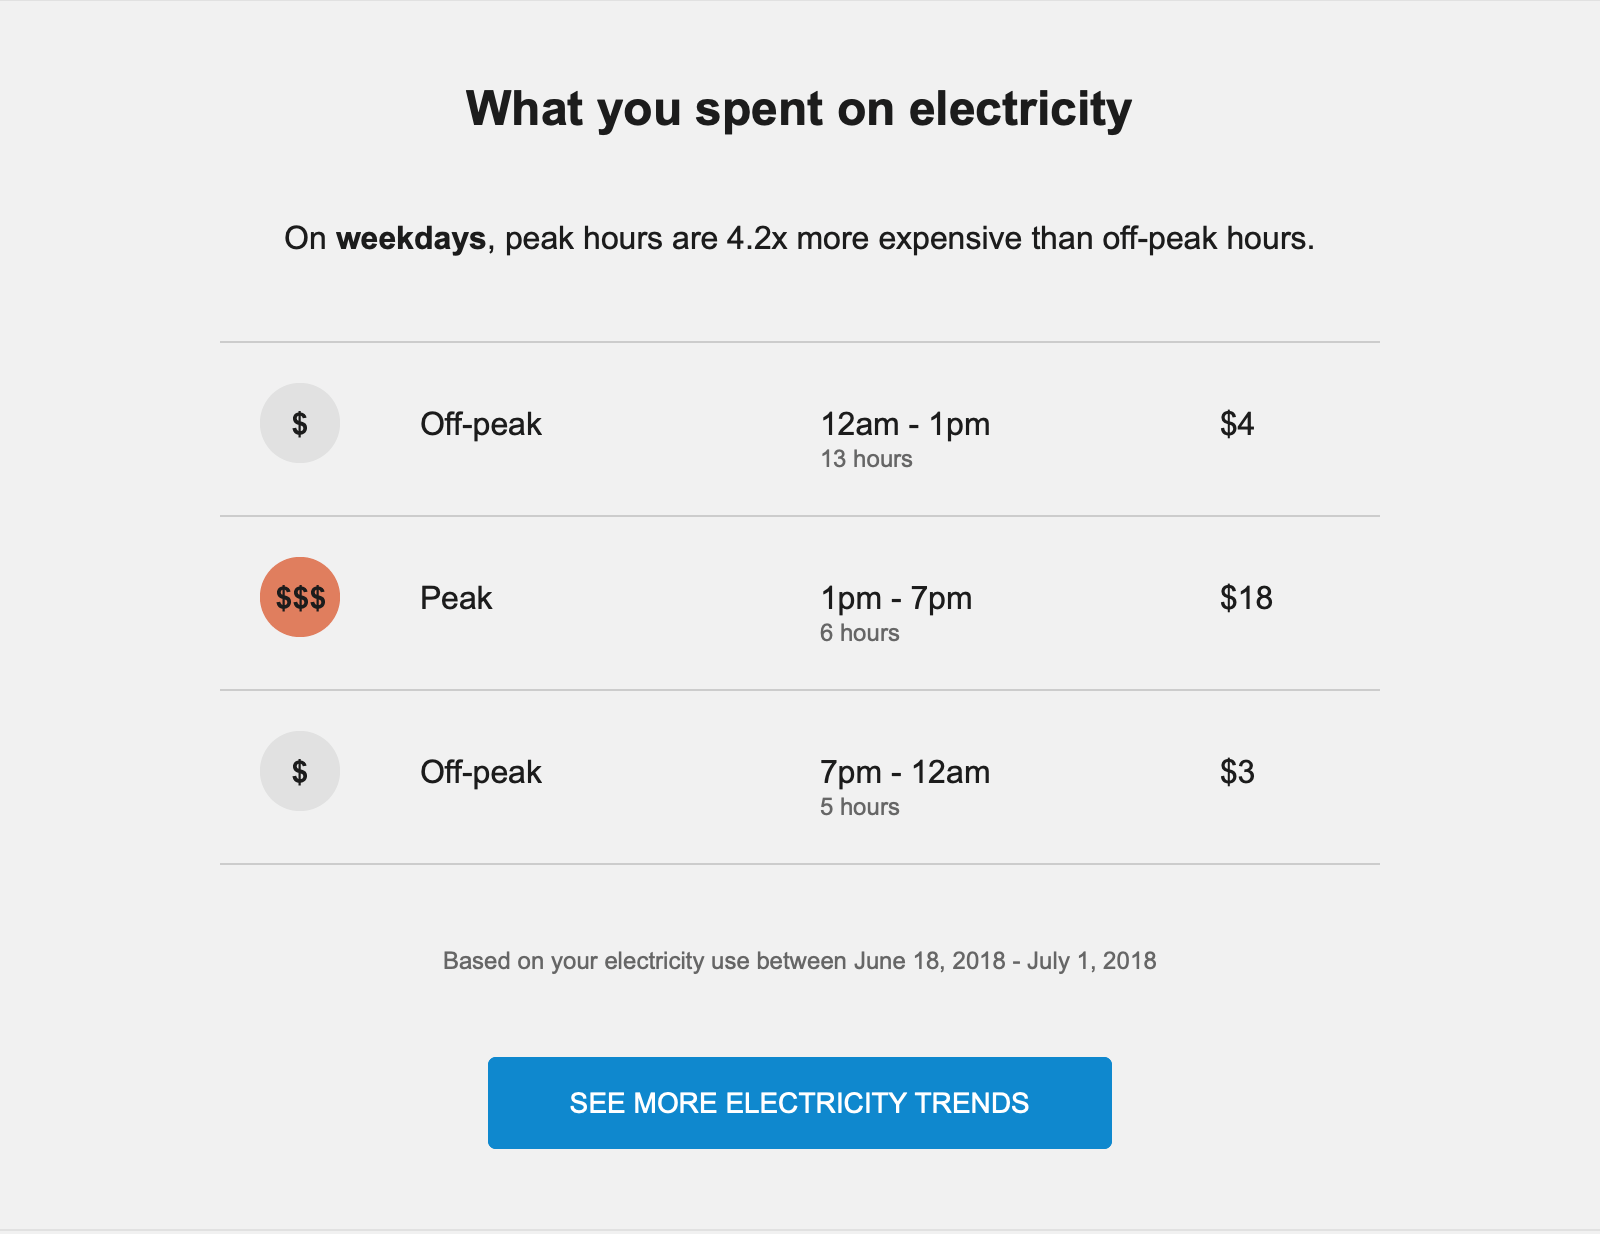
This image shows an example of the BLS High Usage module:

User Experience Variations
This section discusses user experience variations for the BLS High Usage module.
Use vs. Cost Variations
If the module is configured to display usage, the module shows the percentage of use during each period. If the module is configured to show cost, the module shows dollar amounts spent during each period.
Tiered TOU Rates
For customers on tiered TOU rate plans, the tier with the highest price ratio is used to determine the price ratio in the insight statement of the BLS High Usage Period module.
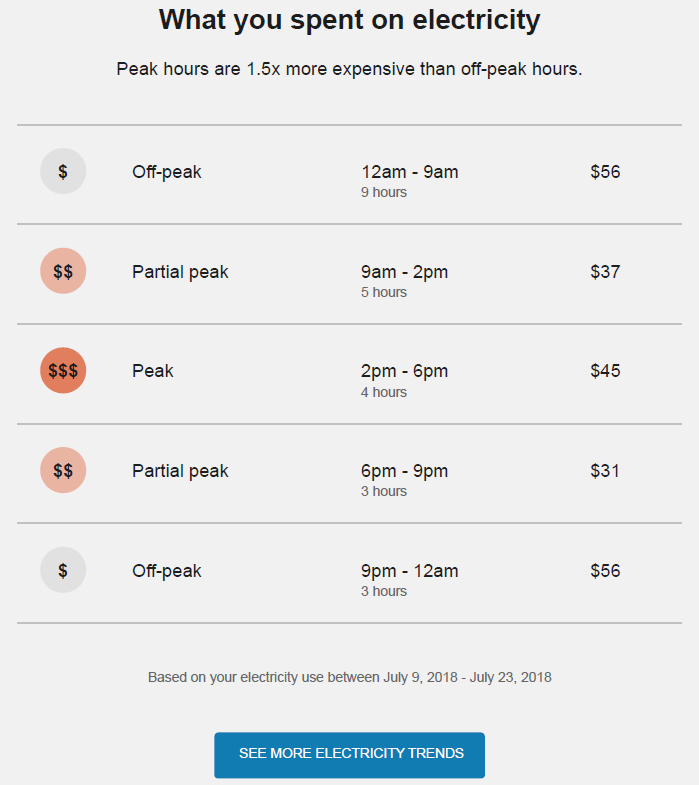
Partial-Peak Periods
For customers with rate plans that include partial-peak periods, the module displays off-peak, partial-peak, and peak hours using different color icons within the table.
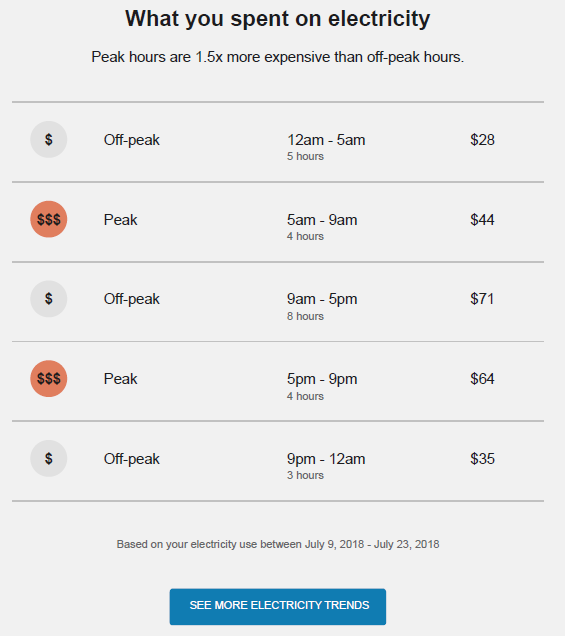
Multiple Peak Periods
For customers with rate plans that include multiple peak periods each day, the module displays all peak periods in the table.
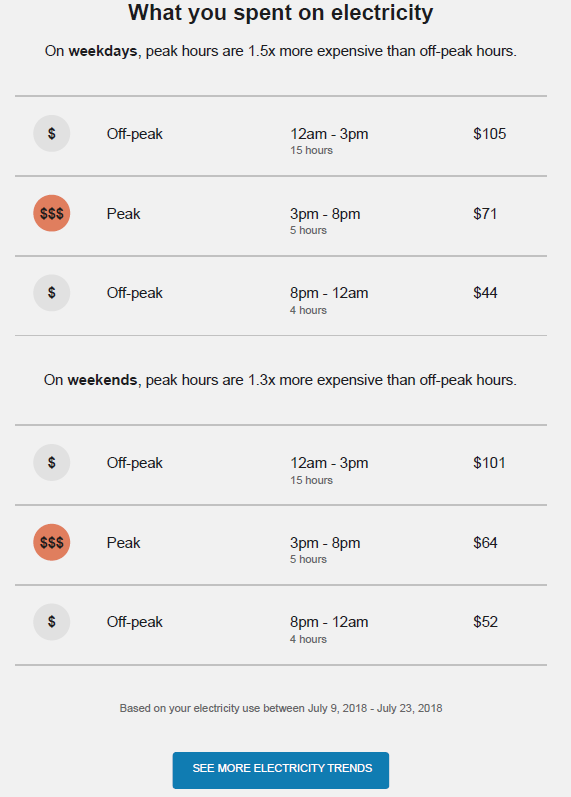
Weekday and Weekend Breakdowns
If a customer’s rate plan has different weekday and weekend pricing breakdowns, then the BLS Time of Day modules should be separated so that the weekday module is displayed first and the weekend module appears next.
Insight Statement: The statement that appears below the module heading changes as follows, depending on whether the module is displaying weekday or weekend data:
- On weekdays, peak hours are 1.5x more expensive than off-peak hours.
- On weekends, peak hours are 1.3x more expensive than off-peak hours.
In some scenarios, the price ratio can be the same on weekdays and weekends, but there will still be two charts displayed if the peak period times are different on weekdays and weekends.
Footer: The footer statement reads: "Based on your electricity use between [date range]."
This example illustrates different price ratios on weekdays and weekends:
If the rate plan has peak hours during the week, but no peak hours on the weekend, the module appears as follows, and no weekend chart is displayed, as shown here:
Configuration Options
For each element listed in the table, indicate the desired configuration in the Input Value column. If you do not provide an input for optional configurations, the default will be used. This table includes configuration options for the BLS High Usage Period module only. For details about configuration options for the Demand 101 module, which is also included in the email for demand rate customers, see Demand 101 Module.
| Configuration Option | Input Value |
|---|---|
|
Peak Time Price Ratio The insight statement of the BLS High Usage Period module includes a price ratio that identifies how much more expensive electricity is during peak hours. For example:
By default, this value is calculated automatically based on the rate plan data provided. However, you can manually specify the ratio. For customers on tiered TOU plans, the price ratio of the first tier is used in this statement. |
Required Choose one of the following: Use the default calculated value. Use this price ratio: |
|
Peak Icon Color Icon colors can match the utility’s color palette. This icon should also match the color in the TOU 101 module. The colors shown are the default colors. Research has shown that using a bright color to identify the peak periods is the most successful. |
Optional Choose one of the following: Use the default color. Work with your Delivery Team to select brand colors.
|
|
Disclaimer The disclaimer statement identifies the date range that is used to determine the information in the use table. For example, "Based on your electricity use between July 9, 2018 - July 23, 2018." |
Optional Choose one of the following: Use the default statement. Use the following statement:
|
|
Peak Time Names You can designate the name of peak and off-peak ranges on the bar chart. Default values include:
You must have at least two ranges for BLS insights to display correctly. |
Optional Choose from the following: Use the default values. Use the following names:
|