Demand 101 Module
The Demand 101 module is used to educate customers about how their demand charge is calculated. The Demand 101 module provides customers with information such as:
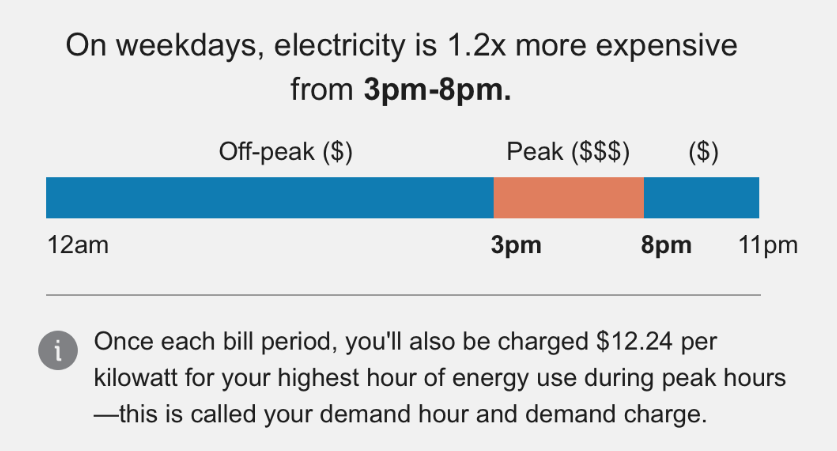
- How much more expensive peak prices are than off-peak prices.
- The hours during which electricity is most expensive.
- A visual timeline that displays off-peak, partial-peak, and peak hours.
- An explanation of how the demand charge is calculated.
On this page:
Customer Requirements
|
Category |
Description |
|---|---|
|
Data History |
AMI data for the last two weeks. |
|
Data Coverage |
Demand rate plan data should be available for the week covered by the report. |
Design
This image shows an example of the Demand 101 module:
User Experience Variations
The user experience of the feature may vary for customers and utilities depending on their service types (gas, electricity, dual fuel, and so on), available data, costs, locale, and other factors. For more information, see the Demand 101 module description in the Behavioral Load Shaping Cloud Service Overview and go to the User Experience Variations section.
To see how this module fits into the overall user experience, see the following topics:
- Design and Configuration: Demand Rate Coach Emails
- Design and Configuration: BLS Insights in High Bill Alert Emails
Configuration Options
For each element listed in the table, indicate the desired configuration in the Input Value column. If you do not provide an input for optional configurations, the default will be used.
| Configuration Option | Input Value |
|---|---|
|
Color and Chart Alignment Oracle strongly recommends that the colors and charts for this module, the Hourly Usage module, and the Demand Day Usage module all use the same colors, and are aligned to show the customer the visual connection between each hour’s price and the customer’s use during each hour. |
Required Choose one of the following: Use default colors. Work with your Delivery Team to specify other colors. |
|
Peak Time Price Ratio in Insight Statement The introduction statement of the Demand 101 module can include a price ratio that indicates how much more expensive electricity is during peak hours. For example, "Electricity is 1.2x more expensive during peak hours". By default, the value is automatically calculated based on the rate plan details received from the client. However, this value can be manually entered, or it can be excluded from the statement. |
Required Choose one of the following: Use the ratio from the rate plan. Use the following ratio: Exclude ratio from the statement. |
|
Peak Time Names You can designate the name of peak and off-peak ranges on the bar chart, including how many dollar signs ($) appear for each. You can also specify the name of the peak period that is used in the Demand Charge Statement. Dollar signs do not appear in this statement. Default values include:
The values used here should be the same as the values in all other Behavioral Load Shaping modules that display the peak time names. |
Required Choose one of the following: Use the default names. Use the following names: |