
Configuring the Meter Operational Dashboard
This section describes the process for configuring the Meter Operational Dashboard.
Refer to the Using the Meter Operational Dashboard section of the Oracle Utilities Meter Solution Business User Guide for more information on this functionality.
This dashboard leverages a method of pre-staging data known as Statistics Snapshots. See Understanding Statistics for more information on Statistics Snapshots.
A method for tracking Performance Targets (also known as Service Level Agreements) is available within the Meter Operational Dashboard as well. To understand how to set up Performance Targets, refer to Understanding Performance Targets. The Performance Targets you configure will then be leveraged on the Batch Performance and/or Database tabs of the Meter Operational Dashboard.
Configuring the Meter Operational Dashboard includes the following:
Master Configuration
You can access the Master Configuration portal by selecting Admin, then General, then Master Configuration.
Select the MDM Operational Dashboard Configuration.
Use the Add button beside the record to configure for the first time. If a record has already been added, then click the Edit button instead. Use the embedded help to guide you through the meaning of each configuration field.
General Admin Data
Create the following administrative data.
Service Type:
-
Service Type: MISC
-
Description: Miscellaneous
Unit of Measure:
-
Unit of Measure: CT
-
Description: Count
-
Service Type: Miscellaneous
-
Decimal Positions: 0
-
Allowed on Measuring Component: Yes
-
Measures Peak Quantity: No
-
Magnitude: 1
-
Base Unit of Measure: BLANK
Activity Types for Payload Statistics
Configure the following payload statistics activity types:
-
Payload Statistics
-
Payload Error Notification
-
Payload Summary
See Configuring Activity Types for more information.
See Processing Statistics in the Business User Guide for more information about payload statistics processing.
Measuring Component Types for Payload Statistics
Configure the following measuring component types:
Initial Measurements
|
Field / Section |
Value |
||||||||||||||||||
|---|---|---|---|---|---|---|---|---|---|---|---|---|---|---|---|---|---|---|---|
|
Measuring Component Type |
STATS-IMD |
||||||||||||||||||
|
Description |
IMD Upload Statistics Aggregator |
||||||||||||||||||
|
Measuring Component Type Business Object |
Activity Upload Statistic Aggregator Type |
||||||||||||||||||
|
Measuring Component Business Object |
Payload Statistics Aggregator - IMD |
||||||||||||||||||
|
Measurement Business Object |
Measurement |
||||||||||||||||||
|
Service Type |
Miscellaneous |
||||||||||||||||||
|
Statistic Type |
Initial Measurements |
||||||||||||||||||
|
Display Parcel Size |
24:00:00 |
||||||||||||||||||
|
Aggregation |
Aggregation Horizon: 5 Aggregation Lag: 2 |
||||||||||||||||||
|
Valid Activity Types to Aggregate |
Activity Type: Payload Statistics |
||||||||||||||||||
|
Value Identifiers |
|
||||||||||||||||||
|
Display Configuration |
Hours of Chart Data to Display: 24 |
Device Events
|
Field / Section |
Value |
||||||||||||||||||
|---|---|---|---|---|---|---|---|---|---|---|---|---|---|---|---|---|---|---|---|
|
Measuring Component Type |
STATS-EVENT |
||||||||||||||||||
|
Description |
Event Upload Statistics Aggregator |
||||||||||||||||||
|
Measuring Component Type Business Object |
Activity Upload Statistic Aggregator Type |
||||||||||||||||||
|
Measuring Component Business Object |
Payload Statistics Aggregator - Event |
||||||||||||||||||
|
Measurement Business Object |
Measurement |
||||||||||||||||||
|
Service Type |
Miscellaneous |
||||||||||||||||||
|
Statistic Type |
Events |
||||||||||||||||||
|
Display Parcel Size |
24:00:00 |
||||||||||||||||||
|
Aggregation |
Aggregation Horizon: 5 Aggregation Lag: 2 |
||||||||||||||||||
|
Valid Activity Types to Aggregate |
Activity Type: Payload Statistics |
||||||||||||||||||
|
Value Identifiers |
|
||||||||||||||||||
|
Display Configuration |
Hours of Chart Data to Display: 24 |
Statistic Controls and Statistics Snapshots
Statistic Controls are the source for recording the transactions which have gone into exception/discarded state or have a pending to-do associated with them. These records are then fetched by MDM Operational Dashboard’s respective zones for Statistic and Trend display.
Statistic Snapshots capture the transactions which have gone into exception/discarded state or have a pending to-do associated with them at a specific time.
Statistic Controls are configuration records that record the daily transactions of Incomplete IMD by Status, VEE Exceptions by Type, Usage Transaction by Status, and Usage Transaction by To-Do.
Statistic Snapshots are captured daily via the Statistics Control Monitor (F1-STATS) batch process.
Configure the following Statistics Control records:
|
Statistics Control |
Description |
Category |
Status |
Snapshot Frequency Hours |
Retention Mode |
Snapshot Business Object |
|---|---|---|---|---|---|---|
|
INCOMPLETE-IMD-STATUS |
Incomplete IMDs by Status |
Operational |
Active |
1.00 |
Retain All Snapshots |
Same as Description |
|
INCOMPLETE-UT-STATUS |
Incomplete Usage Transaction by Status |
Operational |
Active |
1.00 |
Retain All Snapshots |
Same as Description |
|
INCOMPLETE-UT-TD-EXCP |
Incomplete Usage To Dos by Exception |
Operational |
Active |
1.00 |
Retain All Snapshots |
Same as Description |
|
INCOMPLETE-VEE-TD-EXCP |
Incomplete VEE To Dos by Exception |
Operational |
Active |
1.00 |
Retain All Snapshots |
Same as Description |
Payload Statistics Aggregator Measuring Components
Create a measuring component for each head end system for each measuring component type. For example, assume the following head end systems are being used:
-
MV90: Usage
-
Landis+Gyr: Usage and Device Events
In this example, you would create the following measuring components:
-
MV90 (STATS-IMD Measuring Component Type)
-
L+G (STATS-IMD Measuring Component Type)
-
L+G (STATS-EVENT Measuring Component Type)
|
Field |
MV90 Usage |
L+G Usage |
L+G Device Events |
|---|---|---|---|
|
Measuring Component Type |
IMD Upload Statistics Aggregator |
IMD Upload Statistics Aggregator |
Event Upload Statistics Aggregator |
|
Status |
Active |
Active |
Active |
|
How To Use |
Additive |
Additive |
Additive |
|
Head End System |
MV90 |
L+G |
L+G |
Batch Processing
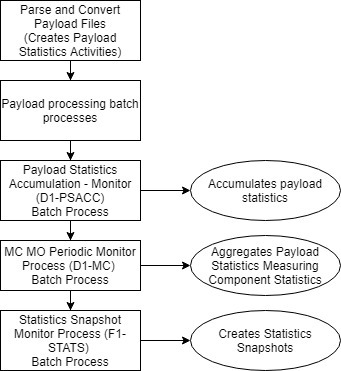
The Meter Operational Dashboard is configured to be refreshed daily. To refresh the data used in the dashboard, the following batch processes should be processed in sequence after daily payload processing from the head end systems is complete.
-
D1-PSACC (Payload Statistics Accumulation - Monitor): Used to initiate aggregation and accumulation of payload statistics in payload statistics activities. This executes the Perform Activity Aggregation (D1-PRFACTAGG) algorithm in the activity's "Active" state and transitions the activity to the "Accumulate Statistics" state which executes the Accumulate Statistics Algorithm (D1-ACCSTATS) algorithm.
Use the following parameters when running this batch process:- Measuring Component Maintenance Object (maintenanceObject): D1-ACTIVITY
- Restrict by Batch Code (isRestrictedByBatchCode): true
-
D1-MC (MC MO Periodic Monitor Process): Used to initiate aggregation of statistics for statistics aggregator measuring components. This transitions measuring components from the "Active" state to the "Aggregate" state, which executes the Aggregate IMD Statistics (D1-AGIMDSTAT) or Aggregation Event Statistics (D1-AGEVTSTAT) algorithms that aggregate measurement and/or device event statistics.
Use the following parameters when running this batch process:- Maintenance Object (maintenanceObject): D1-MEASRCOMP
-
F1-STATS (Statistics Control Monitor): Used to generate Statistic Snapshots based on Statistic Controls.
Use the following parameters when running this batch process:- Maintenance Object (maintenanceObject): F1-STATS
- Restrict by Business Object (restrictToBusinessObject): F1-Statistics
- Restrict by Status Code (restrictToBOStatus): ACTIVE
The flowchart below illustrates the order which payload processing and these batch processes should be executed.
Populating the Dashboard Zones
The table below outlines the source of data for the various zones in the Meter Operational Dashboard.
|
Dashboard Zone |
Source of Data |
|---|---|
|
IMD Loading Trend |
Usage Payload Statistics Aggregator Measuring Components (which aggregate data from payload statistics activities) (MV90 Usage and L+G Usage measuring components from the example above) |
|
Device Event Loading Trend |
Device Event Payload Statistics Aggregator Measuring Components (which aggregate data from payload statistics activities) (L+D Device Events measuring component from the example above) |
|
Incomplete IMDs by Status Incomplete IMDs Trend |
Incomplete IMDs by Status Statistics Control and Statistics Snapshots |
|
VEE To Dos by Exception Type VEE To Dos Trend |
Incomplete VEE To Dos by Exception Statistics Control and Statistics Snapshots |
|
Usage Transaction by Status Usage Transactions Trend |
Incomplete Usage Transactions by Status Statistics Control and Statistics Snapshots |
|
Incomplete Usage To Dos by Exception Usage Transactions To Dos Trend |
Incomplete Usage To Dos by Exception Statistics Control and Statistics Snapshots |