Time of Day
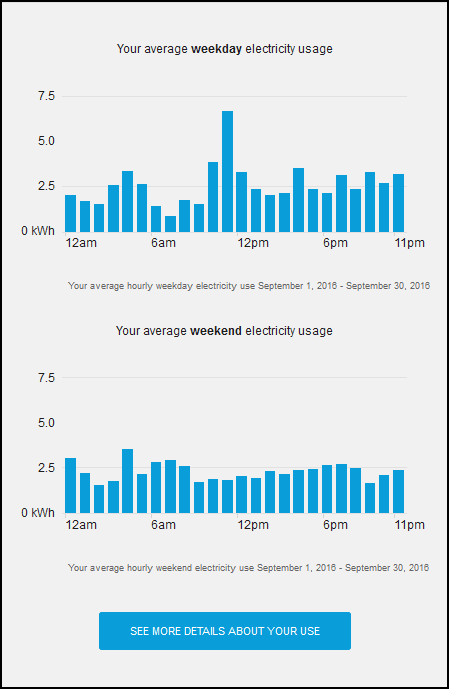
The Time of Day module identifies the time of day when business customers tend to use the most energy so that they know when to focus on being more energy-efficient. The energy usage is displayed in two bar charts: one for average weekday usage and one for average weekend usage. The usage value represents usage-to-date within the current bill period.
Example
This image shows an example of the Time of Day module:

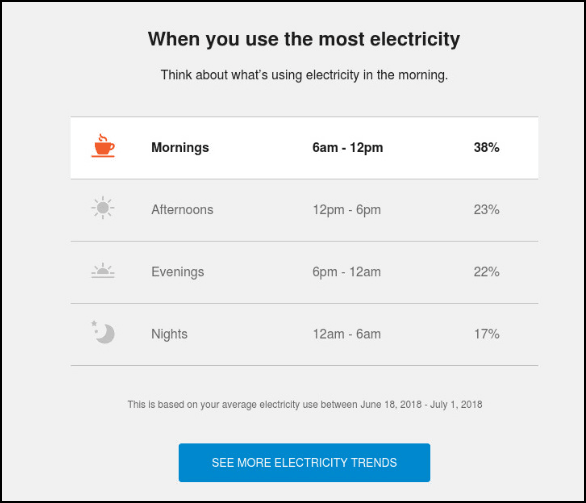
Depending on each utility's setup and configuration, an older version of the Time of Day module may be shown. The usage is categorized in mornings, afternoons, evenings or nights, and the usage is expressed as a percentage, so that the customer knows when to focus on being more energy-efficient. The six-hour time period with the most usage is highlighted, while the other three time periods display in a faded color.

Configuration Options
For each element listed in the table, indicate the desired configuration in the Input Value column. If you do not provide an input for optional configurations, the default will be used.
Note: The options below are for the version of the Time of Day module that shows bar charts for weekday and weekend usage.
| Configuration Options | Input Value |
|---|---|
|
Chart Headings The chart headings of the module are editable. Default:
|
Optional Choose one of the following:
|
|
Chart Footers The chart footers of the module are editable. Default:
|
Optional Choose one of the following:
|
|
See More Fuel Trends Button You can update the text on this button, as well as the URL to which the customer is directed when clicking the button. Default: "See More Details About Your Usage" You must also specify the URL the customer should link to when clicking the button. By default, it is configured to link to the Data Browser. |
Required Choose one of the following:
|