Near Real Time Usage
The Near Real-Time Usage widget displays unvalidated electric interval usage data for customers with AMI (Advanced Metering Infrastructure) meters. The data for this widget is delivered through an API built in partnership between the utility and Oracle Utilities Opower, and is designed to provide users with energy usage data and trends that are nearly current, as opposed to delayed or batch-processed data.
Requirements
Utility Requirements
- Utilities must coordinate with Oracle Utilities Opower to develop an API endpoint that supplies near real-time AMI interval data at the service point level. Oracle Utilities Opower will provide a YAML specification for the API.
- The API must provide interval data that is updated in near real-time, allowing end users to see the most current usage data available. The data should be unvalidated and available for direct, on-demand retrieval by the widget, with no local data storage on the widget side.
- Utilities must provide access to the API endpoint through an application ID and application key (sometimes called API key and API secret). These credentials are used to verify and establish a secure connection for data exchange.
- Utilities must be able to maintain and update their API as data standards evolve, and to participate in ongoing validation or troubleshooting as new integrations are introduced.
Customer Requirements
| Category | Description |
|---|---|
| Billing Frequency | Not applicable. Bill-level information is not shown. |
| Data Delivery Frequency | Not applicable. The utility will coordinate with Oracle Utilities Opower to develop an API through which usage data can be retrieved on demand. |
| Data Requirements | Subdaily AMI usage data must be made available through the API. Reads at 60-minute, 30-minute, 15-minute, and 5-minute resolutions are supported. If five-minute reads are supplied, they are aggregated to 15 minutes and displayed as 15-minute intervals. Customer and account identification data is required, including support for unique account and service point IDs, to securely and accurately associate customers’ data with their login. Your Delivery Team will work with you to understand the identification data that is required. |
| Data History | Subdaily usage data from the last 24-48 hours is required. |
| Data Coverage | The widget shows data for each read that is available. A blank space is shown for any missing reads. The bar graph displays as long as there is one read available. If there are no reads available in the past 24 hours, the widget displays an error message. |
| Supported Fuels | Electricity. |
Limitations
The widget supports the display of net energy use data for customers with solar technology. However, it does not support the display of data for customers who have multi-register meters rather than single-register meters. (Multi-register meters provide more details within an interval, such as the amount of energy that goes from the grid to the house or from the house to the grid due to solar power.)
User Experience
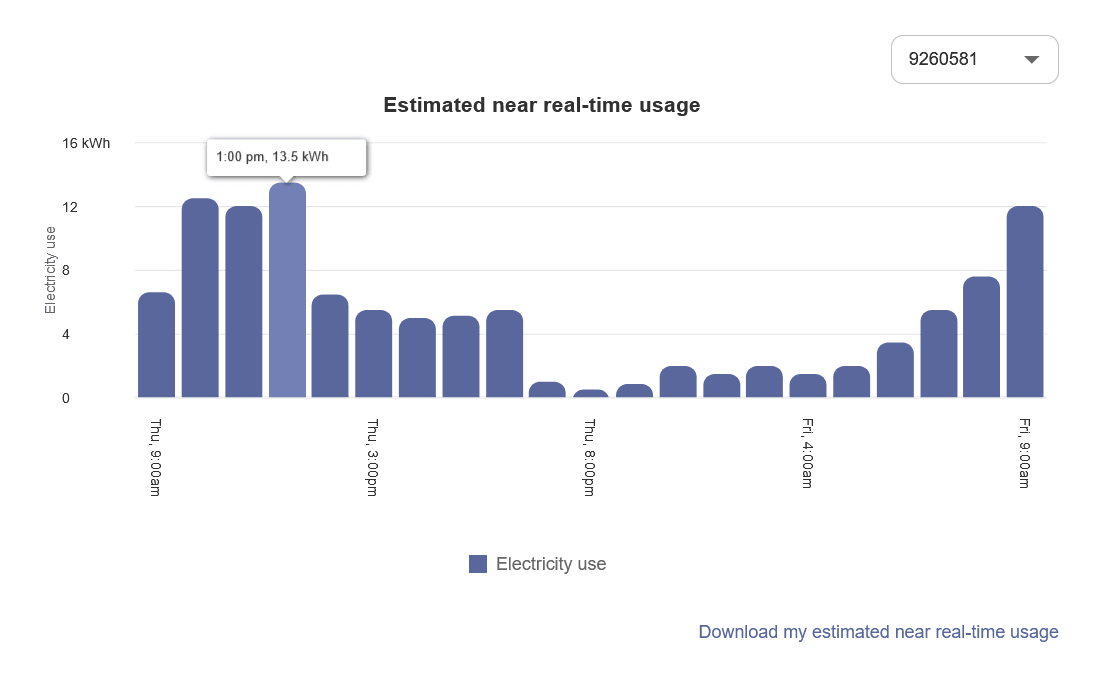
The Near Real-Time Usage widget displays AMI electricity usage for customers in the form of a bar graph, showing intervals of energy use for a service point at a premise from the past 24 hours. Compared to the Energy Use View of the Data Browser, the Near Real-Time Usage widget displays data that has not been validated. (Data in the Data Browser takes longer to display since it must be validated and loaded.)

Title: The title emphasizes that the data is estimated and near real-time to help customers understand how the data differs from what is displayed in the standard views of the Data Browser.
Meter ID: If a customer has a service point with two or more meters, then a drop-down list is displayed above the graph allowing customers to choose a meter ID and view data related to it. If a customer only has one meter, then only one meter ID is displayed above the bar graph.
Bar Chart: The bar graph uses a vertical axis (Y-axis) to show the usage intervals, and a horizontal axis (X-axis) to show the time period. The data is visualized in intervals for the current time, minus 24 hours. For example, if a customer logs in at 3 p.m., the widget will show data going back 24 hours to 3 p.m. from the previous day. Only data from the past 24 hours is shown. Customers cannot view historical data beyond this time period.
Tooltips: When a customer hovers over one of the interval bars, a tooltip displays the time of day and energy usage amount for that interval.
Download: Customers can download a CSV file containing usage data for the 24-hour period. The data in the downloaded file matches what is viewed in the widget. It only includes columns specifying the start time, end time, usage value, and unit of the customer’s energy usage.
User Experience Variations
Solar Data and Net Energy Display
If a customer has solar technology and net negative energy use, then the bar graph displays green bars for each interval when the customer’s home produces more energy than it consumed. The tooltip in this case displays a negative usage value, and the downloaded file shows negative usage values as well.