Viewing Usage History for a Premise
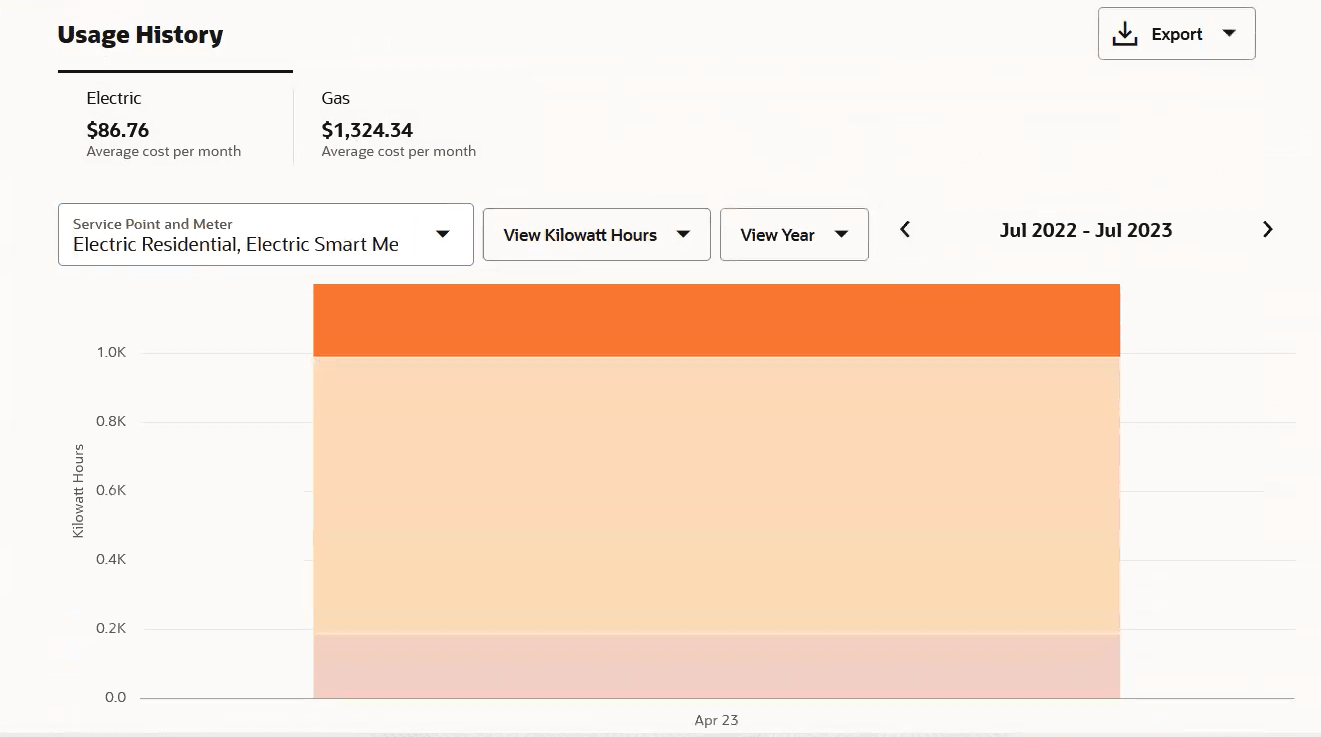
The Usage History section appears below the Customer History section of the Premise page, and provides a tab for each service type that has had usage at the premise. Each tab provides:
- The average cost per month of the selected service type
- A usage chart for the selected service type
- Options that enable you to specify the data that you want to render in the usage chart.
The options enable you to:
- Select the service point and meter you want to review.
- Select the unit of measure you want to view. The values that are available are based on the selected service type and usage history.
- Select the level of detail you want to view in the chart. The values that are available depend on the available data. For example, if no daily data is available, you cannot select the daily view for your chart.
- Use the arrows to scroll through the available data by date.
As you select different tabs and options, the system renders the usage chart based on your selections.
You can hover over a bar in the chart to view additional details in a tool tip, or you can click on a bar to change the chart view to a more granular view. For example, if you hover over a bar that represents a bill period, you can click on that bar to view a more detailed chart for that bill period. If available, the chart would then include a bar for each day in the bill period.
Note:
You can only access a more detailed chart if the detailed data is available. For example, if hourly data is not available, you can't click on a bar that represents a day to display an hourly chart.This image shows an example of the Usage History section of the Premise screen:
Figure 6-3 Usage History

Access Usage History from the Premise Screen
To access usage history information from the Premise screen:
- Access the Premise screen.
- From the Usage History section, select the sub-tab with the service type you want to view.
- The system displays the usage chart with the default options.
- Use these options to change your display:
- Select a different service type sub-tab.
- Select a different service point and meter.
- Select a different unit of measure.
- Select a different level of detail from the View filter.
- Scroll left and right to view a different date range.
- Hover over a bar to view usage details.
- Click on a bar to display a more detailed chart, if available.
Parent topic: Managing Premises