Using Usage Comparison Charts
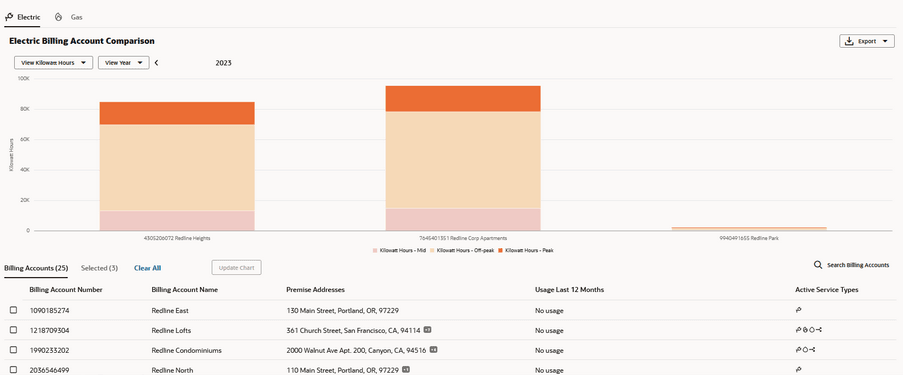
If your Oracle Fusion account has fewer than 20 billing accounts, or you have selected the billing accounts you want to view and compare, the system renders your chart. Using tabs above the chart, you can specify which service type you want to view. You can also change the data that is displayed in the chart using these options that appear at the top of the chart:
- Unit of Measure: Use this filter to display chart data in a specific unit of measure. The filter displays all unit of measure options that are available for the selected service type and billing accounts.
- Level of Detail: Depending on the data that is available for the selected accounts, you can use a filter to display the chart by year or month. This option is disabled for service types that charge a flat fee, as the selected level of detail is the only level of detail available for that service type.
- Date Range: You can use the arrows above the chart to change the date range
displayed in the chart. Click the arrow to the left of the date to see older data, and
click the arrow to the right of the date to see more current data.
Note:
By default, the system displays the most current data when you first access the chart. Be aware that the date range available for viewing is determined by the Historical Data Range Profile Option set by your utility. By default, the Historical Data Range is set to allow you to view 3 years of data.
This image shows an example of the Usage Comparison chart for multiple billing accounts:
Figure 5-17 Usage Comparison Chart

Compare Usage Data
- Access Account 360 for your key account and then click the Usage tab.
- If the account has 20 or fewer billing accounts, the usage chart is automatically
displayed. Skip to step 6.
If the account has more than 20 billing accounts, a list of associated billing accounts appears below the banner message, and the number of associated billing accounts is displayed next to the Billing Accounts field.
If all billing accounts are not displayed, scroll down to continue loading records in the billing account list. You can also select billing accounts by clicking Search Billing Accounts at the top of the list. Use the Select Billing Accounts window to search for and select the billing accounts you want to compare in the chart, and then click the Update Chart and Close button.
Be aware that search queries in the Select Billing Accounts window typically require an exact match. The premise address search is limited to the primary premise associated with the billing account. You can use wildcards to query on Address Line 1 of the premise address. For example, searching with %main will return all billing accounts where “main” is in the Address Line 1 field of the primary premise associated with the account in your customer information system.
- Using the check boxes at the beginning of each record, select the accounts you want to compare in the chart.
- As you select billing accounts, the Selected field displays the number of accounts you have selected. You can select up to 20 billing accounts for comparison.
- When you have selected all of the billing accounts you want to compare in the chart, click the Update Chart button.
- The chart is displayed, showing usage data for the current year for each selected
billing account. You can:
- Use the < and > buttons above the chart to view data for different years.
- Hover over a bar to view additional usage details.
- Click on a bar to display detailed usage data for the billing account.
- To export the chart data, click the Export button above the chart.
Parent topic: Using the Usage Tab