Peak Time Rebate
The Peak Time Rebate widget allows customers who are enrolled in Peak Time Rebates to view their historical peak event day rebate and energy saving information in a user-friendly graph.
Peak Time Rebate Example
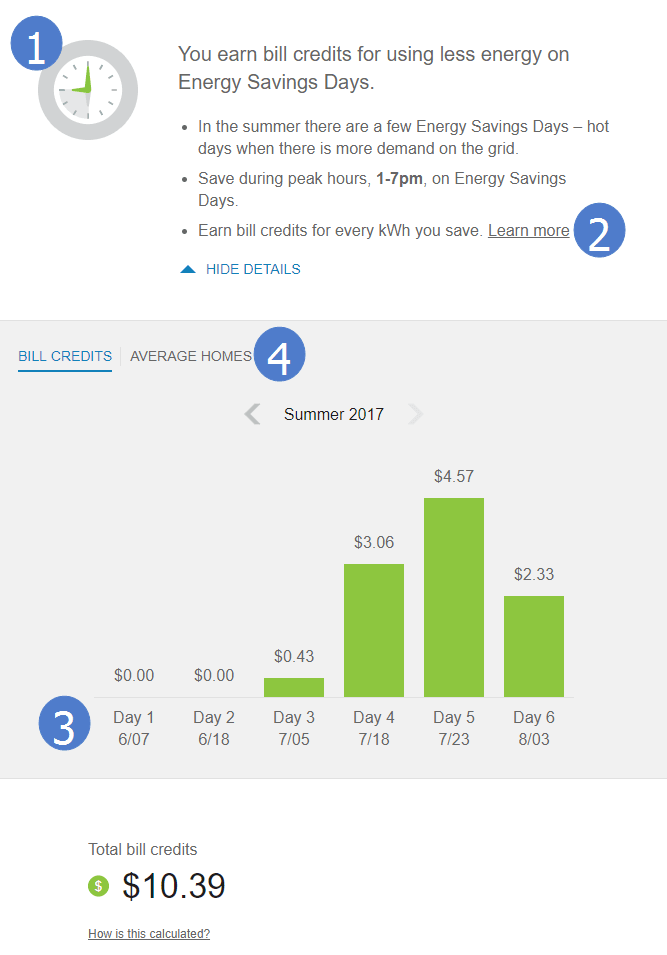
The following image shows a standard example of the Peak Time Rebate widget, and indicates the primary configuration options.

Configuration Options
For each element listed in the table, indicate the desired configuration in the Input Value column. If you do not provide an input for optional configurations, the default will be used.
| Configuration Option | Input Value |
|---|---|
|
Promotional Header List Prominent information about the Peak Time Rebates program is highlighted in the promotional header list. Default: The default list includes the following:
|
Optional Choose one of the following: Use the default list Modify the list by omitting one or more of the default list items |
|
Learn More URL Utilities must provide the Learn More URL location. |
Required Provide a URL destination. |
|
Number of Days Displayed in the Data View Utilities can modify the number of days displayed in the Data View. Default: The default is six days per season. Ten days per season is the maximum number of days that can be displayed in the Data View. |
Optional Choose one of the following:
|
|
Average Homes View This graph shows how much a customer has saved in comparison to average-saving homes within 100 miles. Note: The Average Homes View availability is determined by program design and is not available to customers on the Simple Money Track. Default: Disabled. |
Optional Choose one of the following:
|