Near Real Time Usage
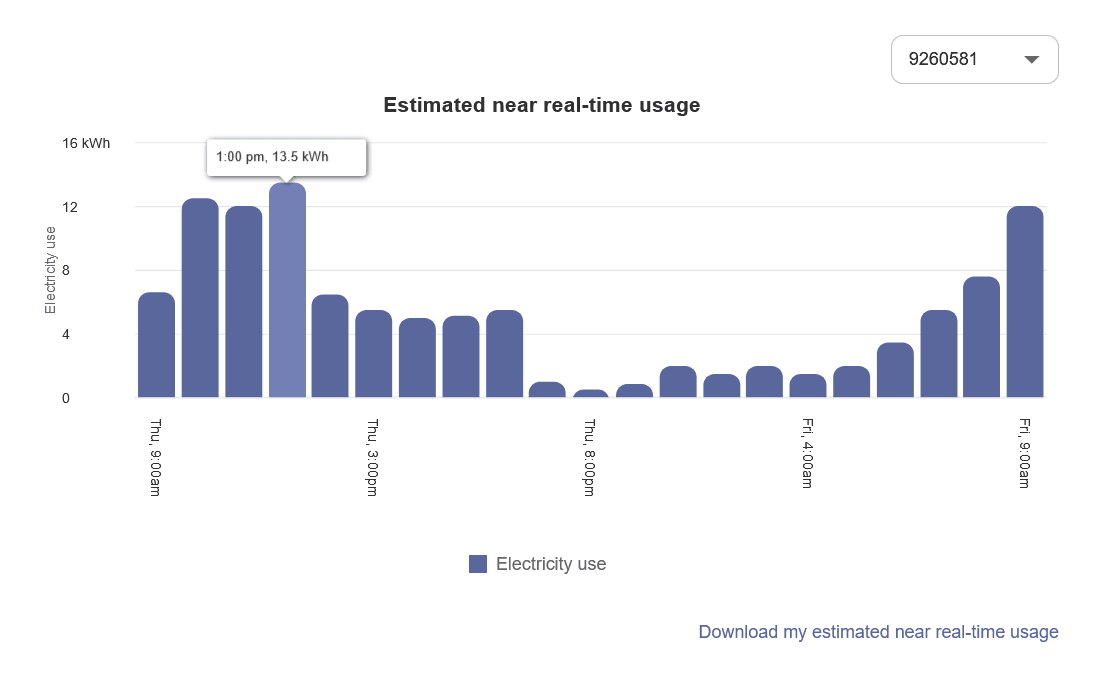
The Near Real-Time Usage widget displays unvalidated electric interval usage data for customers with AMI (Advanced Metering Infrastructure) meters. The data for this widget is delivered through an API built in partnership between the utility and Oracle Utilities Opower, and is designed to provide users with energy usage data and trends that are nearly current, as opposed to delayed or batch-processed data.

Embedding Guidelines
Widget Name: widget-real-time-ami
- Since this widget displays energy use trends over time as a bar graph visualization, it is recommended that you place it near the Data Browser widget.
- This widget is well-suited for embedding in sections that use the full width of the page. Consider the use of tabs, accordions, or other elements that can show or hide content when embedding this widget on a webpage along with other widgets and content.
For more information about the Near Real Time Usage widget, including details about its data requirements and overall user experience, see Near Real Time Usage in the product overview.