Water and Wastewater Views
The Water and Wastewater views of the Data Browser display how much water or wastewater a customer has consumed over time. Customers can view water or wastewater usage or costs for each bill over a 13-month period. If the required data is available, the customer can also view daily and subdaily data.
On this page:
Requirements
Same as listed in Data Browser. Additionally, note that the default unit of measure used in the Data Browser for water and wastewater is kilogallons (kgal). This value can be modified for locales or utilities that display water and wastewater use for their customers in different units of measure. It is recommended that the unit of measure displayed is consistent with the unit of measure customers see on their water and wastewater bills, and that this unit of measure is sent to Oracle Utilities Opower in the required data files.
Limitations
Same as listed in Data Browser.
User Experience
The Water and Wastewater views display how much water or wastewater customers are using over time, or how much money they are spending on water or wastewater. This section describes the user experience for customers who have both water and wastewater resources, as well as billing data and weather data.
Water Use Example

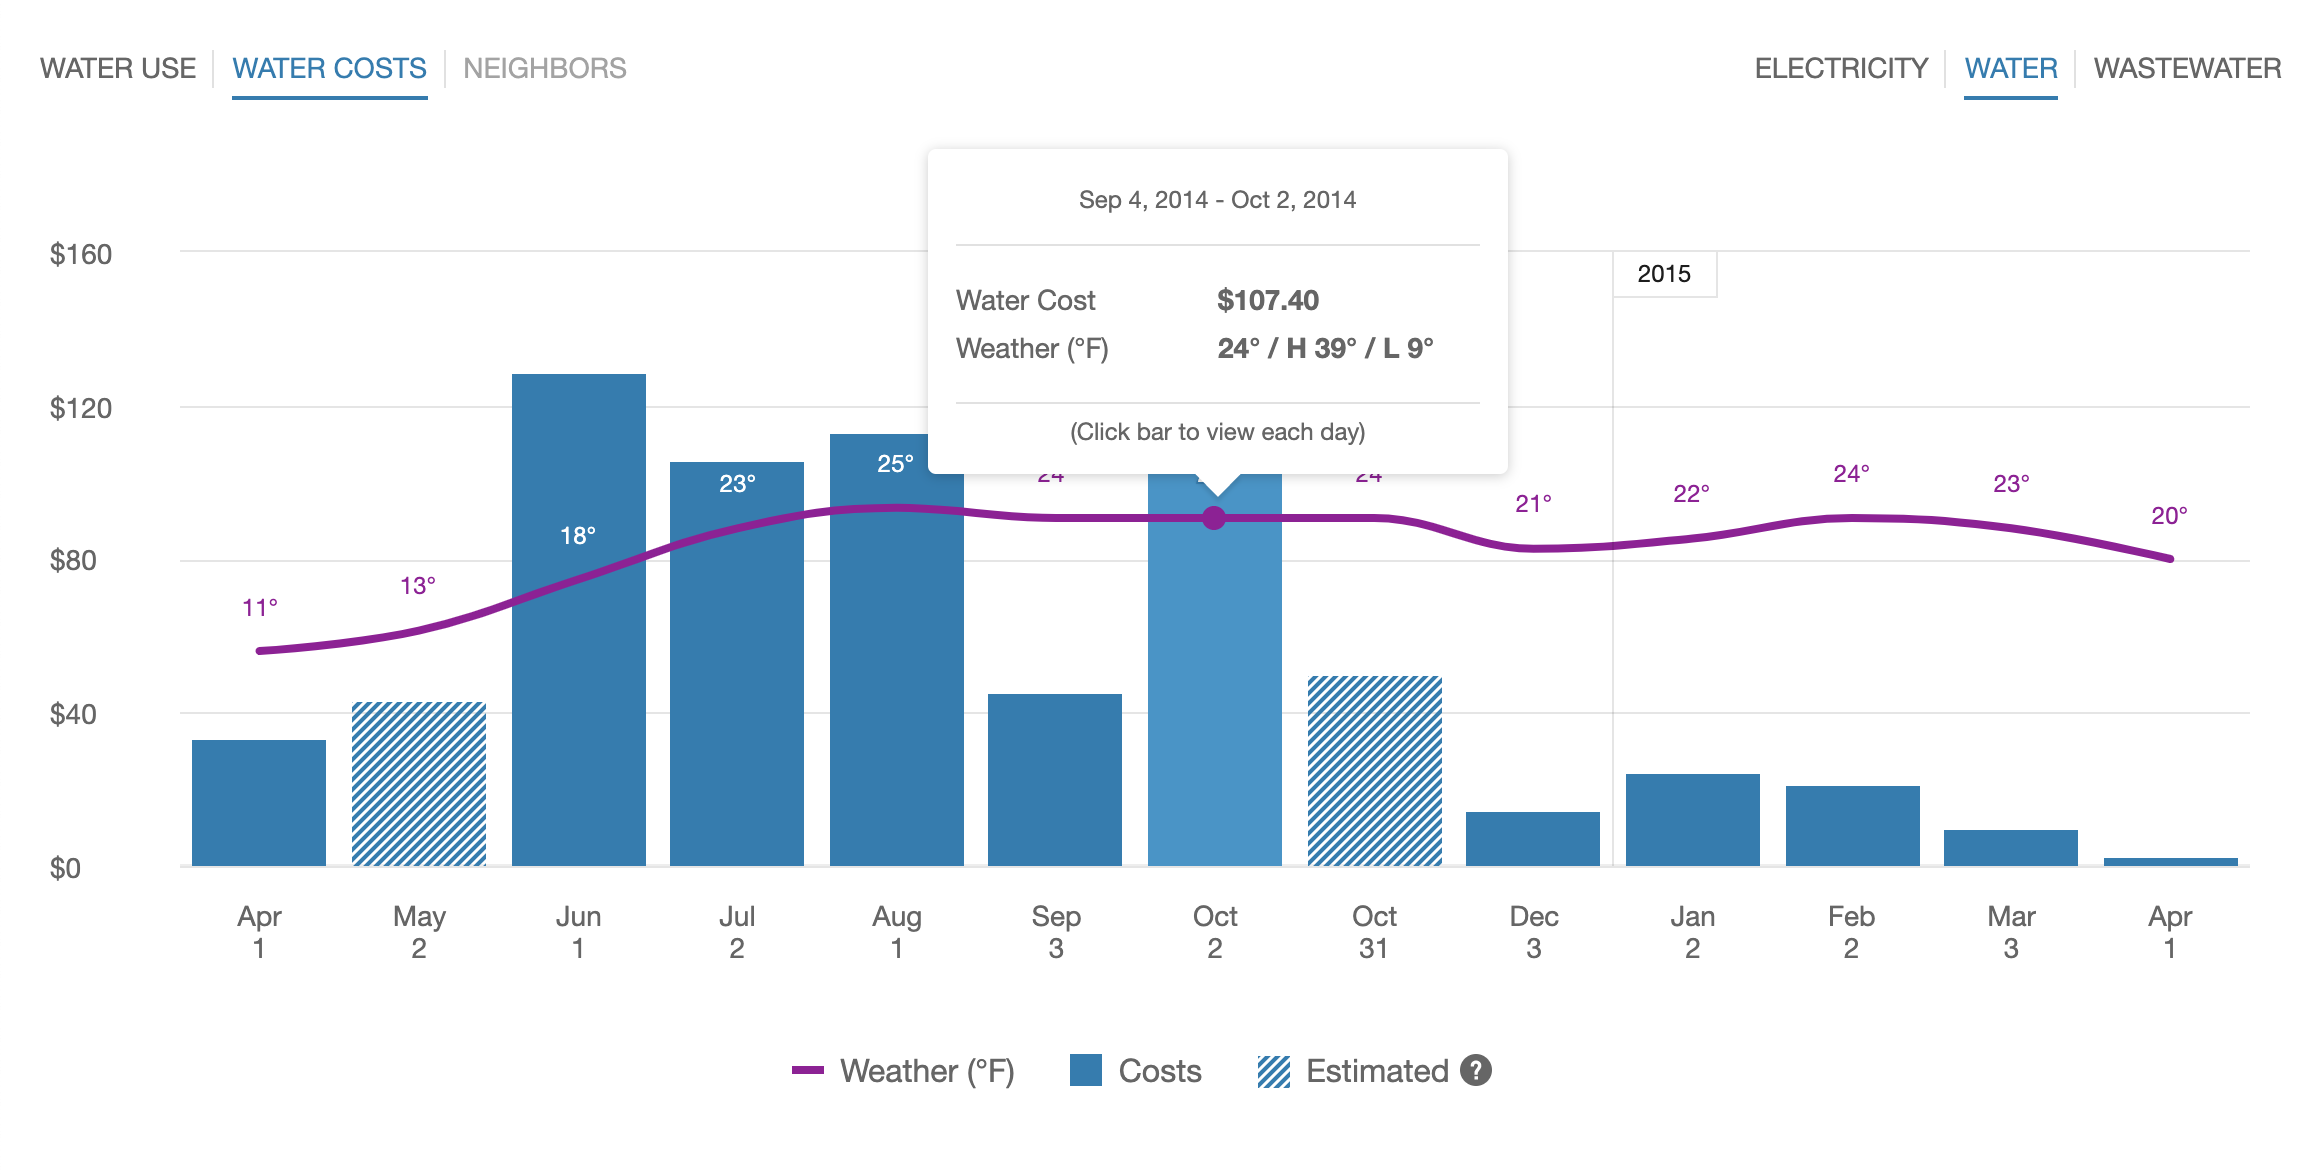
Water Costs Example
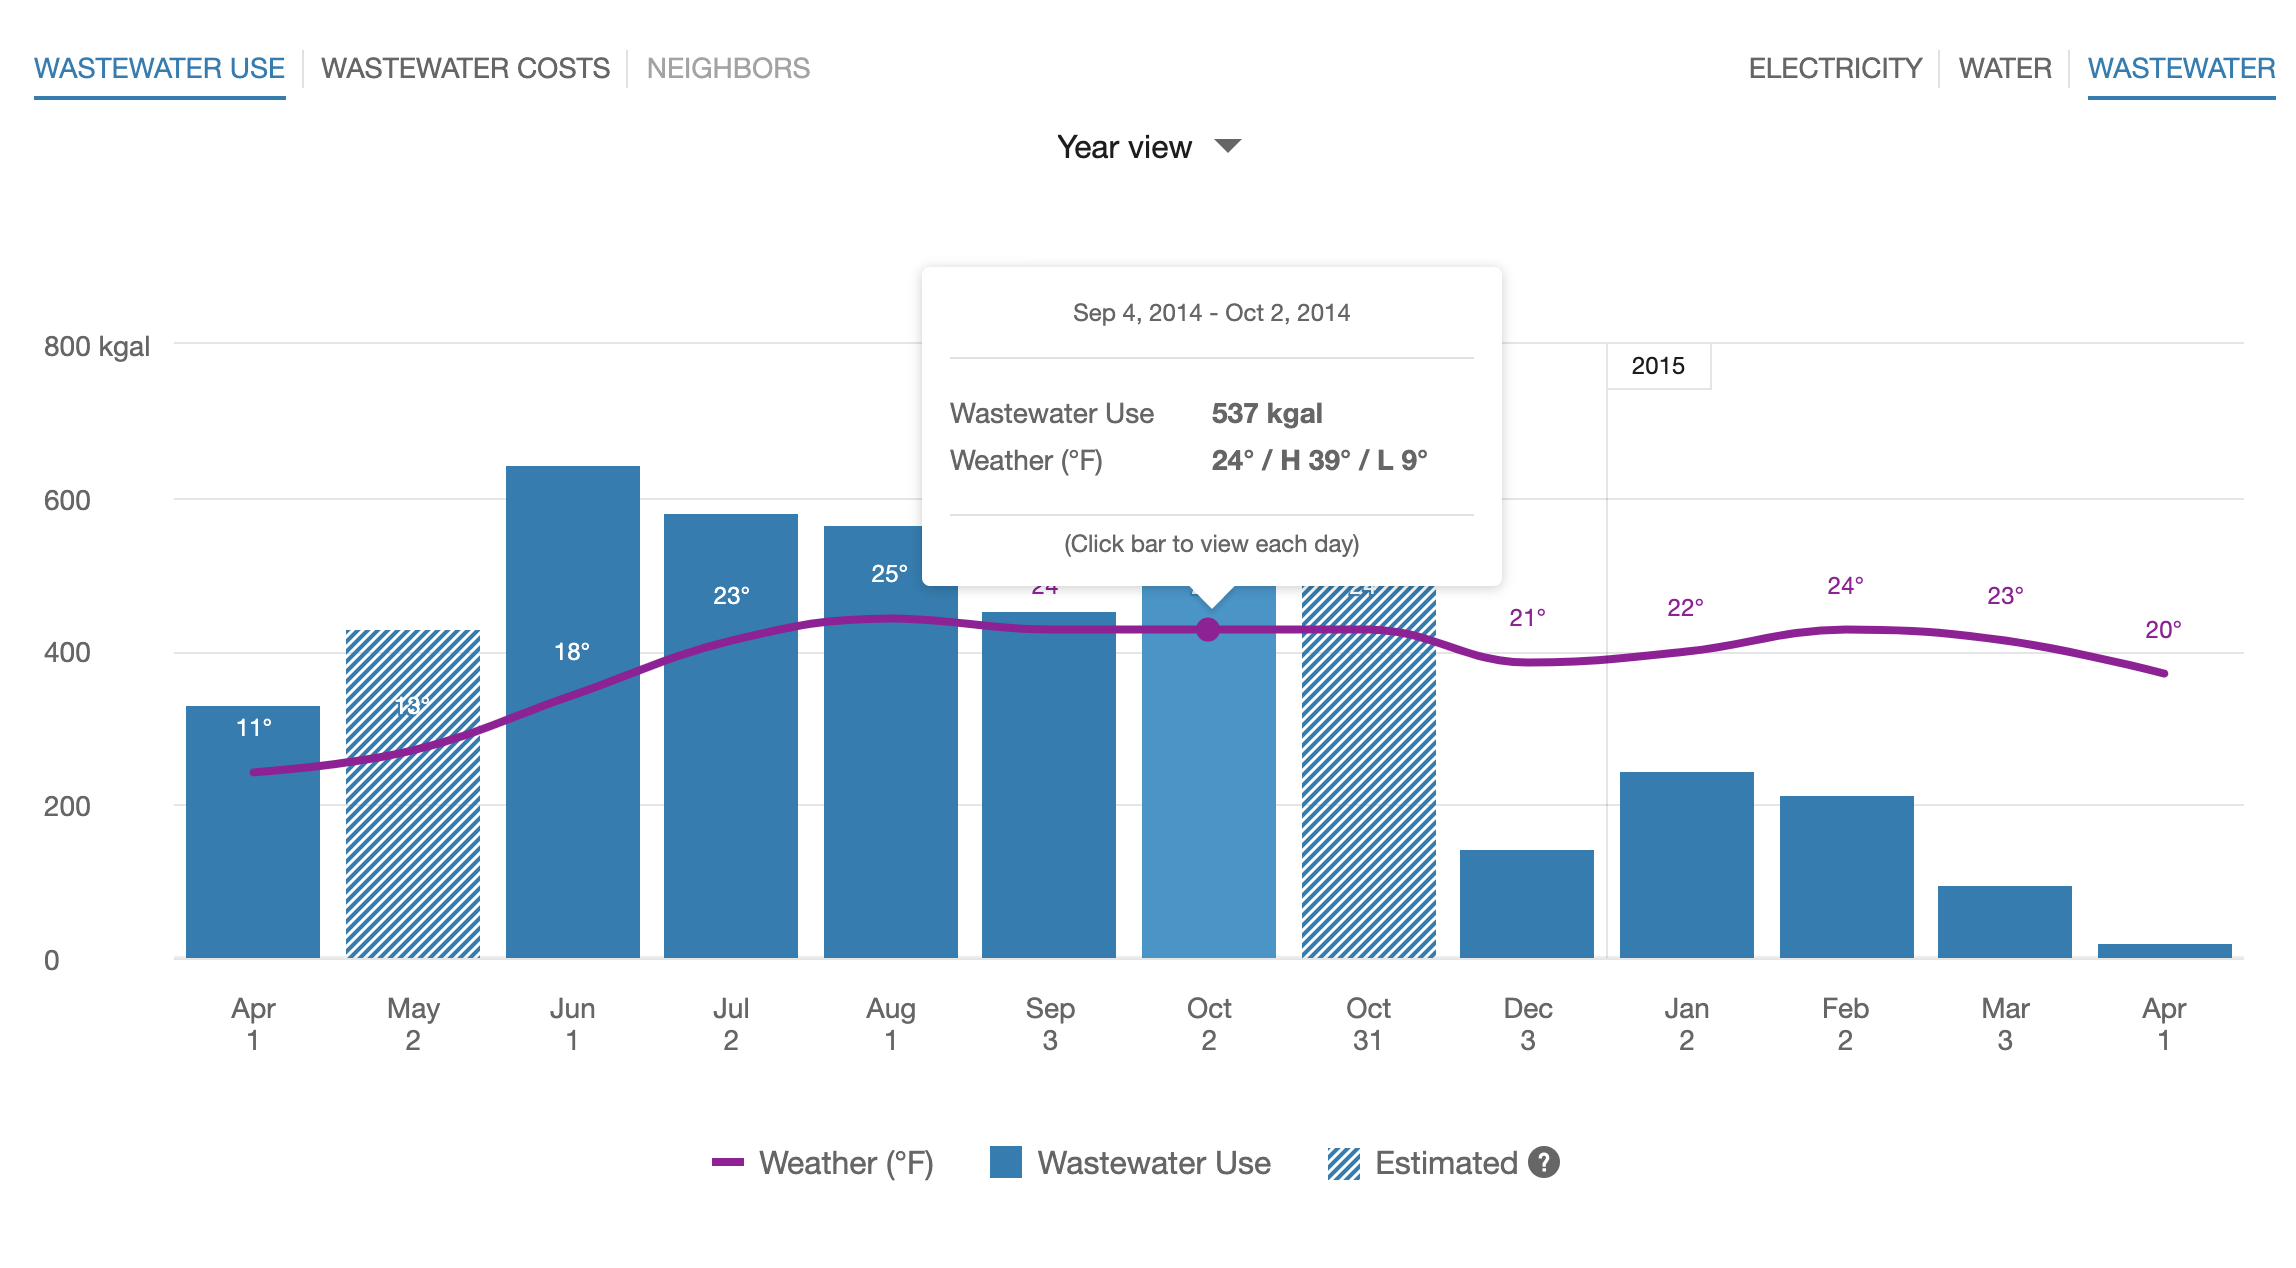
Wastewater Use Example
Resource Menu
Water is displayed by default. Customers who have multiple fuels or who have both water and wastewater will see options to switch between each resource type and view associated usage or cost information.
Time Menu
Depending on what data is available, the Water and Wastewater views present different kinds of trends and insights at varying levels of granularity over time:
- Year view: Water use or cost by each bill period in a year. Monthly, bi-monthly, and quarterly bills are supported.
- Bill view: Water use or cost by each day in a bill period. AMI data is required for this view.
- Day view: Water use or cost by each hour of a day (or another interval such as quarter of an hour). AMI data is required for this view.
There are also forward and backward buttons that customers can select to display contiguous blocks of time. In the Year view, for example, clicking the forward or backward button displays contiguous 13-month blocks of time for customers on monthly billing.
Bar Graph
The bar graph uses a vertical axis (Y-axis) to show water or wastewater usage or cost, and a horizontal axis (X-axis) shows the time period. The bars use the "You" color, which is blue by default and commonly changed to the utility's brand color.
Cost Information: The bar graph displays how much a customer was billed for water or wastewater use based on the cost value sent to Oracle Utilities in the billing data transfer specification. The Rates Engagement Cloud Service and rates modeling are required to display cost values in lower resolutions such as the Bill and Day views.
Usage Information: The bar graph displays how much water or wastewater a customer used, based on the water or wastewater usage value sent to Oracle Utilities in the billing data transfer specification. AMI data is required to display usage values in lower resolutions such as the Bill and Day views.
Lighter bars represent estimated bills or usage reads. See General Display Rules for details on how the graph behaves and how the data visualization can change depending on which view is selected.
Weather Data
A line graph representing the average temperature during each time period is overlaid on the bar graph. This allows customers to see how their usage relates to local weather patterns. The weather data is based on data from the airport weather station closest to the customer's location. See Weather Data for details on how weather data is retrieved.
Tooltips
Tooltips are displayed when customers interact with a data point on the graph. See Energy Tooltips for details on what the tooltips may include.
For AMI customers, a message is displayed at the bottom of tooltips for data points for each bill. This messaging acts as a tip for how a customer can quickly view hourly or sub-hourly data for a given bill.
Customers can also view data points for water usage or costs that have not yet been included on a bill. By default, up to 30 days of in-progress billing data can be displayed to a customer, which can be configured to align with the length of a customer's billing cycle. See Virtual Bills for details.
Disclaimer
Disclaimer messages can be added to the Water or Wastewater views that are specific to the view. The disclaimers can also include links to resources where customers can find more information.