Electric Vehicle Neighbor Comparison
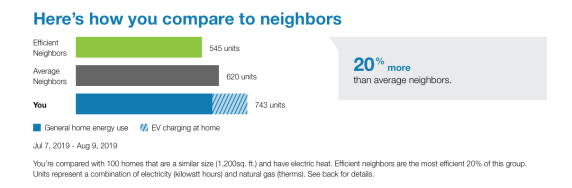
The Neighbor Comparison is designed to motivate customers to save energy based on how they see themselves in relation to their neighbors. It compares the customer (“You”) to two groups: “Efficient Neighbors” and “Average Neighbors.” The results are displayed in a horizontal bar graph. The "You" bar displays general home use and indicates what percentage of the home use was due to electric vehicle charging. A brief message indicates how the customer compares to their efficient neighbors. "Efficient Neighbors" are defined as the most efficient 20% of the customer's neighbors. An informational section below the bar graph provides details about the module information.
Note: This module may use "similar homes" language instead of "neighbor comparison" language. See Similar Homes Terminology for more information.
Bar Chart: The bar chart displays how much energy each group in the comparison used. Typically, the bar with the smallest value is on top and the bar with the largest value is on the bottom.
- You: This bar indicates how the customer is doing. The bar displays general home use and indicates what percentage of the home use was due to electric vehicle charging.
- Average Neighbors: This bar indicates how all the customer's neighbors are doing. It is usually a gray or neutral color. The energy use data that is shown is the mean energy use value.
- Efficient Neighbors: This bar displays a usage value for the most efficient 20% of the customer's neighbors. It is usually colored green because green is commonly associated with energy efficiency. Note that the efficient neighbors value that appears in the module is not an average of the top 20% of neighbors. A threshold value—the 20th percentile neighbor—is used to determine the efficient neighbors value. Efficient neighbors are not chosen in advance.
Normative Message / Insight Statement: The normative message appears below and to the right of the bar chart and provides an insight (for example, "29% more electricity than efficient neighbors") about why the bar chart appears the way it does. Specifically, it displays a percentage for either how much more or less the customer used compared to their "efficient neighbors," or how much more or less the customer used compared to "neighbors" (that is, all neighbors, including efficient neighbors).
Neighbors or Similar Homes Description: The neighbor comparison module in reports displays a neighbor description that summarizes the characteristics of the neighbors that the customer is being compared to. This information helps assure customers that the comparison is fair and accurate. The information is dynamic and varies automatically based on how the customer’s neighbors were selected. One or more of the following elements may be included:
-
Number of Neighbors: The actual number of neighbors the customer is compared against. The number of neighbors is targeted at 100, but if not enough qualified neighbors exist a smaller number may be used. Reports are only generated for households with a minimum number of qualified neighbors.
Note: Neighbors are defined by site rather than by occupant. For example, if an occupant of a neighbor home relocates over the course of the program and another resident moves in, the comparison will subsequently be to the new occupant of the same home. Neighbor sites are nearby homes that have characteristics that typically lead to similar energy needs such as home size, heating source, and weather. They only include homes that appear to be occupied at the time of the comparison. Note that they are not necessarily homes on the same street.
- Proximity: The geographic proximity of the neighbors' homes. This number is rounded to the nearest whole unit to simplify the information and to assure customers that they are being compared against homes that are nearby.
- Home Size: The average home square footage.
- Heat Type: The heating type of the neighbors, such as gas or electric heating.
Customer Bill Alignment: Occasionally, the customer's previous bills do not coincide exactly in time with the previous bills of the customer’s neighbors. In order to arrive at the neighbor averages, it is necessary to align the neighbor energy use amounts with the customer's energy use amounts. In these scenarios, the application pro-rates, or "time-shifts," the neighbor bills to align with the customer bills by determining and adjusting for the amount of overlap. The time-shifted neighbor bills are then used to determine the neighbor averages.
Fuel: Electric-only and dual fuel.
AMI Data Required: Hourly AMI and Appliance Detection and Disaggregation.
Data History: A minimum of one historical bill
Billing Frequency: Monthly, bi-monthly, or quarterly.