Customer Experience Overview
Home Energy Reports are user-friendly print communications that provide personalized information to customers about their energy use. The reports include two pages of content that consist of modules. Modules are separable pieces of content that communicate some type of relevant and engaging information to the customer. When printed out, the reports are a single page, with content on the front and back.
Report Front: The front of the report displays customer information at the top, highlights how the customer's energy use compares to their neighbors in the center, and provides an energy-saving tip at the bottom.
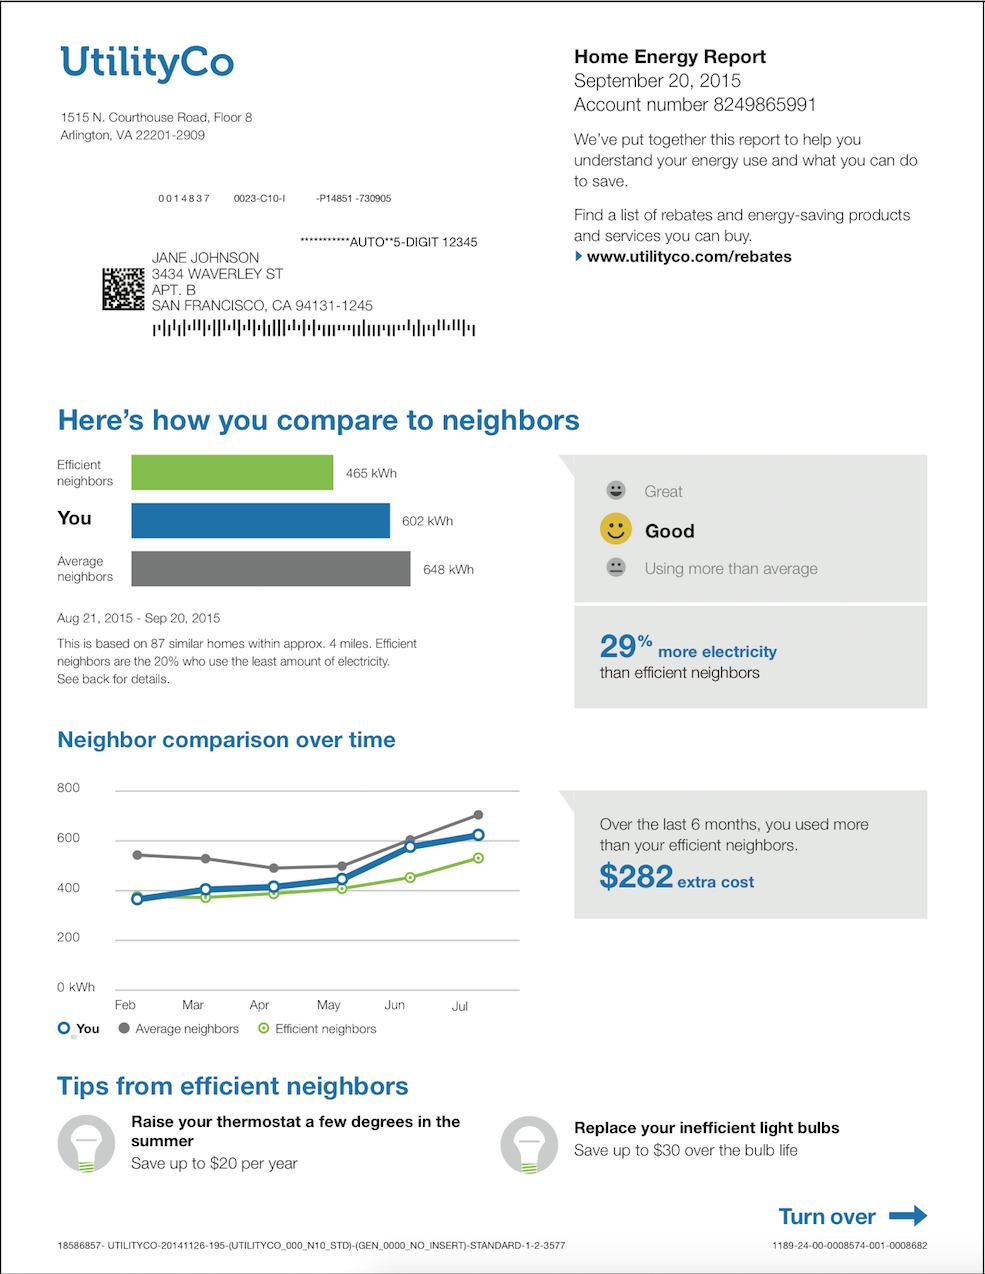
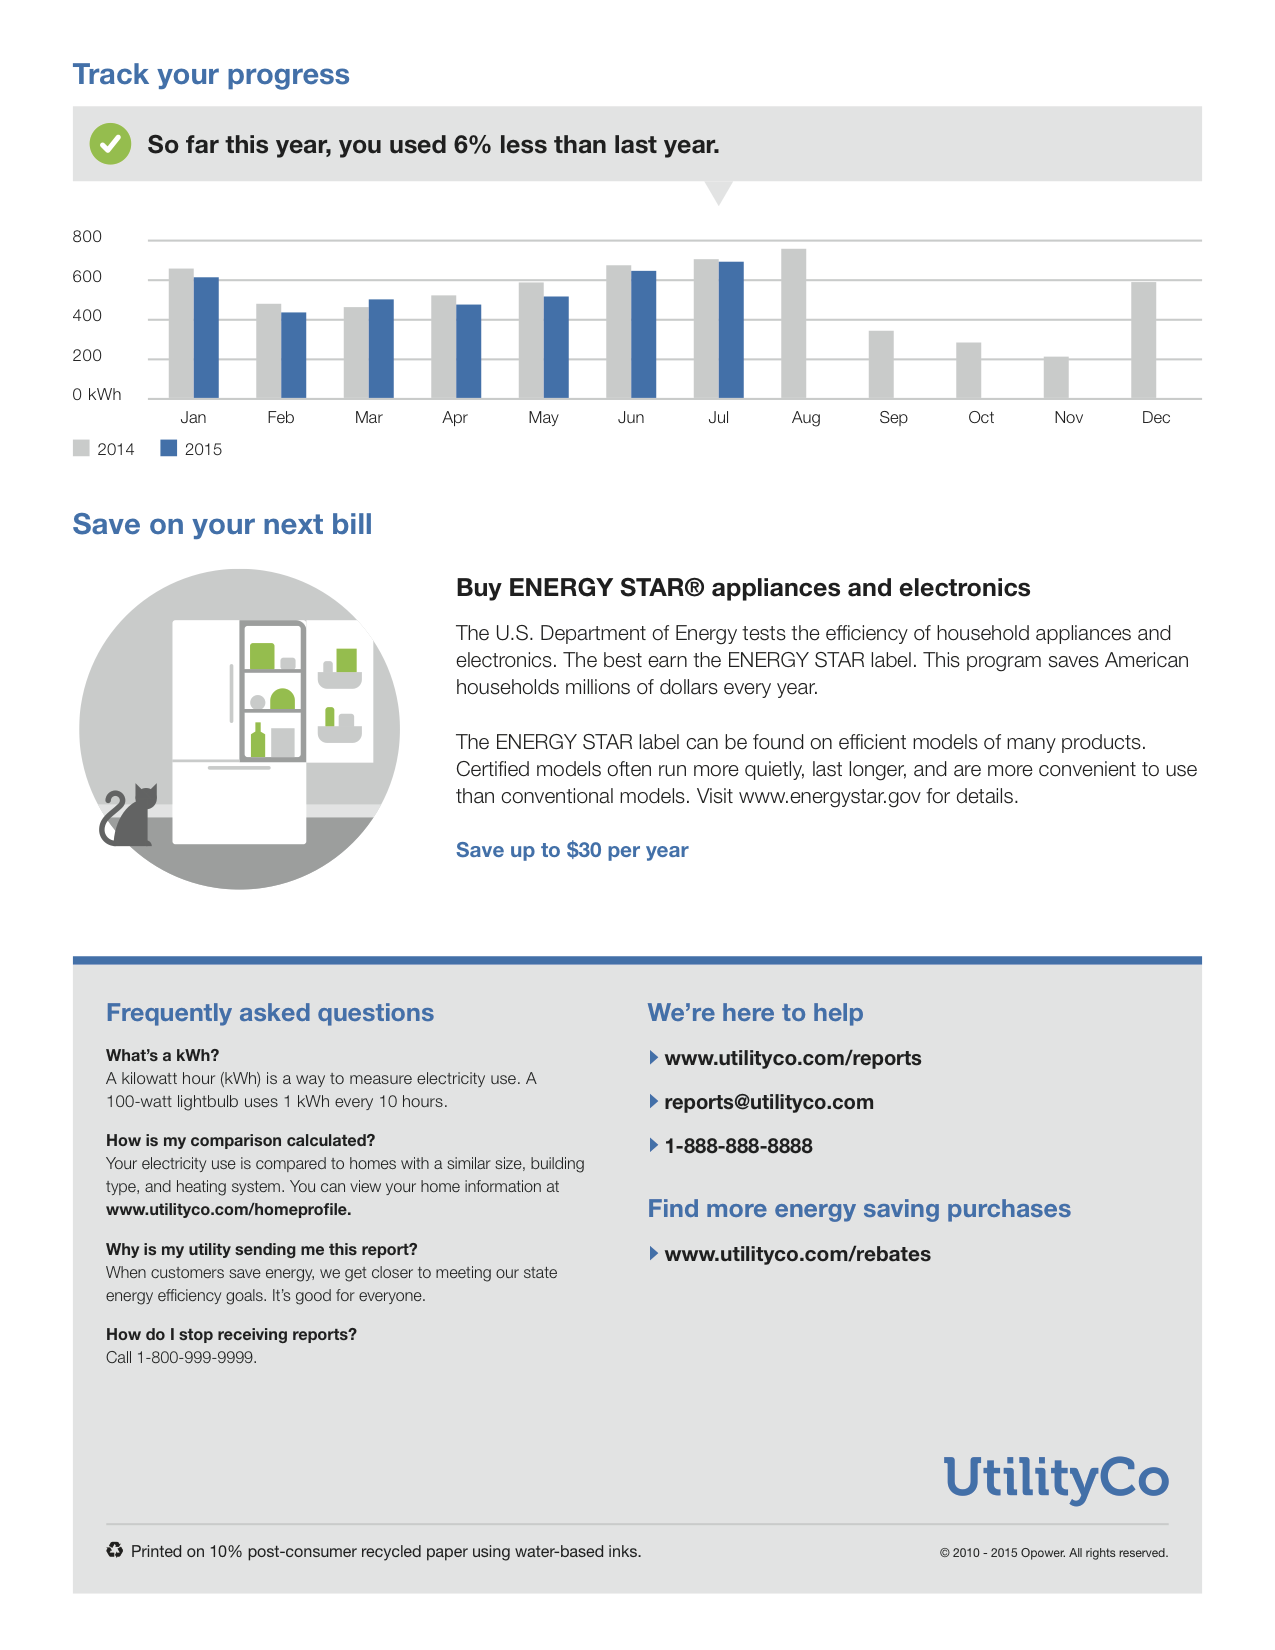
Report Back: The back of the report provides an in-depth look at the customer's energy use over time, contains utility contact information, and provides answers to frequently asked questions. The standard layout includes one large tip or marketing module. A layout option to include a second marketing module is available.
Report Editions
During program launch, each customer is assigned to a report edition or experience. Typically, all customers in the program receive a similar report experience. In some instances, there may be multiple report experiences to which customer segments are assigned based on program goals. This allows for A/B testing and accommodates utilities that have both electric and gas customers. See Report Editions for more information.
Report Modules
Each section of a report is referred to as a module. Modules are separable pieces of content that communicate some type of relevant and engaging information to the customer. Because reports are dynamic, different modules can appear in each slot over time. Certain modules may be more relevant to customers at a specific time of year. Only a subset of available modules described will appear on any individual report. See Report Modules for more information.
Report Layouts
Every report is delivered in a utility-branded envelope and has a particular layout containing "slots" in which modules are placed. Modules must be placed in the appropriately sized slot on the report. See Report Layouts for more information.
Similar Homes Terminology
Depending on each utility's setup and configuration, customers may see "similar homes" terminology in the user interface instead of "neighbor comparison" terminology. Utilities can choose to use one type of terminology or the other based on how they think their customers will react to Oracle Utilities Opower products.
The table below gives a few examples of how and where such differences in terminology may appear. As the table shows, the variation is most likely to appear in features that compare a customer's energy use against that of other customers.
|
Product or Feature |
Neighbor Comparison Terminology |
Similar Homes Terminology |
|---|---|---|
|
Neighbor Comparison in Print Reports |
"8% less electricity than efficient neighbors." |
"8% less electricity than efficient similar homes." |
|
Neighbor Comparison in the Oracle Utilities Opower web portal. |
"Who are my neighbors?" |
"What homes are compared?" |
These variations are not extensive and only appear in a few places. If you are not sure which variation is used by your utility, check with your supervisor.
Report Tips
Home Energy Reports contain tips to help customers lower their energy use. Tips are selected from a library of energy saving recommendations crafted by Oracle Utilities Opower energy efficiency analysts and are approved by the utility during the launch of the program. These tips can be configured to include information on related utility programs when applicable. See Intelligent Tip Targeting for more information about the tip selection process. You can also see the Oracle Utilities Inside Opower Product Overview to learn about tip content editing options that may be available to your utility.
Report Types
There are different types of reports based on the fuels that customers receive from their utility. The following report types are supported:
- Single Fuel Electric: Reports for customers who only have electricity. The energy units are displayed as kilowatt-hours (kWh).
- Single Fuel Natural Gas: Reports for customers who only have natural gas. The energy units are displayed as therms, CCF, or m3.
- Dual Fuel - Electric and Natural Gas: Reports for customers who have both electricity and natural gas. The energy units are displayed using an Energy Index (units), which combines electricity usage (kWh) and natural gas usage (therms, CCF, or m3) into a single measurement.