Time of Use 101
The Time of Use 101 module educates customers about when electricity is most expensive based on their time of use rate plan. The module provides customers with information such as whether electricity prices differ on weekdays and weekends, how much more expensive peak prices are than off-peak prices, the hours during which electricity is most expensive, and a visual time line displaying off-peak, partial-peak, and peak hours.
The module serves the dual purpose of educating customers about their specific rate plan at the specific time the report is generated and providing educational information about why saving during peak is especially important.
Appears in: Time of Use Report
On this page:
Requirements
Utility Requirements
|
Category |
Description |
|---|---|
|
Required Cloud Service |
Oracle Utilities Opower Energy Efficiency Cloud Service |
|
Scale |
Not applicable. |
Customer Requirements
|
Category |
Description |
|---|---|
|
Billing Frequency |
Monthly or bi-monthly. |
|
Data Delivery Frequency |
Monthly, bi-monthly, or quarterly. |
|
Data Requirements |
The Time of Use rate plan. Information from the plan is needed to identify peak time periods and other basic rate details such as peak hours and any applicable peak time changes throughout the year. |
|
Data History |
Not applicable. |
|
Data Coverage |
Not applicable. |
|
Supported Fuels |
Time of Use Report: Electricity-only, gas-only, or dual fuel. Peak Focused Report: Electricity-only. |
Limitations
- Number of Rates: A maximum of three rate types (peak, mid-peak, off-peak or super peak, peak, or off-peak) can be displayed at a given time.
- Off-Peak Hours (Welcome Report Only): For the purpose of this report, Super Off-peak and Super Saver rates are included in a single off-peak timeline category. For example, a customer with multiple off-peaks will see all off-peaks represented as a single off-peak category on the timeline.
User Experience
This section describes the user experience for the Time of Use 101 module for a customer with a single weekday peak, no weekend peak hours, and a seasonal variation.
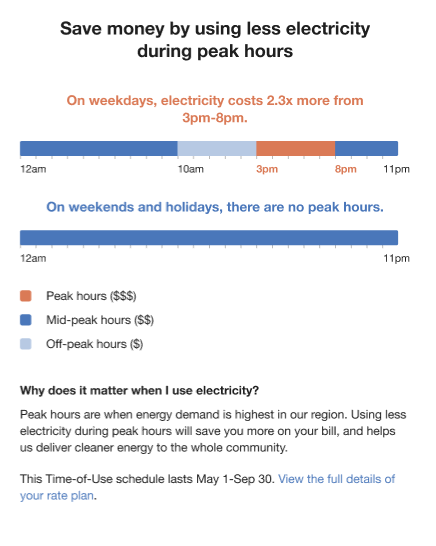
Heading: The heading tells the customer that they can save money by using less energy during peak hours.
Weekday Subheading and Graph: The weekday subheader varies by rate plan and tells customers how much more their energy costs during peak hours. The graph notes the price ratio and relevant peak hours:
- Weekday Price Ratio: The weekday price ratio is dynamic by rate plan and compares the most expensive rate to the least expensive rate.
- Weekday Peak Hours: The weekday peak hours displays the most expensive period for the week.
Weekend Subheading and Graph: The weekend subheader notes whether or not there are peak hours on weekends.
- Weekend Price Ratio: If the utility has weekend peak hours, the ratio is dynamic by rate plan and compares the most expensive rate to the least expensive rate.
- Weekend Peak Hours: If the utility has weekend peak hours, the peak hours displays the most expensive period for the weekend.
Graph labels: The graph labels identify which periods in the graphs fall into peak, mid-peak, or off-peak hours.
- Peak Hours: The high cost period label displays the most expensive time range. It is dynamically rendered based on the customer's rate plan details.
- Mid-Peak Hours: The medium cost period label displays neither the most or least expensive time range. It is dynamically rendered based on rate plan details.
- Off-Peak Hours: The low cost period label displays the least expensive time range. It is dynamically rendered based on rate plan details.
Explainer: The details section explains to the customer why it matters when they use energy.
Seasonal Details: The seasonal details section notes the dates that apply to the TOU schedule if the rate plan includes seasonal variations. For example, "This Time-of-Use schedule lasts [May 1-Sep 30]." If the rate plan does not include a seasonal variation, the seasonal details section is omitted.
Call to Action: The call to action invites the customer to view their full plan details and provides a link to the utility's rate plan page.
User Experience Variations
The user experience of the feature may vary for customers and utilities depending on their service types, available data, costs, locale, and other factors.
Timeline Subheading Text
The timeline subheading text varies based on the customer's rate plan and the type of days displayed in the sliding scale. The following table shows examples of the insight statement variations for different rate plans and day scenarios.
| Peak Type | Peak Period | Timeline Subheading |
|---|---|---|
| Single Peak | Daily | Every day, electricity costs X from [X am/pm] - [X am/pm]. |
| Single Peak | Week day | On weekdays, electricity costs X from [X am/pm] - [X am/pm]. |
| Single Peak | Weekend | On weekends, electricity costs X from [X am/pm] - [X am/pm]. |
| Double Peak | Daily | Every day, electricity costs X from [X am/pm] - [X am/pm] and [X am/pm] - [X am/pm]. |
| Double Peak | Week day | On weekdays, electricity costs X from [X am/pm] - [X am/pm] and [X am/pm] - [X am/pm]. |
| Double Peak | Weekend | On weekends, electricity costs X from [X am/pm] - [X am/pm] and [X am/pm] - [X am/pm]. |
| No Peak | Weekend - Same All Day | On weekends, there are no peak hours. |
| No Peak | Weekend - Multiple Off-Peak Rates | On weekends, there are no peak hours. |