Efficiency Zone
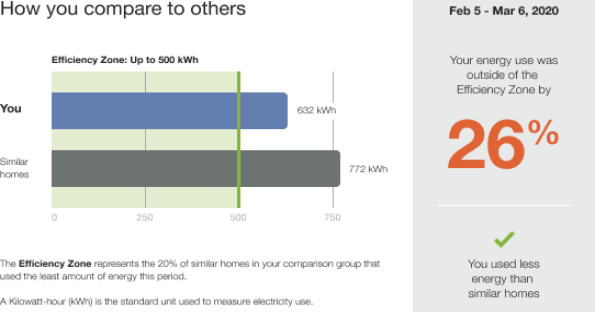
The Efficiency Zone module is designed to motivate customers to save energy based on how they see themselves in relation to similar homes. It reframes the Efficient Homes concept from the Neighbor Comparison to improve customer satisfaction without heavily compromising energy efficiency. The module is comprised of a bar graph that compares customer and similar homes usage against an Efficiency Zone, and insights that place the customer's usage in context. Usage below or up to the threshold is considered in the "efficiency zone." The Efficiency Zone threshold is the average use of the most efficient 20% of similar homes during that bill period and might change with each report.
The normative comparison in Digital Self Service - Energy Management mirrors the customer's report experience. For example, a customer that receives the Efficiency Zone in their report will also see an Efficiency Zone in Digital Self Service - Energy Management. For more information about the web version of the Efficiency Zone, see Digital Self Service Energy Management Efficiency Zone.
Appears in: Progress Report, Welcome and Announcement Report, Limited Income Report, Time of Use Report
Note: Utilities have the option of including either the Efficiency Zone or Three-Bar Neighbor Comparison module in most report types.
On this page:
Requirements
Utility Requirements
|
Category |
Description |
|---|---|
|
Required Cloud Service |
Energy Efficiency Cloud Service |
|
Scale |
Less than 100,000 per week |
Customer Requirements
|
Category |
Description |
|---|---|
|
Billing Frequency |
Monthly, bi-monthly, or quarterly |
|
Data Delivery Frequency |
Monthly, bi-monthly, or quarterly |
|
Data Requirements |
Billing data and third-party data (GSI and parcel data) |
|
Data History |
A minimum of one historical bill |
|
Data Coverage |
Not applicable. See Data Requirements. |
|
Supported Fuels |
Monthly, bi-monthly, or quarterly |
Limitations
- Home Energy Reports vs. Web: HER v3 customers receive an Efficiency Zone user variation in the web product which differs slightly from the Efficiency Zone in the reports. See the Neighbor Comparison section of the Oracle Utilities Opower Digital Self Service - Energy Management Cloud Service Product Overview for more information.
-
Third-Party Data: Third-party data (GIS and parcel data) is needed to identify neighbors for the neighbor selection process.
-
Neighbor Selection: A minimum number of neighbors (the default target is 100) must be selected for the customer. See Neighbor Selection - Detailed for more information.
-
Solar Report: The Efficiency Zone cannot be included in the Solar Report. Solar customers receive a solar variation of the three-bar neighbor comparison. See Three-bar Neighbor Comparison for more information.
User Experience
Efficiency Zone
Appears in: Progress Report, Welcome and Announcement Report, Limited Income Report, Time of Use Report,
This image is an example of the Efficiency Zone.
User Experience Variations
The user experience of the feature may vary for customers and utilities depending on their service types (gas, electricity, dual fuel, and so on), available data, costs, locale, and other factors. For more information, see the Oracle Utilities Opower Energy Efficiency Cloud Service Overview and go to the User Experience Variations section.
Configuration Options
For each element listed in the table, indicate the desired configuration in the Input Value column. If you do not provide an input for optional configurations, the default will be used.
|
Configuration Option |
Input Value |
|---|---|
|
Efficiency Zone Color A green tinted rectangle and darker vertical line indicate the range and upper boundary of the Efficiency Zone, enabling customers to quickly see whether they are in or out of the zone. Default: A green tinted area. The default color is strongly recommended. |
Optional Choose one of the following:
|
|
You Bar Label The bar graph label can be changed. Default: You |
Optional Choose one of the following:
|
|
Similar Homes Label The bar graph label can be changed. Default: Similar Homes The default label is strongly recommended. |
Optional Choose one of the following:
|
|
Similar Homes Bar Color Colors in the graph can match the utility’s color palette. This change requires a branding check by the Oracle Utilities Opower Client Design Team. Default: The colors in the example represent the default colors. |
Choose one of the following:
|
|
Explainer Text The explainer text defines the Efficiency Zone for the customer. Default: "The Efficiency Zone represents the 20% of similar homes in your comparison group that used the least amount of energy this period." |
Optional Choose one of the following:
|
|
Fuel Explainer The fuel explainer provides a definition of the fuel measurement. Default: The default varies by fuel type. Electric Only: A Kilowatt-hour (kWh) is the standard unit used to measure electricity use. Gas Only: A therm is a standard unit of measurement used to calculate gas use. Dual Fuel: A unit is a combined measurement of electricity (kWh) and gas (therm) use. |
Optional Choose one of the following:
|