Forecast Module
The Forecast module displays the customer's projected energy use for the current bill period and compares it to the energy use from the previous bill period, or to the same bill period from the previous year. The user experience is identical in both scenarios except for minor differences in the messaging. The description below is for a comparison to the previous bill period.

Title: The title describes the fuel type and tells the customer what months are being compared.
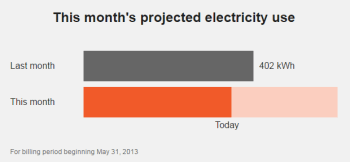
Graph: The comparison graph includes two bars that display the customer's energy use from the previous bill period and the customer's forecasted energy use for the current billing period. The forecast calculation is based on historical usage data and weather data. See Calculations for more information.
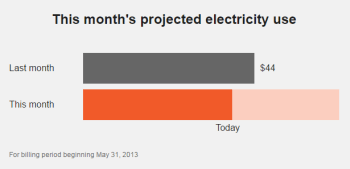
- Last Month: The Last Month bar contains a numerical value that reflects the actual amount of energy that the customer used.
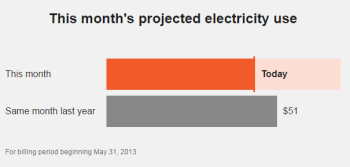
- This Month: The This Month bar estimates the customer's use in the current bill period, as indicated by the Today line. The rest of the bar is a lighter color to indicate the amount of energy that the customer is estimated to use by the end of the billing cycle. The This Month bar does not have a specific amount associated with it. This is because the customer should not associate a specific number with an estimated bill, but should instead be encouraged to reduce their energy use before the billing cycle is complete. Note that this bar is a fixed image that does not adjust dynamically depending on the customer's estimated current usage or cost.
-
Inclusion of Cost Information: Cost information is displayed in the Last Month bar if the utility sends a billed usage value to Oracle Utilities.

-
Comparison to the Same Month from Last Year: Depending on your utility's setup and configuration, a comparison to the same month from the previous year may be displayed instead of a comparison to the previous month. In this case, the messaging for the compared bill period is slightly different.

Date Range: The date range displays the beginning of the bill period so that the customer has a time-based reference point. Depending on the utility's setup and configuration, this text region may also include a disclaimer.